

Abstract
The extent to which fluctuating selection can maintain evolutionary stasis in most populations remains an unresolved question in evolutionary biology. Climate has been hypothesized to drive reversals in the direction of selection among different time periods and may also be responsible for intense episodic selection caused by rare weather events. We measured viability selection associated with morphological traits in cliff swallows (Petrochelidon pyrrhonota) in western Nebraska, U.S.A., over a 14-year period following a rare climatic event. We used mark-recapture to estimate the annual apparent survival of over 26,000 individuals whose wing, tail, tarsus, and bill had been measured. The fitness functions associated with tarsus length and bill dimensions fluctuated depending on annual climate conditions on the birds’ breeding grounds. The oscillating yearly patterns may have slowed and occasionally reversed directional change in trait trajectories, although there was a trend over time for for all traits except tarsus to increase in size. The net positive directional selection on some traits, despite periodic climate-associated fluctuations, suggests that cliff swallow morphology in the population is likely to keep changing and supports recent work contending that selection in general does not fluctuate enough to be an effective driver of stasis.
Keywords: cliff swallow, climate, colony size, directional selection, fluctuating selection, morphology, Petrochelidon pyrrhonota, stabilizing selection
Introduction
A central problem in evolutionary biology is evaluating the role of fluctuating selection—regular reversals in directional selection that occur across different time periods—in maintaining the evolutionary stasis seen in most populations (Bell 2010). While patterns of oscillating selection have been well demonstrated in some taxa (e.g., Price et al., 1984; Hairston and Dillon, 1990; Losos et al., 2006; Carlson et al., 2007), much of the evidence for widespread fluctuating selection (Siepielski et al., 2009; Bell 2010) is equally consistent with relatively stable directional selection obscured by sampling variance (Kingsolver & Diamond, 2011; Morrissey & Hadfield, 2012). Thus, what prevents continued directional change in many traits believed to be under selection remains unclear in most cases (Merilä et al., 2001; Estes & Arnold, 2007).
Changing climatic conditions have been suggested as a likely cause of potential fluctuating selection in general, and the relatively few studies that have investigated drivers of temporal selection dynamics have identified climate as likely being involved to various degrees (Siepielski et al., 2009). Normal climatic variation can indirectly affect food supply or predation that in turn influences both fecundity and viability in sometimes opposing ways (Price et al., 1984; Grant & Grant, 1989, 1993, 2002; Hairston & Walton, 1986; McAdam & Boutin, 2003; Carroll et al., 2007). In other cases, climatic extremes may directly affect organisms’ survival (Bumpus, 1899; Brown & Brown, 1998; McKechnie & Wolf, 2010) and serve as catalysts for evolutionary change through intense episodic viability selection (Grant & Grant 2002). With global climate change, both the magnitude of climatic variation and the frequency of extreme events are predicted to increase (Easterling et al., 2000; Greenough et al., 2001; Rosenzweig et al., 2001), and thus understanding the effect of climate as a driver of selection becomes especially important.
Small insectivorous birds are known to be particularly sensitive to variation in climate and thus are good candidates to investigate the dynamics of climatically driven selection. Variation in temperature and moisture affects insect populations that in turn determine survival and fecundity of birds that feed on these insects (Szep, 1995; Cowley & Siriwardena, 2005; Stokke et al., 2005; Robinson et al., 2008). Fluctuating selection driven in part by climate-related changes in food supply occurred in insectivorous bank swallows (Riparia riparia), in which directional shifts in body morphology varied in sign at different times (Bryant and Jones, 1995). In addition, unusually cold and wet weather can lead to extensive mortality in insectivorous birds (Anderson, 1965; Löhrl, 1971; Littrell, 1992), and these events can exert strong episodic viability selection on morphology (Bumpus, 1899; Brown & Brown, 1998, 1999c).
Our objective in this study is to examine patterns of viability selection on morphology of cliff swallows (Petrochelidon pyrrhonota) and identify whether any directional selection on morphological traits has fluctuated in response to climatic variation. Our work was motivated by the documenting of strong episodic directional selection on morphology of cliff swallows during a rare climatic event in 1996 (Brown & Brown 1998) and our interest in knowing whether the directional selection occurring then has been reversed, potentially by climatic variation, in years subsequent to this event. A 6-day period of unusually cold and wet weather in late May reduced these birds’ food supply to the extent that thousands of individuals starved to death (Brown & Brown, 1998). A comparison of morphological measurements of the birds that died with those that survived revealed strong directional selection on tarsus length, wing length, bill length, and bill width; in addition, birds that had arrived earlier in the spring were selected against (Brown & Brown, 1998, 2000). Comparison of historical weather records showed that only two such climatic events have occurred since record-keeping began 135 years ago (Brown & Brown, 1998).
This study uses a dataset of over 26,000 individual cliff swallows from 10 yearly cohorts that were measured, banded, and subsequently recaptured repeatedly during the 14 years following the climatic event. We employ mark-recapture statistical methodology to estimate apparent survival and study viability selection. Specifically, we investigate whether the directional selection observed during the climatic event has continued and whether the form or magnitude of selection has fluctuated with varying climatic conditions over the subsequent decade and a half.
Methods
Study Site
We have studied cliff swallows since 1982 near the Cedar Point Biological Station (41°13′ N, 101°39′ W) in Keith County, southwestern Nebraska, along the North and South Platte rivers; the study area also includes portions of Deuel, Garden, and Lincoln counties. Cliff swallows construct gourd-shaped mud nests, often in dense, synchronously breeding colonies. In our study area the birds nest mostly on the sides of bridges, in box-shaped road culverts, or underneath overhangs on the sides of cliffs. The study area contains about 220 colony sites, with about a third not used in a given year. Colony size varies widely; in our study area it ranges from 2 to 6000 nests (mean ± SE, 404 ± 13, n = 2318 colonies), with some birds nesting solitarily. The study site is described in detail by Brown & Brown (1996). Cliff swallows spend the winter in southern South America (Brown & Brown, 1995), although the wintering range of our specific population is unknown.
Morphological Measurements
Beginning in 1997 (the year following the climatic event) and continuing through 2006, birds were systematically measured during the course of a long-term mark-recapture project (Brown & Brown, 2004, 2009: Brown et al., 2007, 2008a,b). All morphological measurements were taken by one person only (MBB), who also measured all birds in the 1996 weather event (Brown & Brown, 1998). For all individuals, the length of each un-flattened, closed wing (from the anterior most part of the wrist joint to the tip of the outermost primary) was measured to the nearest 1 mm with a stoppered wing ruler; the length of the middle tail feather (from its emergence from the skin to the distal most point) was measured to the nearest 1 mm with a ruler; the length of each tarsus (from the proximate end of the tarso-metatarsus to the hallux) was measured to the nearest 0.1 mm with calipers; and the length and width of the exposed bill (length from the proximate end of the exposed culmen to the tip along the upper mandible and width of the exposed mandibles at the nostrils) was measured to the nearest 0.1 mm with calipers. Right and left wing lengths, and right and left tarsus lengths, were averaged for each bird on each measurement occasion. Repeatabilities of morphological measurements by this measurer (MBB) are given in Brown & Brown (1998) and, in general, were high and statistically significant.
The same birds were often measured on multiple occasions within a year and in different years. Morphological measurements for each trait of an individual were averaged over the occasions on which the bird was captured and measured, and a single value for each trait was used per individual. A total of 26,320 individuals were included in this analysis with annual cohorts (birds first measured that year) of 1289, 1759, 2346, 2519, 2319, 2447, 3621, 4233, 3042, and 2745 in the years 1997–2006, respectively.
Mark-Recapture
Cliff swallows were mist-netted at 27–40 colonies each year of the study. No birds were measured after 2006 but all of those measured from 1997–2006 were followed by recapture through 2010. Most of those measured had completed their lifespan by 2010; of the total birds measured, only 266 (1.0%) were recaptured in 2010. Recaptures from throughout the study area, including at colony sites where birds were not measured, were used in estimating survival, because cliff swallows often move to different colony sites between years. Mist nets were erected across the entrances to culverts or along the sides of bridges; at some sites, we dropped nets from the top of the bridge, catching residents when they flushed from their nests. Netting is described more fully in Brown & Brown (1996, 2004), Brown (1998), and Roche et al. (2013). The number of days on which we mist-netted birds at a colony site in a given year varied from 1–37, depending on the ease of netting there, the colony size, colony phenology, or other considerations. All birds caught were banded with a USGS numbered aluminum leg band (upon first capture) and sexed by the presence of a cloacal protuberance and/or brood patch (Brown & Brown, 1996).
Estimating Survival
We made the explicit assumption that annual survival is a reliable surrogate for fitness. This seemed justified for small passerines such as cliff swallows, given that various studies have shown that annual survival is the best single predictor of lifetime reproductive success for birds with lifespans typical of swallows (Clutton-Brock, 1988; Newton, 1989). As in any mark-recapture study of an open population (Lebreton et al., 1992), our survival analyses measured local apparent survival only; permanent emigration from the study area was confounded with mortality. We make the assumption here that the morphological traits measured did not influence permanent emigration in ways that would lead to biased survival estimates for individuals from different parts of a trait’s distribution.
Survival analyses were performed with the 14 years of cliff swallow mark-recapture data (1997–2010) using a Cormack-Jolly-Seber recaptures-only model in program RMark (White & Burnham, 1999; Laake et al., 2012). We treated each year as an occasion, for a total of 14 occasions with equal intervals; we represented cliff swallow sex with two groups (n = 14,606 males, n = 11,714 females). Our fully parameterized global model consisted of 366 parameters and was structured such that there was a unique parameter for each sex (2 sexes) by age (13 ages) by year (13 years) for apparent survival (ϕ) and detection probability (p) We used this model and the median ĉ test to calculate the over-dispersion parameter (ĉ) for these data (ĉ = 1.19) and adjusted the Akaike information criterion values (AICc), yielding quasi-AICc values corrected for over-dispersion (QAICc).
We first fit simplified models for detection probability while keeping apparent survival fully parameterized. These models included parameterizations where detection probability (1) was constant across all years, (2) was constant across years and varied by sex, (3) varied by year, (4) followed a log-linear function of age, and (5) varied according to an additive parameterization of year with a log-linear function of age. In this analysis, “age” was a relative measure of cliff swallow age, as it represents the number of years that elapsed since a cliff swallow had first entered the capture history (i.e., was initially measured). These sorts of relative measures of age are reliable indicators of actual age (Roche et al. 2013). We compared these models to the global model and used the parameterization of detection probability associated with the lowest QAICc to build models with simplified parameterizations of apparent survival. The simplified models for survival included ones where apparent survival (1) was constant across years, (2) was constant across years and varied by sex, (3) varied by year, (4) varied by year and sex, (5) varied by a log-linear function of age, and (6) varied according to an additive parameterization of year with a log-linear function of age. We compared these models via QAICc and used the best-ranked model to test the relationship of apparent survival to each morphological trait.
We built models for wing length (wing), middle-tail feather length (midtail), tarsus length (tarsus), bill length (billlength), and bill width (billwidth) to test the relationship of these covariates to annual apparent survival. We standardized all covariates to a mean of zero and standard deviation of 1 for all analyses. To infer the potential effect of a morphological trait, we added the morphological trait of interest to a model composed of our top-ranked models for detection (Table 1, model 1) and apparent survival (Table 2, model 34). We built covariate models in which apparent survival followed a linear function, two sex-specific linear functions, a quadratic function, and two sex-specific quadratic functions of each covariate. We considered the model with the lowest QAICc as best representing the relationship of that morphological measurement to apparent survival.
Table 1.
Set of Cormack-Jolly-Seber recaptures-only models for parameterizations of detection probability for cliff swallows in southwestern Nebraska, USA, 1997–2010. For all models, apparent survival was parameterized as ϕ(age*sex*year).
| Model: p* | ΔQAICc | wi | k | QDev. | |
|---|---|---|---|---|---|
| (1) | age + year (QAICc = 90943.32) | 0.00 | 0.58 | 197 | 2779.89 |
| (2) | age + year + sex | 0.65 | 0.42 | 198 | 2778.52 |
| (3) | age | 85.69 | 0.00 | 185 | 2889.77 |
| (4) | age*year*sex | 147.01 | 0.00 | 366 | 2584.97 |
| (5) | sex | 298.43 | 0.00 | 185 | 3102.52 |
| (6) | . | 298.57 | 0.00 | 184 | 3104.67 |
Parameters with interactions are joined by ‘*’; those having parallel (additive) relationships are joined by ‘+’; the designation ‘.’ represents a time-constant model; Akaike’s Information Criterion (AIC) values were corrected for over-dispersion, yielding quasi-AIC (QAICc) values (ĉ = 1.19). ΔQAICc values (the difference between the top-ranked model and all other models in the table) and model weights (wi) were used to rank models.
Table 2.
Set of Cormack-Jolly-Seber recaptures-only models used to explore the relationship between apparent survival (ϕ) and morphological traits for cliff swallows banded in southwestern Nebraska, USA, 1997–2010. See text for covariate abbreviations. Model structure refers to that for apparent survival.
| Model: ϕ * | ΔQAICc† | wi† | k | QDev.† | |
|---|---|---|---|---|---|
| All traits | |||||
| (1) | year + sex + wing + midtail + billlength + billwidth + tarsus + tarsus2 + wing*billwidth + midtail*billwidth + billlength*billwidth + billwidth*tarsus + billlength*PDSI + billwidth*PDSI + tarsus*PDSI + tarsus2*PDSI (QAICc = 90025.41) | 0.00 | 1.00 | 43 | 89939.33 |
| (2) | year + sex + wing + midtail + billlength + billwidth + tarsus + tarsus2 + wing*billwidth + midtail*billwidth + billlength*billwidth + billwidth*tarsus | 323.44 | 0.00 | 39 | 90268.95 |
| Wing length | |||||
| (3) | year + sex + wing (QAICc = 90852.99) | 0.00 | 0.43 | 29 | 90794.96 |
| (4) | year + sex + wing + wing2 | 1.72 | 0.18 | 30 | 90794.68 |
| (5) | year + sex + sex*wing | 1.74 | 0.18 | 30 | 90794.70 |
| (6) | year + sex + wing + wing*PDSI | 1.98 | 0.16 | 30 | 90794.96 |
| (7) | year + sex + sex*wing + sex*wing2 | 4.07 | 0.05 | 32 | 90793.02 |
| (8) | year + sex | 19.27 | 0.00 | 28 | 3048.41 |
| Middle-tail length | |||||
| (9) | year + sex + midtail (QAICc = 90787.60) | 0.00 | 0.38 | 29 | 90729.56 |
| (10) | year + sex + midtail + sex*midtail | 0.99 | 0.23 | 30 | 90728.56 |
| (11) | year + sex + midtail + midtail*PDSI | 1.16 | 0.22 | 30 | 90728.77 |
| (12) | year + sex + midtail + midtail2 | 2.04 | 0.14 | 30 | 90729.60 |
| (13) | year + sex + sex*midtail + sex*midtail2 | 5.07 | 0.03 | 32 | 90728.63 |
| (14) | year + sex | 84.67 | 0.00 | 28 | 3048.41 |
| Tarsus length | |||||
| (15) | year + sex + tarsus + tarsus2 + tarsus*PDSI + tarsus2*PDSI (QAICc = 90676.09) | 0.00 | 1.00 | 32 | 90612.03 |
| (16) | year + sex + tarsus + tarsus2 | 41.94 | 0.00 | 30 | 90657.98 |
| (17) | year + sex + sex*tarsus + sex*tarsus2 | 43.86 | 0.00 | 32 | 90655.89 |
| (18) | year + sex + sex*tarsus | 190.81 | 0.00 | 30 | 90806.84 |
| (19) | year + sex + tarsus | 195.94 | 0.00 | 29 | 90813.98 |
| (20) | year + sex | 196.20 | 0.00 | 28 | 3048.41 |
| Bill length | |||||
| (21) | year + sex + billlength + billlength*PDSI (QAICc = 90445.01) | 0.00 | 1.00 | 30 | 90384.97 |
| (22) | year + sex + billlength | 208.55 | 0.00 | 29 | 90595.53 |
| (23) | year + sex + sex*billlength | 208.76 | 0.00 | 30 | 90593.74 |
| (24) | year + sex + billlength + billlength2 | 210.54 | 0.00 | 30 | 90595.52 |
| (25) | year + sex + sex*billlength + sex*billlength2 | 212.78 | 0.00 | 32 | 90593.75 |
| (26) | year + sex | 427.26 | 0.00 | 28 | 3048.41 |
| Bill width | |||||
| (27) | year + sex + billwidth + billwidth*PDSI (QAICc = 90772.90) | 0.00 | 0.87 | 30 | 90712.86 |
| (28) | year + sex + billwidth | 5.42 | 0.06 | 29 | 90720.28 |
| (29) | year + sex + sex*billwidth | 6.12 | 0.04 | 30 | 90718.98 |
| (30) | year + sex + billwidth + billwidth2 | 7.48 | 0.02 | 30 | 90720.34 |
| (31) | year + sex + sex*billwidth + sex*billwidth2 | 10.11 | 0.01 | 32 | 90718.97 |
| (32) | year + sex | 99.37 | 0.00 | 28 | 3048.41 |
| (33) | . | 260.68 | 0.00 | 15 | 3335.11 |
| Basic survival‡ | |||||
| (34) | year + sex (QAICc = 90872.27) | 0.00 | 1.00 | 28 | 3048.41 |
| (35) | year | 25.77 | 0.00 | 27 | 3076.18 |
| (36) | year + age | 27.74 | 0.00 | 28 | 3076.15 |
| (37) | age*year*sex | 71.05 | 0.00 | 197 | 2779.89 |
| (38) | sex | 232.75 | 0.00 | 16 | 3305.19 |
| (39) | age | 255.32 | 0.00 | 16 | 3327.76 |
| (40) | . | 260.68 | 0.00 | 15 | 3335.11 |
Parameters with interactions are joined by ‘*’; those having parallel (additive) relationships are joined by ‘+’; the designation ‘.’ represents a time-constant model; Akaike’s Information Criterion (AIC) values were corrected for over-dispersion, yielding quasi-AIC (QAICc) values. ΔQAICc values (the difference between the top-ranked model and all other models in a sub-group) and model weights (wi) were used to rank models. For all models other than the fully-parameterized global model [ϕ(age*sex*year)], p(age + year). detection probability was parameterized as
ΔQAICc, wi, and QDev are presented relative to the top model in each sub-group.
Used to determine best survival parameterization for models with covariates.
Estimating Selection Gradients and Differentials
To estimate selection gradients across all years, we built a model with a parameterization for survival in which all potential interactions of morphological measurements were included ϕ(year + sex + wing + wing2 + midtail + midtail2 + billlength + billlength2 + billwidth + billwidth2 + tarsus + tarsus2 + wing*midtail + wing*billlength + wing*billwidth + wing*tarsus + midtail*billlength + midtail*billwidth + midtail*tarsus + billlength*billwidth + billength*tarsus + billwidth*tarsus), p(age + year)]. However, this model was over-fit, and we used a process of backward model selection to eliminate the unsupported covariates. We began by removing each quadratic term one by one and comparing the resulting models (via QAICc) with the original, fully crossed model. If the QAICc values resulting from the removal of a quadratic term were lower than the fully crossed model, we interpreted this as evidence that the quadratic term did not explain significant variation and should be permanently eliminated from our parameterization of survival. We created a new model in which only the quadratic terms supported by QAICc were included and repeated the same process for the correlational covariates (i. e., covariate1*covariate2). From this we created our finalized selection gradient model by including only the linear, quadratic, and correlational (and associated linear) terms supported by QAICc. Each of the partial regression coefficients included in the top model were interpreted as selection gradients, a measure of the intensity of selection on a trait of interest while simultaneously controlling for the effect of other traits (Lande & Arnold, 1983). To obtain non-linear selection gradients, we doubled the estimates of quadratic coefficients and their standard errors (Stinchcombe et al 2008).
We used an information theoretic approach to ensure that the models whose results we report were fully supported. Thus, we do not present selection coefficients derived from any model if that model was not supported by QAICc ranking. When such a model is not supported, the appropriate inference is that the additional covariate terms do not detectably influence survival and thus are equivalent to being “not significant” in the classical frequentist paradigm (Burham & Anderson, 2002). We did not calculate separate gradients by year, because to do so for a regression model of this size (model 2, Table 2) would have increased the number of starting parameters by approximately 130 and, despite our relatively large sample sizes, would have led to a grossly over-fit model.
Linear (i.e., directional) and non-linear selection differentials were derived from regression coefficients using the top individual covariate model that included supported linear and quadratic terms for each trait (e.g., for wing, model 3, Table 2). We calculated differentials both for the entire dataset and for each year separately. For the yearly calculations, we used the top individual covariate model with a year*trait interaction termed added (these models not shown or ranked in Table 2). Only tarsus had a non-linear term supported in the top individual model (model 15, Table 2), and thus a non-linear differential was calculated only for that trait. Because yearly climatic variables (see below) co-varied with year, we removed any climatic variables from the top individual covariate model for calculating a year*trait interaction.
Estimating Effects of Annual Climate
Summer weather conditions in southwestern Nebraska are highly variable; a season that is hot and dry can immediately follow a wet and cold one (Brown & Brown, 1996). Cliff swallows are most affected by temperature and rainfall, with cold and wet conditions reducing the birds’ food supply to a level that can impair adult and nestling survival and delay egg-laying, and hot and dry weather leading to explosive population growth of hematophagous ectoparasites that also reduce nesting success (Brown & Brown, 1996, 1999a,b). In assessing whether the relationship between a morphological trait and survival varied depending on climate in given year, we used the U.S. Palmer Drought Severity Index (PDSI) to describe annual climatic conditions. The PDSI is a measure of dryness used by the National Oceanic and Atmospheric Administration (NOAA), and it integrates both local temperature and rainfall data (and other variables) into a single index (e.g., Palmer, 1965; Dai et al., 2004). We used PDSI values calculated by NOAA for Climate Division 7 of Nebraska (corresponding to southwestern Nebraska), averaged for the months of May to July each year, 1997–2010 (available at http://www.ncdc.noaa.gov/temp-and-precip/time-series/). We used a single measure for these three months as that was the inclusive time period that most cliff swallows were present in our study area. PDSI indices varied from −3.87 (very warm and dry, in 2006) to 7.46 (very cold and wet, in 2010) with 7 years exhibiting a negative PDSI and 7 years a positive PDSI. We make the assumption that climatic conditions in year t, as measured by the PDSI, may affect survival as measured to year t + 1.
Each yearly PDSI represented an annual covariate that was added as an interaction term with the morphological trait to the top model in each individual analysis. We standardized all annual PDSI measurements to a mean of zero and standard deviation of 1. Relative to models without PDSI as a covariate, we interpreted a drop in QAICc as evidence that annual weather conditions influence the magnitude and direction of a morphological trait’s association with annual survival. To control for the influence of all morphological measurements when interpreting the effect of PDSI, we built a final model with all supported covariates that also included all morphological traits-by-PDSI interactions that were supported in the individual analyses and used this to interpret the overall influence of PDSI on morphology-related survival.
Results
In agreement with previous analyses of this population, the probability of detecting a cliff swallow (effective sample size = 48899) decreased with swallow age following a log-linear relationship (βp−Age = −0.09; 95% CI, −0.11 to −0.07) and was variable depending on the year (Table 1, model 1). The mean probability of annual detection was 0.50 (95% CI, 0.48 to 0.52) for birds after one year (i.e., year first measured), 0.46 (95% CI, 0.44 to 0.48) for birds after three years, and 0.41 (95% CI, 0.38 to 0.44) for birds after five years. Annual apparent survival of cliff swallows was also variable by year, but on average, male survival (0.69; 95% CI, 0.62 to 0.75) was slightly higher than that for females (0.67; 95% CI, 0.61 to 0.74; βϕ−Male = 0.06; 95% CI, 0.02 to 0.09; Table 2, model 34).
Overall Patterns of Selection
Annual apparent survival was related to all morphological traits both when these traits were added to models of apparent survival individually and in a combined analysis (Table 2). In general, skeletally larger cliff swallows experienced the highest annual apparent survival rates. Across all years, annual survival of cliff swallows varied little with wing length (Fig. 1a) and increased slightly with increasing mid-tail length (Fig. 1b). Survival varied with tarsus length following a quadratic relationship (Fig. 2a), and increased with increasing bill length (Fig. 2b) and with increasing bill width (Fig. 2c). All five traits exhibited approximately normal distributions when the proportions of birds with each measurement value were plotted (Figs. 1, 2), although some distributions (bill width, tarsus length) were more leptokurtic, and one (bill length) exhibited platykurtosis. All patterns were the same for males and females, although because trait means tended to differ by sex, an additive effect of sex was supported in all top models. In all survival curves and calculations, we present average values and 95% confidence intervals calculated for both sexes and across all years.
Fig. 1.
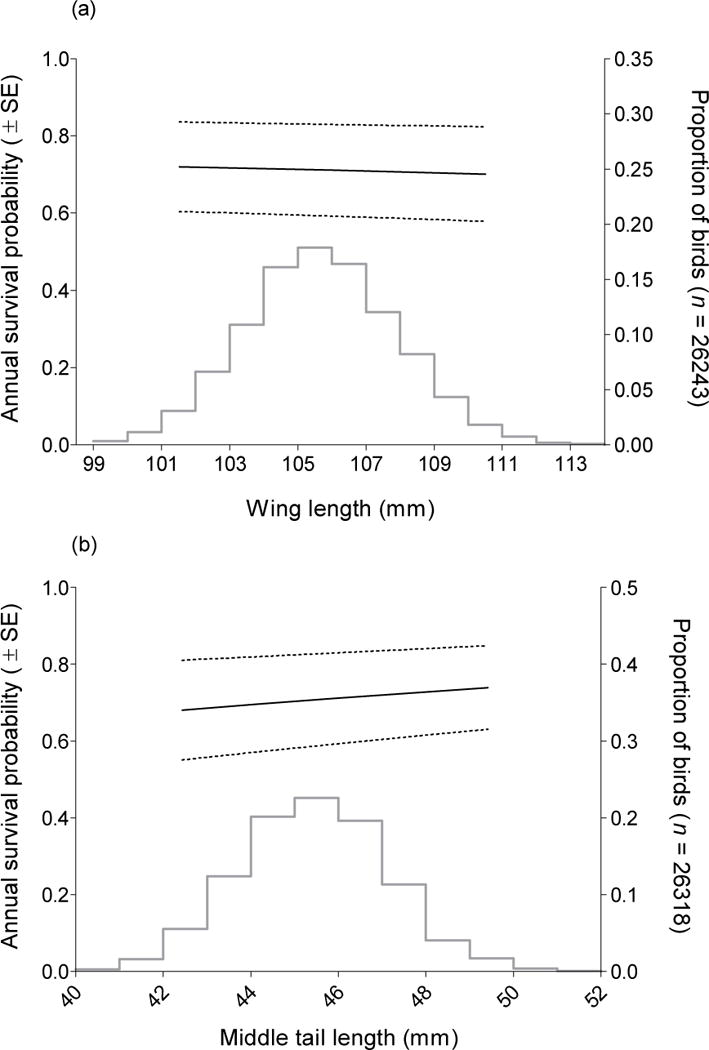
Annual apparent survival in relation to (a) wing length and (b) middle-tail length for cliff swallows marked and recaptured in southwestern Nebraska, 1997–2010. Survival estimates are from model 2 (Table 2). Dashed lines represent 95% confidence intervals calculated with the delta method using all sex-specific annual estimates from model 2 (Table 2). Histogram represents the proportional distribution of measurements across all birds in the sample. When projecting annual survival estimates for a particular trait size, all other covariates were held at their mean value. Differences in sample sizes reflect individuals that had missing values for some traits.
Fig. 2.
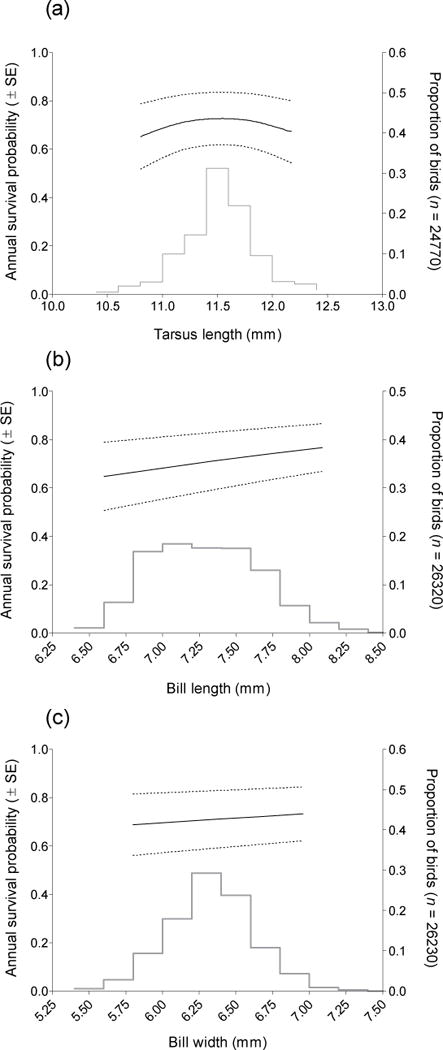
Annual apparent survival in relation to (a) tarsus length, (b) bill length, and (c) bill width for cliff swallows marked and recaptured in southwestern Nebraska, 1997–2010. Survival estimates are from model 2 (Table 2). Dashed lines represent 95% confidence intervals calculated with the delta method using all sex-specific annual estimates from model 2 (Table 2). Histogram represents the proportional distribution of measurements across all birds in the sample. When projecting annual survival estimates for a particular trait size, all other covariates were held at their mean value. Differences in sample sizes reflect individuals that had missing values for some traits.
Calculated across all years, linear (directional) selection differentials were significant for all morphological traits and in all cases were positive (Table 3). Non-linear selection differentials, however, were significant only for tarsus length, again consistent with the observed survival curve (Table 3, Fig. 2a). When taking into account the effect of other morphological traits, all traits except wing length were independently targets of linear (directional) selection, as indicated by these traits’ significance in the across-years selection gradient (Table 3). Tarsus length was the only significant target of non-linear (stabilizing) selection once accounting for the simultaneous effects of other morphological traits (Table 3).
Table 3.
Across-years selection differentials and selection gradients (± 1 SE) of morphological traits on annual apparent survival for cliff swallows in southwestern Nebraska, U.S.A., across all years, 1997–2010. Selection differentials are taken from regression coefficients for each trait from its top-supported individual covariate model that did not include climate (PDSI; Table 2). The selection gradients are the regression coefficients of the top-supported model using all morphological traits (Table 2, model 2). Significant values (p < 0.05) are bolded. Blank entries are for terms not supported in the top models and thus considered non-significant.
| Trait | Selection differential (± SE)
|
Selection gradient (± SE)
|
Correlational selection coefficient (± SE)
|
||||
|---|---|---|---|---|---|---|---|
| Directional | Nonlinear | Directional | Nonlinear | *tarsus | *bill length | *bill width | |
| wing length | 0.047 ± 0.010 | −0.015 ± 0.012 | |||||
| tail length | 0.094 ± 0.010 | 0.085 ± 0.012 | 0.015 ± 0.012 | ||||
| tarsus length | 0.024 ± 0.010 | −0.157 ± 0.012 | −0.022 ± 0.010 | −0.176 ± 0.012 | 0.073 ± 0.011 | −0.018 ± 0.011 | |
| bill length | 0.161 ± 0.011 | 0.149 ± 0.012 | 0.022 ± 0.011 | ||||
| bill width | 0.105 ± 0.011 | 0.067 ± 0.011 | |||||
While several correlational selection coefficients were included in the top-supported gradient model across all years, only two did not overlap zero (Table 3; Fig. 3). Survival was lowest for birds with long tarsi and short bills, while those with short bills and short tarsi were comparatively less disadvantaged. Birds with the shortest tarsi realized essentially no improvement in survival as bill length increased (Fig. 3a). In contrast, birds with the longest tarsi exhibited a 48% increase in annual survival probability (from 0.512 to 0.757) between those with the shortest versus longest bills (Fig. 3a). Birds with intermediate tarsus lengths, which appeared to have highest survival in the univariate analysis (Fig. 2a), showed a 17% increase in annual survival probability between those with the shortest versus longest bills (Fig. 3a). Bill length and bill width also exhibited correlational selection (Table 3). As might be expected from the univariate analyses (Fig. 2b, c), those with the longest and widest bills had the highest survival, but short-billed birds realized comparatively little gain as bill widths went from smallest to largest (a 3% increase in annual survival probability), while long-billed birds showed a greater improvement in annual survival (a 10.5% increase) as bill widths went from smallest to largest (Fig. 3b). The correlational selection depicted (Fig. 3) was that for the observed data space of the population, as shown by comparison of actual trait values corresponding with the standardized traits (Fig. 3) to the cuumulative distribution of trait values in the population (Figs. 1, 2).
Fig. 3.
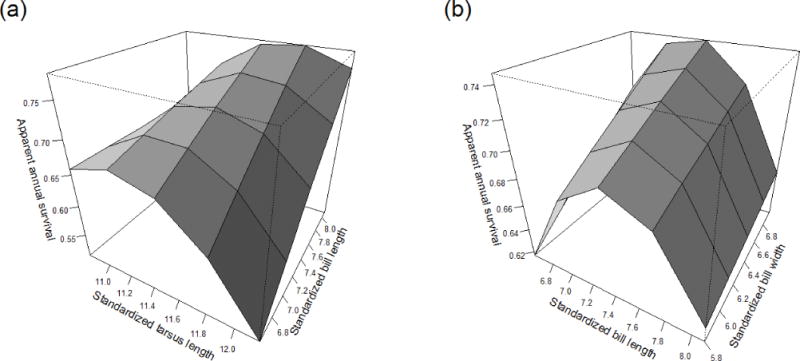
Correlational plot of annual apparent survival in relation to standardized measures of (a) tarsus length and bill length and (b) bill length and bill width for cliff swallows marked and recaptured in southwestern Nebraska, 1997–2010. Measurements were standardized by subtracting the mean from each and dividing by the standard deviation, with, for example, a standardized measure of −1 being an individual bird with a measurement one standard deviation below the mean. The actual trait values that correspond to standardized values of −2, −1, 0, 1, and 2 are depicted on the axes. When projecting annual survival estimates for a particular trait size, all other covariates were held at their mean value, and all survival estimates were generated from model 2 (Table 2).
Annual Fluctuation in Selection
Yearly selection differentials exhibited variation among years (Fig. 4). Wing length showed the least annual variation and the least evidence for selection, with the linear differential for only one year being significant (as determined by the 95% CI not overlapping zero; Fig. 4a). Middle-tail length, tarsus length, and bill length all showed significant linear differentials that were either positive or negative in different years (Fig. 4). Only bill width did not have at least one significant linear differential of each sign (Fig. 4f). The non-linear selection differentials for tarsus length exhibited both significantly positive and negative values in different years (Fig. 4d). In general, the differentials for the later years of the study (2006 on) were less likely to be significant and exhibited greater sampling variance (Fig. 4), likely because new cohorts of measured birds did not enter the dataset after 2006 and patterns for the later years were based on a declining number of surviving birds. Differentials were not shown for 2009, because of the confounding of survival and recapture parameters in the final year (2010) of the study.
Fig. 4.
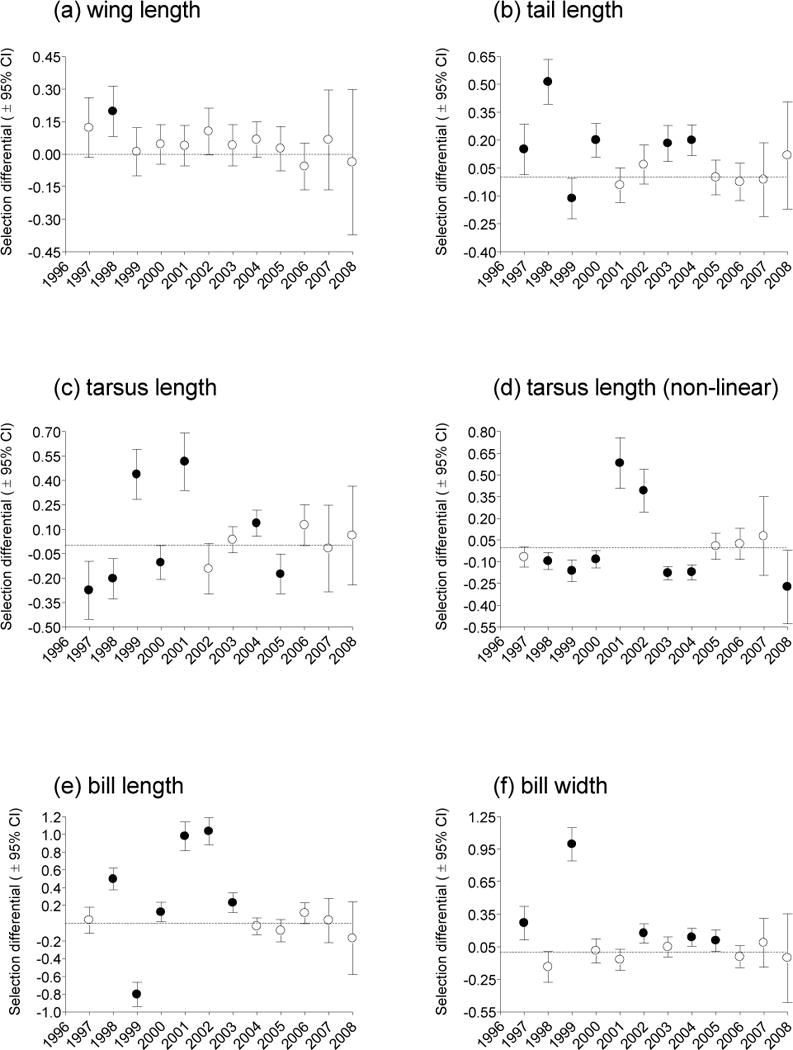
Selection differentials by year for cliff swallow morphological traits. All those shown are linear differentials except for (d) that depicts the non-linear selection differential for tarsus. Differentials were generated from the top-supported individual covariate model for each trait, as described in Methods. Differentials are shown with 95% CI; those considered significant (P < 0.05) by not overlapping zero (dashed line) are shown by closed circles, those non-significant by open circles. To facilitate future meta-analyses, the actual values used to construct this figure are given in Table S1 (Supplementary Online Material).
Selection in Relation to Climate
We found support for an interaction between PDSI and the three skeletal traits in their effects on survival (tarsus length, bill length, and bill width; Table 2, models 15, 21, 27), and when the PDSI interactions were added to the top-supported model (Table 2, model 1 vs model 2), QAICc dropped by an additional 323.44. The magnitude of the quadratic relationship between tarsus length and apparent survival was most pronounced in wet years and almost negligible in drought years (Fig. 5a; examples of wet, dry, and average years are plotted for comparison; βlinear = 0.06, 95% CI, 0.00 to 0.12; βnon-linear = − 0.10, 95% CI, 0.06 to 0.14). In wet years increasing bill length was associated with decreasing apparent survival, while in drought years increased bill length was related to increased annual survival (Fig. 5b; = β = − 0.72, 95% CI, − 0.82 to − 0.62). Increasing bill width was associated with increased survival during wet years but decreased annual survival during drought years (Fig. 5c; β = 0.31, 95% CI, 0.23 to 0.39). In each case, there was a much weaker relationship between bill morphology and annual survival in climatically normal years (Fig. 5b, c).
Fig. 5.
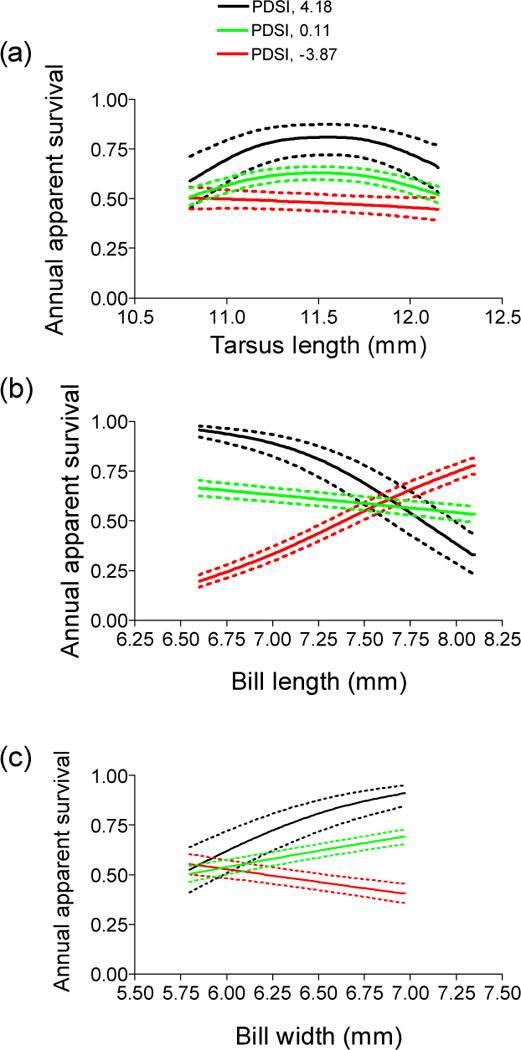
Annual apparent survival in relation to (a) tarsus length, (b) bill length, and (c) bill width for cliff swallows marked and recaptured in southwestern Nebraska under variable annual weather conditions as measured by the Palmer Drought Severity Index (PDSI). A representative wet year (2007) had a PDSI of 4.18, a normal year (2005), 0.11, and a dry year (2006), −3.87. Survival estimates are from model 1 (Table 2). When projecting annual survival estimates for a particular trait size, all other covariates were held at their mean value. Dashed lines represent 95% confidence intervals calculated with the delta method using all sex-specific estimates from model 1 (Table 2).
Discussion
The most striking result of this study is that cliff swallow annual survival varied with skeletal traits (tarsus, bill) in different ways in different years depending on climatic factors (drought conditions experienced on the breeding grounds), while feather traits (wing, tail length) showed either no or a weak relationship with annual survival regardless of climatic conditions. Despite the fact that viability selection on some traits fluctuated in different directions in some years, bill dimensions and tail length generally showed a net positive directional selection overall. Only one trait (tarsus length) seemed to be subject to stabilizing selection across years. All patterns detected here were the same for both sexes, even though trait means tended to differ slightly between males and females (see Brown & Brown, 2011).
Annual Climatic Effects on Morphology-Based Selection
Climatic events such as the unusual weather experienced in 1996 clearly can have major effects on cliff swallow morphology (Brown & Brown, 1998) and behavior (Brown & Brown, 2000). However, the analyses here reveal that annual variation in summer climate exclusive of catastrophic mortality events also may affect the pattern of natural selection on morphological traits and in some cases lead to fluctuating selection. We used the annual PDSI as an integrative measure of precipitation and temperature during the breeding season to model how yearly weather conditions may have affected morphology-associated survival. Summer temperature and rainfall exhibit extensive variation across years in our study area (Brown & Brown, 1996) and influence key parameters associated with cliff swallow fitness: time of nesting, ectoparasite load, food supply, and eventual nesting success (Brown & Brown, 1999a, b).
Summer climate had a clear effect on survival associated with all three skeletal 351 traits in this study and in unexpected ways. The curvilinear survival function associated with tarsus held in wet years but was weaker in more normal years and virtually vanished in dry years. Bill length and width showed essentially opposite patterns, with survival of long- and narrow-billed birds declining in wet years and that of short- and wide-billed birds increasing in dry years. The survival differences both between years and for birds of different morphology within years were in many cases quite extreme and greater than all of the average values estimated for the dataset as a whole. Scenarios to explain these patterns are all highly speculative, especially in the absence of data on how flying insect availability varies with seasonal climatic conditions, but the overall conclusion is that morphology-based survival is widely variable from year to year. The representative years depicted in Figure 5 occurred successively (2005–2007), illustrating dramatic change from year to year in the fitness function associated with these traits. The variation in annual selection differentials (Fig. 4) is also consistent with frequent reversals in the pattern of selection between years.
We do not know why selection favored bill length and bill width in opposite patterns in wet versus dry years. The negative directional selection on bill length in wet and cool years was not what was observed during the severe climatic event of 1996: in that intense selection episode, birds with longer bills survived better. Perhaps the difference is that in unusually severe short-term storms, bill length is simply an index of body size, and bigger birds are favored because they can store more fat to get through a few days of food scarcity (Brown & Brown, 1998). In contrast, when the entire summer is subject to cool and wet conditions, perhaps annual changes in insect availability favor shorter bills (and the reverse holds in dry summers). The annual differences that suggest fluctuating selection based on climate are consistent with the results on Darwin’s finches in which selection was reversed between climatically different years (Grant & Grant, 1989, 1993, 1995, 2002). This sort of fluctuating selection may slow the long-term directional trajectories of these traits, and is the basis for the view that evolutionary stasis can be maintained by opposing patterns of selection (Siepielski et al., 2009; Bell, 2010).
Temperature and rainfall have been shown to have effects on annual survival in other species of swallows (Szep, 1995; Cowley & Siriwardena, 2005; Stokke et al., 2005; Robinson et al., 2008). Generally, this seems to result from changes in insect availability brought on by climatic conditions on either the breeding or wintering grounds that directly influence food resources and thus whether birds can find enough food to survive. These results from other species are thus consistent with ours in showing strong annual differences in survival for aerial insectivores. Only rarely, however, has varying climate-dependent survival been related to morphological traits. In bank swallows, body size (as measured by keel length) fluctuated over time, with smaller birds favored during years with extreme drought conditions in the winter (Bryant & Jones, 1995). During more normal years, larger body size was selected for, such that over time body size remained relatively stable. The bank swallow results (Bryant & Jones, 1995) thus support the hypothesis that climatically driven selection can fluctuate in direction between years (sometimes episodically) but maintains evolutionary stasis over the long term.
Net Directional Changes in Morphology
Our analyses indicate that directional change in cliff swallow morphology still appears to be happening despite reversals in selection in some years. This conclusion is strengthened by comparison of trait values, taken each year from yearling birds raised in the study area 1997–2006, which reveal that wing length, bill length, and (to a lesser extent) bill width have increased steadily over time to be significantly greater now than that of the survivors from the 1996 climatic event (Brown & Brown, 2011). Thus, our results support the contention from across studies (Kingsolver & Diamond, 2011; Morrissey & Hadfield, 2012) that, despite occasional reversals, directional selection tends to be relatively consistent in sign over time.
The cause(s) of directional selection on morphology are unclear. One possibility is that we are observing shifts in morphology that reflect relatively recent changes in the insect taxa on which cliff swallows feed in our study area. For example, changes in prey may now favored larger-billed birds. In insectivorous species, jaw force and the consequent speed of mandible movement increases with both increasing bill width and bill length, meaning that larger-billed birds are more efficient at capturing larger and more fast-moving prey (Beecher, 1962; Bock, 1964; Lederer, 1975). Although we lack long-term data on the cliff swallow’s diet in the study area, a relatively recent increase in larger insects could select for larger bill dimensions as we observed. Changes in insect populations are possible in response to recent modifications in land use in southwestern Nebraska, which involve primarily the conversion of grasslands to corn (Zea mays) cultivation. Many different insect taxa are associated with corn (Steffey et al. 1999), and at least some of these have likely increased (and others that occur in grasslands, have decreased) as potential cliff swallow prey in recent years.
Another possibility is that larger bills afford competitive advantages to cliff swallows in their efforts to take over existing nests or settle in the best places early in the spring. These birds fight extensively for old nests and for certain sites within a colony (Brown & Brown, 1996), and gaining access to a nest for shelter from periodic spells of poor weather (Brown & Brown, 2000) could be reflected in annual survival. Increases in cliff swallow population size in the study area that began in the 1980’s (Brown & Brown, unpubl. data) may be favoring larger-billed birds via advantages in competing for nesting sites within colonies.
Some evidence indicated correlational viability selection on combinations of bill length and width. Birds with shorter bills realized comparatively little advantage with increases in bill width, while selection was stronger on bill width among those with longer bills. In the absence of a longer bill, increased width may not improve jaw force or mandible mobility to the extent that it confers an advantage in prey capture. On the other hand, though not necessarily reflected in annual survival, wider bills should increase the ability to transfer parasitic eggs among nests (Brown & Brown, 1988), and if wider-billed birds are more successful brood parasites, we might expect to see wider-billed birds increase in the population (Brown & Brown, 2011). Whatever the advantages of wider gape, apparently these are less for shorter-billed birds.
Non-linear Selection on Tarsus
Across years, we detected evidence for relatively strong stabilizing selection on tarsus length, with the selection differential and selection gradient for tarsus being the only ones where the non-linear component was supported by QAICc. However, only in some years was there evidence for strong stabilizing selection on tarsus; the non-linear selection differential did not differ significantly from zero in some years and was positive in two years (Fig. 4). Selection on tarsus seems to move in opposite directions in different years but seems to stay generally in what Estes and Arnold (2007) term “an adaptive zone with stable boundaries.” The two consecutive years with positive non-linear selection on tarsus (Fig. 4d) may have reflected correlational selection between tarsus and bill length (see below), as the two years with the increased phenotypic variance (2001 (2002) were the same years where positive directional selection on bill length was most intense (Fig. 4e).
Overall, our analyses here show the average tarsus length of the cliff swallow population following the 1996 climatic event, about 11.5 mm, has remained the value where associated survival is the highest and continues to be the most common tarsus size in the population. Trait trajectories based on yearling birds born in the study area have shown virtually no change in the years following the climatic event (Brown & Brown, 2011). Thus, the rapid evolution of longer tarsi for the population, as precipitated by the weather event, has not been reversed in the subsequent years. Our guess is that the tarsus itself is an index of skeletal size and that selection works primarily on total size (e.g., ability to store body mass; Covas et al., 2002); why a given leg length per se should be subject to such strong stabilizing selection in cliff swallows is unclear. In general, overall body size seems to be the life-history trait most often subject to stabilizing selection (Kingsolver & Diamond, 2011).
The significant correlational selection on tarsus length and bill length suggests an asymmetric relationship between these traits in how they affect cliff swallows’ annual survival. The longest-legged birds with short bills fared the worst by far, whereas the shorter-legged birds (that did better than the longest-legged birds) realized little advantage associated with longer bills. Thus, the curvilinear fitness function of tarsus length is skewed toward longer tarsi for birds with longer bills and toward shorter tarsi for birds with shorter bills. If bill length per se continues to be subject to directional selection, we might predict that longer bills will “pull” the optimal tarsus length larger and lead to observed increases in tarsus length in the future. Selection may have worked in this way during the climatic event, although the change in tarsus length was so extreme that any correlational selection with bill length is probably not the only explanation (Price et al., 2000). That tarsus length has not increased since the weather event, despite continued directional selection on bill length, suggests that other factors are also in play. There may be allometric consequences of having mismatched appendage sizes that are worse in one direction (long legs, short bill) than the other (short legs, long bill).
Conclusions
Patterns of morphology-based viability selection in this population of cliff swallows showed annual variation, fluctuating largely in response to climatic conditions. Despite these changes among years, however, overall there was a trend over time for most traits to increase in size. The patterns of selection for some traits were consistent with those documented during the rare climatic event (Brown & Brown, 1998). In no case has any trait moved back toward its mean before the episodic selection event. In particular, the continued directional selection on bill dimensions documented here suggests that cliff swallow morphology in the population may continue to shift and could be exacerbated by global climate change, particularly if the magnitude of annual climatic variation increases. Our study indicates that net directional selection on morphology has occurred despite fluctuating climate-related reversals in some years.
Supplementary Material
Acknowledgments
We thank the 36 research assistants who have helped with field work since 1997 and Amy T. Moore for data entry and management. The R. Clary, D. Dunwoody, D. Knight, and L. Soper families and the Union Pacific Railroad provided access to land, and the School of Biological Sciences at the University of Nebraska-Lincoln allowed us to use the Cedar Point Biological Station. Todd Arnold, Valerie O’Brien, and two anonymous reviewers provided helpful comments on the manuscript. We thank the National Science Foundation (DEB-9613638, IBN-9974733, DEB-0075199, DEB-0514824, DEB-1019423), the National Institutes of Health (AI057569), and the Nebraska Environmental Trust for financial support.
References
- Anderson DW. Spring mortality in insectivorous birds. Loon. 1965;37:134–135. [Google Scholar]
- Beecher WJ. The biomechanics of the bird skull. Bull Chicago Acad Sci. 1962;11:10–51. [Google Scholar]
- Bell G. Fluctuating selection: the perpetual renewal of adaptation in variable environments. Phil Trans R Soc B. 2010;365:87–97. doi: 10.1098/rstb.2009.0150. [DOI] [PMC free article] [PubMed] [Google Scholar]
- Bock WJ. Kinetics of the avian skull. J Morphol. 1964;144:1–42. [Google Scholar]
- Brown CR. Swallow Summer. University of Nebraska Press; Lincoln, NE, USA: 1998. [Google Scholar]
- Brown CR, Brown MB. A new form of reproductive parasitism in cliff swallows. Nature. 1988;331:66–68. [Google Scholar]
- Brown CR, Brown MB. Cliff swallow (Hirundo pyrrhonota) In: Poole A, Gill F, editors. Birds of North America. 149. Academy of Natural Sciences; Philadelphia, PA, USA: American Ornithologists’ Union; Washington, D.C., USA: 1995. [Google Scholar]
- Brown CR, Brown MB. Coloniality in the Cliff Swallow: the Effect of Group Size on Social Behavior. University of Chicago Press; Chicago, IL, USA: 1996. [Google Scholar]
- Brown CR, Brown MB. Intense natural selection on body size and wing and tail asymmetry in cliff swallows during severe weather. Evolution. 1998;52:1461–1475. doi: 10.1111/j.1558-5646.1998.tb02027.x. [DOI] [PubMed] [Google Scholar]
- Brown CR, Brown MB. Fitness components associated with clutch size in cliff swallows. Auk. 1999a;116:467–486. [Google Scholar]
- Brown CR, Brown MB. Fitness components associated with laying date in the cliff swallow. Condor. 1999b;101:230–245. [Google Scholar]
- Brown CR, Brown MB. Natural selection on tail and bill morphology in barn swallows Hirundo rustica during severe weather. Ibis. 1999c;141:652–659. [Google Scholar]
- Brown CR, Brown MB. Weather-mediated natural selection on arrival time in cliff swallows (Petrochelidon pyrrhonota) Behav Ecol Sociobiol. 2000;47:339–345. [Google Scholar]
- Brown CR, Brown MB. Group size and ectoparasitism affect daily survival probability in a colonial bird. Behav Ecol Sociobiol. 2004;56:498–511. [Google Scholar]
- Brown CR, Brown MB, Moore A, Komar N. Bird movement predicts Buggy Creek virus infection in insect vectors. Vect Borne Zoo Dis. 7(2007):304–314. doi: 10.1089/vbz.2006.0646. [DOI] [PubMed] [Google Scholar]
- Brown CR, Brown MB, Brazeal KR. Familiarity with breeding habitat improves daily survival in colonial cliff swallows. Anim Behav. 2008a;76:1201–1210. doi: 10.1016/j.anbehav.2008.03.028. [DOI] [PMC free article] [PubMed] [Google Scholar]
- Brown CR, Brown MB, Padhi A, Foster JE, Moore AT, Pfeffer M, Komar N. Host and vector movement affects genetic diversity and spatial structure of Buggy Creek virus (Togaviridae) Mol Ecol. 2008b;17:2164–2173. doi: 10.1111/j.1365-294X.2008.03747.x. [DOI] [PubMed] [Google Scholar]
- Brown MB, Brown CR. Blood sampling reduces annual survival in cliff swallows. Auk. 2009;126:853–861. [Google Scholar]
- Brown MB, Brown CR. Intense natural selection on morphology of cliff swallows (Petrochelidon pyrrhonota) a decade later: did the population move between adaptive peaks? Auk. 2011;128:69–77. [Google Scholar]
- Bryant DM, Jones G. Morphological changes in a population of sand martins (Riparia riparia) associated with fluctuations in population size. Bird Study. 1995;42:57–65. [Google Scholar]
- Bumpus HC. The elimination of the unfit as illustrated by the introduced sparrow. Passer domesticus Biol Lect Woods Hole Mar Biol Sta. 1899;6:209–226. [Google Scholar]
- Burnham KP, Anderson DR. Model Selection and Multimodel Inference: a Practical Information-Theoretic Approach. 2. Springer; New York, NY, USA: 2002. [Google Scholar]
- Carlson SM, Edeline E, Vøllestad LA, Haugen TO, Winfield IJ, Fletcher JM, James JB, Stenseth NC. Four decades of opposing natural and human-induced artificial selection acting on Windermere pike (Esox lucius) Ecol Lett. 2007;10:512–521. doi: 10.1111/j.1461-0248.2007.01046.x. [DOI] [PubMed] [Google Scholar]
- Carroll SP, Hendry AP, Reznick DN, Fox CW. Evolution on ecological time-scales. Funct Ecol. 2007;21:387–393. [Google Scholar]
- Clutton-Brock TH, editor. Reproductive Success: Studies of Individual Variation in Contrasting Breeding Systems. University of Chicago Press; Chicago, IL, USA: 1988. [Google Scholar]
- Cowley E, Siriwardena GM. Long-term variation in survival rates of sand martins Riparia riparia: dependence on breeding and wintering ground weather, age and sex, and their population consequences. Bird Study. 2005;52:237–251. [Google Scholar]
- Covas RM, Brown CR, Anderson MD, Brown MB. Stabilizing selection on body mass in the sociable weaver Philetairus socius. Proc R Soc Lond B. 2002;269:1905–1909. doi: 10.1098/rspb.2002.2106. [DOI] [PMC free article] [PubMed] [Google Scholar]
- Dai A, Trenberth KE, Qian T. A global dataset of Palmer Drought Severity Index for 1870– 2002: relationship with soil moisture and effects of surface warming. J Hydrometeorol. 2004;5:1117–1130. [Google Scholar]
- Easterling DR, Evans JL, Grosiman PY, Karl TR, Kunkel KE, Ambenje P. Observed variability and trends in extreme climate events: a brief review. Bull Am Meteorol Soc. 2000;81:417–425. [Google Scholar]
- Estes S, Arnold SJ. Resolving the paradox of stasis: models with stabilizing selection explain evolutionary divergence on all timescales. Am Nat. 2007;169:227–244. doi: 10.1086/510633. [DOI] [PubMed] [Google Scholar]
- Grant BR, Grant PR. Natural selection in a population of Darwin’s finches. Am Nat. 1989;133:377–393. [Google Scholar]
- Grant BR, Grant PR. Evolution of Darwin’s finches caused by a rare climatic event. Proc R Soc Lond B. 1993;251:111–117. [Google Scholar]
- Grant PR, Grant BR. Predicting microevolutionary responses to directional selection on heritable variation. Evolution. 1995;44:1796–1805. doi: 10.1111/j.1558-5646.1995.tb02236.x. [DOI] [PubMed] [Google Scholar]
- Grant PR, Grant BR. Unpredictable evolution in a 30-year study of Darwin’s finches. Science. 2002;296:707–711. doi: 10.1126/science.1070315. [DOI] [PubMed] [Google Scholar]
- Greenough G, McGeehin M, Bernard SM, Trtanj J, Riad J, Engelberg D. The potential impacts of climate variability and change on health impacts of extreme weather events in the United States. Environ Health Persp. 2001;109(Supplement 2):191–198. doi: 10.1289/ehp.109-1240666. [DOI] [PMC free article] [PubMed] [Google Scholar]
- Hairston NG, Jr, Dillon TA. Fluctuating selection and response in a population of freshwater copepods. Evolution. 1990;44:1796–1805. doi: 10.1111/j.1558-5646.1990.tb05250.x. [DOI] [PubMed] [Google Scholar]
- Hairston NG, Jr, Walton WE. Rapid evolution of a life history trait. Proc Natl Acad Sci USA. 1986;83:4831–4833. doi: 10.1073/pnas.83.13.4831. [DOI] [PMC free article] [PubMed] [Google Scholar]
- Kingsolver JG, Diamond SE. Phenotypic selection in natural populations: what limits directional selection? Am Nat. 2011;177:346–357. doi: 10.1086/658341. [DOI] [PubMed] [Google Scholar]
- Laake J, Rakimberdiev E, Collier B, Rotella J, Paul A. RMark: R Code for MARK Analysis. R Package Version 2.1.0. 2012 http://CRAN.R-project.org/package=RMark.
- Lande R, Arnold SJ. The measurement of selection on correlated characters. Evolution. 1983;37:1210–1226. doi: 10.1111/j.1558-5646.1983.tb00236.x. [DOI] [PubMed] [Google Scholar]
- Lebreton JD, Burnham KP, Clobert J, Anderson DR. Modeling survival and testing biological hypotheses using marked animals: a unified approach with case studies. Ecol Monogr. 1992;62:67–118. [Google Scholar]
- Lederer RJ. Bill size, food size, and jaw forces of insectivorous birds. Auk. 1975;92:385–387. [Google Scholar]
- Littrell EE. Swallow mortality during the “March miracle” in California. Calif Fish Game. 1992;78:128–130. [Google Scholar]
- Löhrl VH. Die Auswirkungen einer Witterungskatastrophe auf den Brutbestand der Mehlschwalbe (Delichon urbica) in verschiedenen Orten in Sudwestdeutschland. Die Vogelwelt. 1971;92:58–66. [Google Scholar]
- Losos JB, Schoener TW, Langerhans RB, Spiller DA. Rapid temporal reversal in predator-driven natural selection. Science. 2006;314:1111. doi: 10.1126/science.1133584. [DOI] [PubMed] [Google Scholar]
- McAdam AG, Boutin S. Variation in viability selection among cohorts of juvenile red squirrels (Tamiasciurus hudsonicus) Evolution. 2003;57:1689–1697. doi: 10.1111/j.0014-3820.2003.tb00374.x. [DOI] [PubMed] [Google Scholar]
- McKechnie AE, Wolf BO. Climate change increases the likelihood of catastrophic avian mortality events during extreme heat waves. Biol Lett. 2010;6:253–256. doi: 10.1098/rsbl.2009.0702. [DOI] [PMC free article] [PubMed] [Google Scholar]
- Merilä J, Sheldon BC, Kruuk LEB. Explaining stasis: microevolutionary studies in natural populations. Genetica. 2001;112–113:199–222. [PubMed] [Google Scholar]
- Morrissey MB, Hadfield JD. Directional selection in temporally replicated studies is remarkably consistent. Evolution. 2012;66:435–442. doi: 10.1111/j.1558-5646.2011.01444.x. [DOI] [PubMed] [Google Scholar]
- Newton I, editor. Lifetime Reproduction in Birds. Academic Press; London: 1989. [Google Scholar]
- Palmer WC. Meteorological Drought. United States Department of Commerce; Washington, DC, USA: 1965. (Research Paper 45). [Google Scholar]
- Price TD, Grant PR, Gibbs HL, Boag PT. Recurrent patterns of natural selection in a population of Darwin’s finches. Nature. 1984;309:787–789. doi: 10.1038/309787a0. [DOI] [PubMed] [Google Scholar]
- Price T, Brown CR, Brown MB. Evaluation of selection on cliff swallows. Evolution. 2000;54:1824–1827. doi: 10.1111/j.0014-3820.2000.tb00727.x. [DOI] [PubMed] [Google Scholar]
- Roche EA, Brown CR, Brown MB, Lear KM. Recapture heterogeneity in cliff swallows: increased exposure to mist nets leads to net avoidance. PloS One. 2013 doi: 10.1371/journal.pone.0058092. [DOI] [PMC free article] [PubMed] [Google Scholar]
- Robinson RA, Balmer DE, Marchant JH. Survival rates of hirundines in relation to British and African rainfall. Ringing Migr. 2008;24:1–6. [Google Scholar]
- Rosenzweig C, Iglesias A, Yang XB, Epstein PR, Chivian E. Climate change and extreme weather events: implications for food production, plant diseases, and pests. Global Change Human Health. 2001;2:90–104. [Google Scholar]
- Siepielski AM, DiBattista JD, Carlson SM. It’s about time: the temporal dynamics of phenotypic selection in the wild. Ecol Lett. 2009;12:1261–1276. doi: 10.1111/j.1461-0248.2009.01381.x. [DOI] [PubMed] [Google Scholar]
- Steffey KL, Rice ME, All J, Andow DA, Gray ME, Van Duyn JW. Handbook of Corn Insects. Entomological Society of America; Lanham, MD, USA: 1999. [Google Scholar]
- Stinchcombe JR, Agrawal AF, Hohenlohe PA, Arnold SJ, Blows MW. Estimating nonlinear selection gradients using quadratic regression coefficients: double or nothing? Evolution. 2008;62:2435–2440. doi: 10.1111/j.1558-5646.2008.00449.x. [DOI] [PubMed] [Google Scholar]
- Stokke BG, Møller AP, Saether BE, Rheinwald G, Gutscher H. Weather in the breeding area and during migration affects the demography of a small long-distance passerine migrant. Auk. 2005;122:637–647. [Google Scholar]
- Szep T. Relationship between west African rainfall and the survival of central European sand martins Riparia riparia. Ibis. 1995;137:162–168. [Google Scholar]
- White GC, Burnham KP. Program MARK: survival estimation from populations of marked animals. Bird Study. 1999;46:S120–S139. [Google Scholar]
Associated Data
This section collects any data citations, data availability statements, or supplementary materials included in this article.