

Abstract
Increasing evidence points to an association of airborne pollutant exposure with respiratory, cardiovascular, and neurological pathology. We examined whether or not ground-level ozone or fine particulate matter ≤ 2.5 μm in diameter (PM2.5) was associated with accelerated cognitive decline. Using repeated measures mixed regression modeling, we analyzed cognitive performance of a geographically diverse sampling of individuals from the National Alzheimer's Coordinating Center between 2004–2008. Ambient air concentrations of ozone and PM2.5 were established using a space-time Hierarchical Bayesian Model that statistically merged air monitor data and modeled air quality estimates. We then compared the ambient regional concentrations of ozone and PM2.5 with the rate of cognitive decline in residents within those regions. Increased levels of ozone correlated with an increased rate of cognitive decline, following adjustment for key individual and community-level risk factors. Furthermore, individuals harboring one or more APOE4 alleles exhibited a faster rate of cognitive decline. The deleterious association of ozone was confined to individuals with normal cognition who eventually became cognitively impaired as opposed to those who entered the study with baseline impairment. In contrast to ozone, we did not observe any correlation between ambient PM2.5 and cognitive decline at regulatory limits set by the Environmental Protection Agency. Our findings suggest that prolonged exposure to ground-level ozone may accelerate cognitive decline during the initial stages of dementia development.
Keywords: Air pollution, Alzheimer's disease, APOE4, ozone, particulate matter
Introduction
Alzheimer's disease (AD) is a progressive neurodegenerative disorder that currently affects over 5 million adults in the US and is expected to triple in prevalence by 2050 [1]. While death rates have declined for most major diseases over the last decade, deaths attributed to AD rose by 68% from 2000–2010 [2]. The increasing lifespan of the population and limited selectively effective treatment options have contributed to AD becoming a great emotional and financial burden to societies worldwide.
AD varies considerably in risk of development, age of onset, and rate of cognitive decline. The incidence of AD has not been attributed to a single nutritional, environmental, or genetic risk factor, leaving open the possibility that interactions among mutations, nutritional deficiencies, and environmental agents may contribute to the rate and extent of cognitive decline [3].
Emerging research suggests that outdoor air pollution, which aggravates cardio-respiratory conditions, may also play a detrimental role in brain health and functioning, especially in children and the elderly [4]. The US Environmental Protection Agency (EPA) regularly monitors levels of ozone, particulate matter, and other air pollutants. Air quality modelling estimates can then be used to test for associations with health outcome data. The challenges with using air quality data from ground-level monitors include: 1) sparse monitoring networks leading to missing data (monitors are typically located in urban areas); 2) varying collection schedules (ozone is monitored only during the summer, while PM monitors operate every third day); 3) strong seasonal and temperature variation; 4) changes in measurement techniques; and 5) outliers in monitor readings. A common limitation of prior studies is the dependence on proximity of participant residence to air quality monitors in order to assign pollution exposure. This approach leads to exclusion of participants that reside in regions with sparse monitors, such as rural areas.
We extend prior analyses using the EPA's Hierarchical Bayesian Model (HBM), which derives air quality estimates by statistically combining data from air quality monitors with modeled ozone and PM2.5 predictions from the EPA's Community Multi-scale Air Quality (CMAQ) model [5]. The CMAQ component of the HBM integrates meteorological conditions (wind, temperature, pressure, humidity, cloud formation, and precipitation rates), emissions (aerosols, volatile organic compounds (VOCs)) and a chemistry transport model [6]. The CMAQ is designed to handle multipollutant interactions simultaneously and model a wide array of chemical reactions, including catalytic cycling of nitrous oxides (NOx) and VOCs in the formation and destruction of ozone. CMAQ's multiscale (temporal and special scale) capability has replaced the need for separate rural and urban models [7]. Combined with ground-level monitoring, the “space-time fusion” model increased spatial and temporal resolution of air quality compared to using monitors alone, and thus allowed us to study a geographically dispersed population. The HBM has recently been successfully used to study associations with birth defects and low birth weight outcomes [8, 9]. We utilized the model to conduct a retrospective analysis of whether or not air pollution influences cognitive performance among participants of the national Alzheimer's Disease Center (ADC) program.
Materials and Methods
Study participants
The clinical data were obtained from an ongoing longitudinal study of ADC participants compiled by the University of Washington's National Alzheimer's Coordinating Center (NACC). The NACC gathers subject data from 34 past and present nation-wide ADCs, ensuring consistent assessment methods through the Uniform Data Set (UDS) [10]. This publicly accessible database contains data from over 20,000 subjects with cognitive status that ranged from normal cognition to mild cognitive impairment (MCI) and dementia. ADC participants are recruited in multiple ways, most prominently via referral by clinicians or family members, through community organizations or self-referral. Participants without a diagnosis of probable or possible dementia are recruited by ADCs as cognitively normal controls to prospectively study changes in cognition [11]. The NACC-UDS captures demographic variables, cognitive and functional ability tests, medical and family history, and diagnostic changes based on approximately annual follow-up visits [10].
Inclusion/exclusion criteria
We focused on the elderly participants, aged 60 or more. In order to effectively monitor change, we only included participants with a baseline Mini-Mental Status Examination (BLMMSE) score > 0 and a diagnosis of cognitive impairment in at least one follow-up visit. NACC participants with fewer than 3 clinic visits were excluded from modeling so as to allow for the multilevel trajectory model and maximize the observation period of the time dependent analyses. These criteria yielded a sample of 5,440 subjects with diagnoses ranging from normal cognition to probable/possible AD at baseline. We restricted participants to those with geographical information recorded between 2005 and 2008, which corresponds to the period during which air pollution was quantified. Merging of these data with air pollution estimates reduced the analytic sample to 5,116 participants.
Quantification of cognitive performance
The Mini-Mental Status Examination (MMSE), in which impairment is defined on a scale from 0–30 [12] and the Cognitive Dementia Rating Sum of Boxes (CDR-SB), which ranges from 0–18 [13], were utilized as outcome variables in regression analysis. We performed multilevel mixed regression modeling as described below on the entire analytic cohort and separately for those with and without initial cognitive impairment based on the traditional MMSE cutoff of 24 [14].
Exposure assessment
HBM-derived ozone and PM2.5 surface predictions were publicly available from the EPA. The HBM combines ground-level monitoring data from the Air Quality System (AQS) monitoring network and simulated ozone or PM2.5 data from the Community Multi-scale Air Quality (CMAQ) model [5]. Gridded predictions are given at the latitude and longitude locations of each CMAQ cell centroid. The estimates along with posterior (statistical) means and standard errors of the space-time ozone/PM2.5 surface are available at a 12 km × 12 km resolution covering the eastern United States and 36 km × 36 km resolution across the entire continental United States for 2001–2006. Because the NACC data covers the entire US, we used the full-coverage, 36 km resolution for these years. For 2007 and 2008, we used the 12 km grid extent, which began covering the entire US, whereas the 36 km grid resolution was no longer available online.
The predicted air pollution concentrations from the HBM were provided as daily 8-h maximum ozone concentrations in parts per billion (ppb) and 24-h average PM2.5 concentrations in μg/m3. To create a metric of long-term exposure, we averaged the daily estimates over each year, starting one year prior to each subject's respective baseline visit. If a subject changed residence during the follow-up period, the ZIP code of the previous visit was used. Due to patient confidentiality, the NACC provided only the first 3 digits of the residential ZIP codes. The resulting yearly ozone and PM2.5 surfaces were overlaid onto the 3-digit ZIP code boundary file in order to assign each resident his/her exposure (Fig. 1A). Because a grid centroid did not always fall into a 3-digit ZIP code region (Fig. 1B, C), interpolation was required for regions that did not contain a prediction. Inverse distance weighting (IDW) interpolation was deemed suitable due to the dense and evenly spaced distribution of points [15] constituting the 12 km and 36 km grids. IDW estimates values at unknown locations using a weighted average of the values at known locations, where the weights are inversely proportional to the distance between the unmeasured location and the sampled location [16]. Performance of IDW was evaluated by a control point accuracy assessment. Accuracy was assessed in terms of the mean-absolute-percentage error (MAPE), calculated as follows:
Fig. 1.
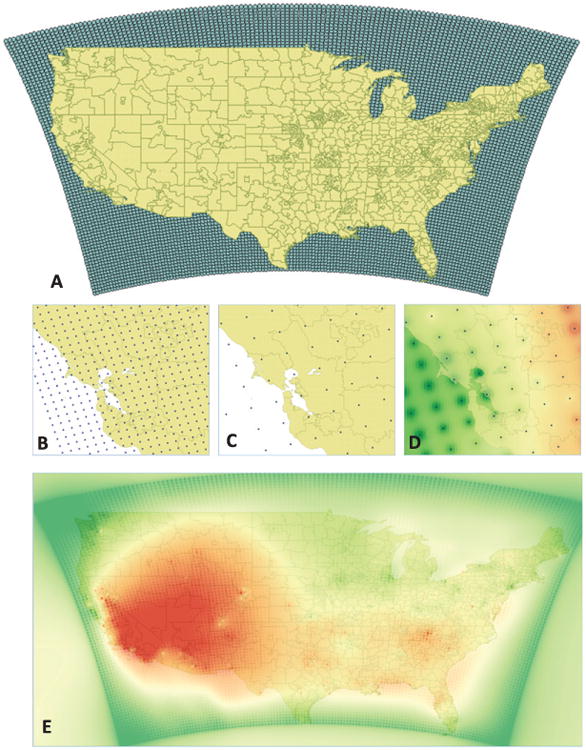
Geospatial processing of gridded ozone predictions. A) Spatial coverage of HBM air quality data and the 3-digit boundary map. B) 12 km × 12 km resolution of the 2001–2006 HBM data zoomed in on a Northern California region. C) 36 km × 36 km resolution of the 2007-2008 HBM data zoomed in on a Northern California region. D) Interpolated result of the HB modeled ozone data at the 36-km grid extent for a Northern California region. E) Interpolated result of the HB modeled 2004 ozone data for the contiguous United States colored by lowest (green) to highest (red) levels. Ozone levels are highest in the Southwestern states due to distinct meteorological and topological conditions, most notably the proximity to a large body of water [46].
| (1) |
where n is the number of validation points, pi is the predicted value at point i, oi is the observed value at point i [17].
Following interpolation, the resulting prediction surface was aggregated as a mean over each ZIP code (Fig. 1D, E). Spatial analysis was conducted using QGIS v2.6.1-Brighton.
For the final statistical analysis, we split the ozone and PM concentrations into tertiles and, for convenience, labeled them as being in the low, medium, and highest exposure level (Table 1). Specifically, ozone tertiles were defined as bottom third (<36.7 ppb; hereafter, “low”), middle third (36.7–40 ppb; hereafter, “medium”), and top third (>40ppb; hereafter, “highest”). Likewise, PM2.5 tertiles were defined as low (9.1 μg/m3), medium (9.1–10.6 μg/m3), and highest (>10.6 μg/m3).
Table 1. Ozone and PM2.5 concentrations from 2004–2008.
| Ozone (ppb) | PM2.5 (μg/m3) | |
|---|---|---|
| Mean | 38.7 ± 3.3 | 9.7 ± 1.9 |
| Maximum | 47.5 | 14.4 |
| Range | 30.4–47.5 | 3.8–14.4 |
| Tertile categories | 30.4–36.7 (low) | 3.8–9.1 (low) |
| 36.7–40.0 (medium) | 9.1–10.6 (medium) | |
| 40.0–47.5 (highest) | 10.6–14.4 (highest) |
Covariates and potential confounders
We explored effect modification and controlled for key sociodemographic covariates and health conditions, including age, gender, years of education, race, population density (as a surrogate for urban characteristics), smoking status (due to the PM content of cigarettes), B12 deficiency [18], and apolipoprotein E (APOE) genotype, as determined a priori from literature and available variables. We assumed no interaction terms among potential predictors.
Regression models
Multilevel mixed effects models with repeated measures were used to assess performance on the MMSE and CDR-SB across time. Mixed effects modeling allows for the examination of variability in the initial test performance and in the developmental course of cognition [19] without regard to missing observations or unevenly spaced waves of data [20]. We assessed the association of ozone/PM2.5 with the rate of cognitive decline over time (modeled as years in study), adjusting for covariates. The “highest” exposure tertile was selected as the reference group. We examined confounding of the association with average change in MMSE and CDR-SB performance by age, gender, education, race, APOE genotype, smoking status, and population density by sequential addition of each covariate into the mixed-effects model. All continuous predictors were centered on the mean. The regression coefficients of main interest were those of the interaction between time after the first outcome measurement and levels of exposure. These coefficients define the difference between the association of time and cognitive decline for each group of exposure level. The beta-coefficients and 95% confidence intervals (CI) of the MMSE/CDR-SB scores in the low and medium tertiles of ozone and PM2.5 were compared against the highest tertile using the mixed linear model. As each covariate was added into the model, relative goodness-of-fit was evaluated using the Akaike information criterion (AIC), where a lower value indicates better fit [21]. For both cognitive outcomes, we present the final model having the best AIC. Analyses were run on all participants and then repeated for the cognitively impaired versus intact groups at baseline. Separation into groups was preferred over adjusting for cognitive test performance within the model to avoid collinearity of covariates.
Concepts and methodology for fitting the statistical models were adapted from Applied Longitudinal Data Analysis by Singer and Willet [20]. Regression model parameters were estimated with the restricted maximum likelihood (REML) algorithm, as conducted by the MIXED procedure in IBM's SPSS v24.
Sensitivity analyses
In a sample of highly educated, largely white adults O'Bryant et al. [22] observed that an MMSE cutoff of 27 produces the optimal balance of sensitivity and specificity and a classification rate of 90% in detecting dementia. The average participant in our final analytic cohort had some college education. Thus, we considered it justified to compare outcomes for cognitively normal (>26) and impaired (≤26) individuals.
A separate sensitivity analysis was performed to assess the impact of migration on cognitive performance over time by including Florida residence as a covariate in the regression model. Florida residence was included to control for exposure received elsewhere based on the heavy influx of retirees into the state [23].
Results
Study demographics
Of the 5,419 participants with follow-up data, the average observation time was 4.4 ± 0.6 years (max = 7.5 years). The average annual cognitive decline was 1.3±0.02 on the MMSE and 1.0±0.02 on the CDR-SB (mean ± std. error of the mean). The average age at baseline was 76.8 ± 7.7 years (Fig. 2) and there was a nearly even split between male and female participants (Table 2). 29.2% of participants scored below the MMSE impairment cutoff of 24 and 51.4% had a BLMMSE ≤26 (Fig. 3). Regardless of MMSE cutoff, the cognitively impaired were significantly older than those who had normal cognition at baseline (p < 0.01).
Fig. 2.
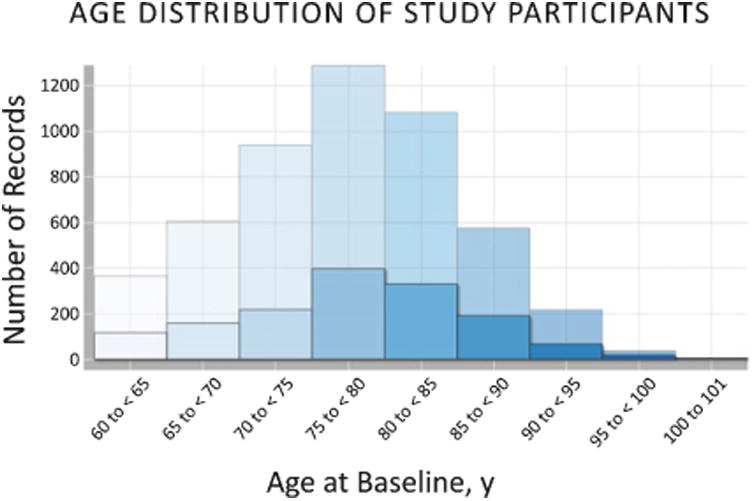
Age distribution of all NACC participants at baseline. Opaque bars show age of cognitively impaired participants (BLMMSE ≤ 24) in comparison to all (transparent bars).
Table 2. Demographic and baseline characteristics of participants.
| All participants (N=5116) | Participants with normal cognition, MMSE ≥ 24 (n = 3,624) | Participants with cognitive impairment, MMSE < 24 (n = 1,492) | ||||
|---|---|---|---|---|---|---|
|
|
|
|
||||
| Mean ± S.D. or n and % | Range | Mean ± S.D. or n and % | Range | Mean ± S.D. or n and % | Range | |
| Quantitative (continuous) characteristics | ||||||
| Age (y) | 76.8 ± 7.7 | 60–101 | 76.6 ± 7.7 | 60–100 | 77.2 ± 7.9 | 60–101 |
| Education (y) | 14.7 ± 3.6 | 0–29 | 15.3 ± 3.1 | 2–29 | 13.3 ± 4.1 | 1–24 |
| Population density (people/sq. mile) | 7854.4 ±18069.4 | 2–145,460 | 7,834.5 ± 18,413 | 2–145,460 | 7,902.7 ± 17,202 | 2.4–145,460 |
| Baseline MMSE | 25.0 ± 4.9 | 1–30 | 28.5 ±1.58 | 18–30 | 24.2 ± 5.1 | 1–30 |
| Baseline CDR-SB | 3.0 ± 3.2 | 0–18 | 0.18 ±0.45 | 0–3.5 | 3.6 ± 3.2 | 0–18 |
| Qualitative (categorical) characteristics | ||||||
| Male | 2,401 (46.9%) | 1,711 (47.2%) | 690 (46.2%) | |||
| Race | ||||||
| White | 4,278 (83.8%) | 3,145 (86.8%) | 1,133 (75.9%) | |||
| Black | 613 (12.0%) | 374 (10.3%) | 239 (16.0%) | |||
| Other | 212 (4.2%) | 100 (2.8%) | 112 (7.5%) | |||
| APOE genotype | ||||||
| ε3/ε3 | 1,844 (36.0%) | 1,404 (38.7%) | 440 (29.5%) | |||
| ε3/ε4 | 1,515 (29.6%) | 1,013 (28.0%) | 502 (33.6%) | |||
| ε3/ε2 | 295 (5.8%) | 252 (7.0%) | 43 (2.9%) | |||
| ε4/ε4 | 383 (7.5%) | 231 (6.4%) | 152 (10.2%) | |||
| ε4/ε2 | 112 (2.2%) | 87 (2.4%) | 25 (1.7%) | |||
| ε2/ε2 | 10 (0.2%) | 8 (0.2%) | 2 (0.1%) | |||
| Presence of ≥ 1 APOE4 allele | 2,123 (48.3%) | 1,331 (36.7%) | 679 (45.5%) | |||
| Florida residents at baseline | 111 (2.1%) | 66 (1.90%) | 43 (2.9%) | |||
| Ever smoked, yes | 2,566 (47.4%) | 1,770 (48.8%) | 1705 (45.7%) | |||
| B12 deficient | 580 (10.7%) | 386 (10.7%) | 163 (10.9%) | |||
Fig. 3.
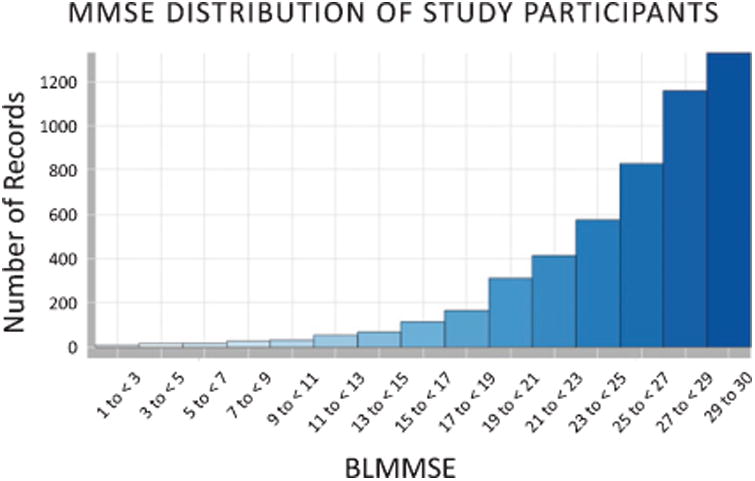
MMSE assessment of NACC participants at baseline.
Analysis of air quality
The majority of NACC participants were clustered within ZIP codes proximal to an ADC (Fig. 4). Accordingly, participants within respective ADCs were likely exposed to similar levels of ambient air pollution during the observation period. Multilevel modeling was used to account for clustering of participants within ZIP codes [24].
Fig. 4.
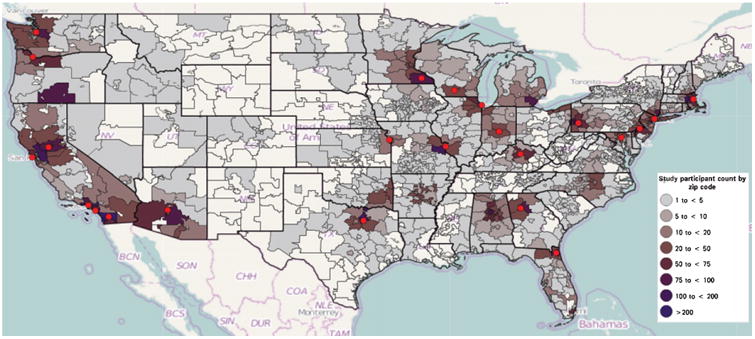
Distribution of participants according to 3-digit residential ZIP codes. ADC sites are depicted by red circles. Created using Weave v.1.9.38 [47].
Ozone and PM exposure were calculated after geospatially processed concentrations (aggregated by ZIP code) were averaged over each year (Table 1). We observed relatively constant levels of ozone and PM2.5 over our observation window (Fig. 5). Interpolation accuracy assessment for ozone indicated a MAPE value of 0.033 or 3.3% error. Notably, following interpolation and aggregation the mean observed PM2.5 concentration (9.7 ±1.9 μg/m3) did not exceed the annual primary National Ambient Air Quality Standard (NAAQS) of 12 μg/m3 [25].
Fig. 5.
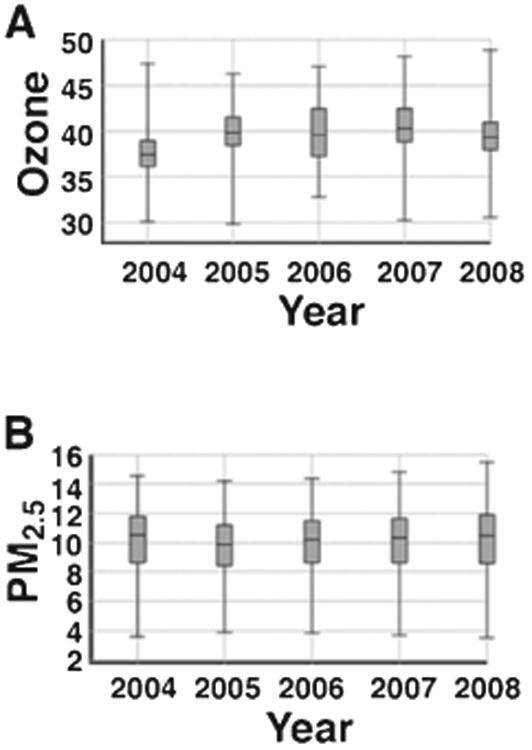
Annual average concentrations of ozone in ppb (A) and PM2.5 in μg/m3 (B) during the 2004–2008 observation period as calculated in Methods.
Mixed-effects modeling analysis
Unadjusted models showed that persons living in areas of highest ozone exposure had an MMSE decline of 0.34 points faster per year than those from lowest exposure areas. After adjusting for factors that are known to impact cognitive decline, regression models indicated that baseline cognitive performance for the entire cohort was significantly reduced by highest versus lowest levels of ozone in assessing both the MMSE and CDR-SB (Table 3). Higher ozone levels were directly associated with an accelerated rate of cognitive decline in total participants as well as the cognitively normal cohort in a dose-dependent manner (p < 0.05): highest and medium ozone exposure showed a significantly larger decline in cognition in relation to the lowest tertile of ozone exposure.
Table 3. Multivariate mixed effect modeling of the association of ozone levels with cognitive performance.
| Total Participants (n = 4,113) | ||||
|---|---|---|---|---|
|
| ||||
| Effect | MMSE | CDR-SB | ||
|
|
|
|||
| β-coefficient (95% CI) | p value | β-coefficient (95% CI) | p value | |
| Intercept | 23.3 (22.4, 24.2) | <0.0001 | 4.0 (3.4, 4.6) | <0.0001 |
| Time | −1.43 (−1.5, −1.4) | <0.0001 | 1.11 (1.1, 1.2) | <0.0001 |
| Low ozone | 0.83 (0.5, 1.2) | <0.0001 | −0.60 (−0.8, −0.3) | <0.0001 |
| Medium ozone | 0.01 (−0.3, 0.3) | 0.9 | −0.24 (−0.5, −0.02) | 0.034 |
| Highest ozone | 0 | Reference | 0 | Reference |
| Low ozone * Time | 0.35 (0.2, 0.5) | <0.0001 | −0.40 (−0.5, −0.3) | <0.0001 |
| Medium ozone * Time | 0.15 (0.03, 0.3) | 0.015 | −0.14 (−0.2, −0.1) | <0.0001 |
| Highest ozone * Time | 0 | Reference | 0 | Reference |
MMSE, Mini-Mental State Examination; CDR-SB, Cognitive Dementia Rating – Sum of Boxes; CI, Confidence Interval. The cognitively impaired group includes those with MCI and dementia at baseline. Models adjusted for age, gender, education, race, APOE genotype, smoking status, B12 deficiency, and population density. All continuous predictors were centered on the mean. The intercept represents the predicted levels of function at the initial observation for an individual with average values for continuous predictors and in the reference group of categorical predictors. Low and medium ozone levels are compared using the highest tertile of ozone as the reference. The absolute value of differences among MMSE/CDR-SB scores for tertiles are identical regardless of which category is chosen as the reference group. The slope reflects rates of change in MMSE or CDR-SB for each additional year of observation.
In the cognitively intact subgroup (BLMMSE ≥24), the association of ozone levels with cognition over time remained significant on both the MMSE and CDR-SB assessment (Table 4). We saw no significant association of ozone exposure with changes in the CDR-SB or the MMSE scores in the cognitively impaired subpopulation (BLMMSE <24).
Table 4. Multivariate mixed effect model of the association of ozone levels with cognitive performance stratified by baseline MMSE (BLMMSE).
| Effect | MMSE | CDR-SB | ||
|---|---|---|---|---|
|
|
|
|||
| β-coefficient (95% CI) | p value | β-coefficient (95% CI) | p value | |
| BLMMSE ≥ 24 (n = 2,968) | ||||
| Intercept | 27.58 (27.0, 28.2) | <0.0001 | 1.8 (1.4, 2.3) | <0.0001 |
| Time | −1.23 (−1.3, −1.1) | <0.0001 | 0.9 (0.84, 1.0) | <0.0001 |
| Low ozone | 0.30 (0.1, 0.5) | 0.002 | −0.27 (−0.4, −0.1) | <0.0001 |
| Medium ozone | −0.03 (−0.2, 0.1) | 0.7 | −0.1 (−0.2, 0.06) | 0.3 |
| Highest ozone | 0 | Reference | 0 | Reference |
| Low ozone * Time | 0.44 (0.3, 0.6) | <0.0001 | −0.39 (−0.5, −0.3) | <0.0001 |
| Medium ozone * Time | 0.18 (0.05, 0.3) | 0.01 | −0.17 (−0.3, −0.06) | 0.003 |
| Highest ozone * Time | 0 | Reference | 0 | Reference |
| BLMMSE < 24 (n = 1145) | ||||
| Intercept | 18.1 (17.0, 19.3) | <0.0001 | 6.9 (6.1, 7.8) | <0.0001 |
| Time | −2.1 (−2.4, −1.8) | <0.0001 | 1.8 (1.5, 2.0) | <0.0001 |
| Low ozone | 0.11 (–0.5, 0.7) | 0.7 | −0.11 (−0.6, 0.3) | 0.6 |
| Medium ozone | 0.8 (0.3, 1.3) | 0.001 | −0.98 (−1.3, −0.6) | <0.0001 |
| Highest ozone | 0 | Reference | 0 | Reference |
| Low ozone * Time | −0.2 (−0.7, 0.2) | 0.4 | −0.25 (−0.6, 0.1) | 0.2 |
| Medium ozone * Time | 0.16 (−0.3, 0.6) | 0.5 | −0.12 (−0.4, 0.2) | 0.5 |
| Highest ozone * Time | 0 | Reference | 0 | Reference |
BLMMSE score of 24 and above indicates normal cognitive functioning.
Trajectories for cognitive performance based on the mixed model results were plotted for each tertile of ozone. Residents in the highest ozone regions showed the steepest decline on the MMSE and CDR-SB, followed by medium and low ozone tertiles (Fig. 6A, C). Increased rates of cognitive decline as quantified by the MMSE and CDR-SB were observed with increasing concentrations of ozone: annual MMSE declines of 1.4, 1.3, and 1.1 and annual CDR-SB declines of 1.1, 1.0, and 0.8 were observed for the highest, medium, and low ozone levels, respectively.
Fig. 6.
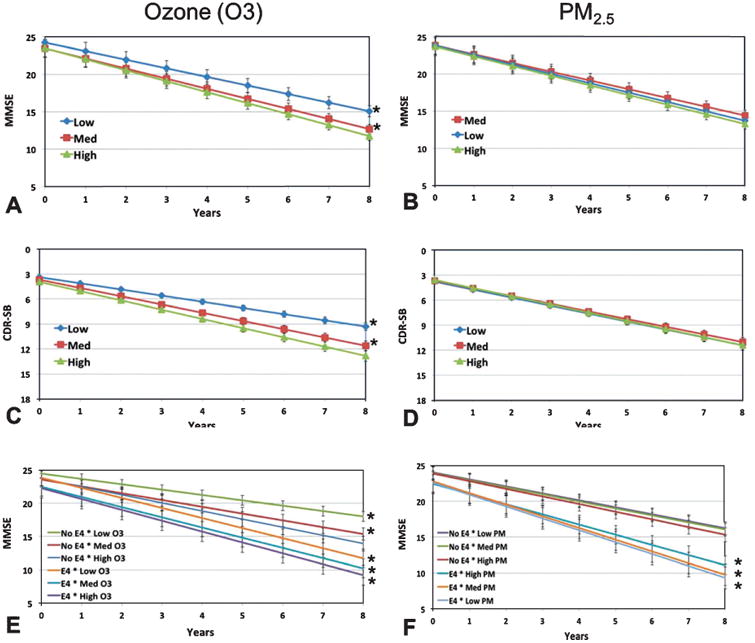
Performance on the MMSE and CDR-SB for all participants by pollutant. Cognitive performance trajectories based on MMSE for the three tertiles of ozone (A) and PM2.5 (B). Cognitive performance trajectories based on CDR-SB for the three tertiles of ozone (C, the y-axis is reversed) and PM2.5 (D, the y-axis is reversed). Cognitive performance trajectories based on MMSE for interaction of APOE and ozone (E) and APOE and PM2.5 (F). Values represent the intercept plus the slope of time in years modified by each pollutant category (mean ± std. error), *p < 0.05 versus reference (i.e., highest ozone and PM2.5 in A-D; Highest ozone and PM2.5/no E4 in E, F).
In contrast, no significant difference was observed in the rate of cognitive decline in either the MMSE or CDR-SB among the tertiles of PM2.5 at a p < 0.05 (Fig. 6B, D).
We modeled the influence of having an APOE4 allele in each tertile of ozone and PM2.5. The presence of at least one E4 allele was associated with a faster rate of cognitive decline within each tertile of ozone and PM2.5 as compared to having no E4 allele (Fig. 6E, F). A dose dependent relationship of cognitive decline with ozone and PM2.5 was observed, such that the slowest decline was in those who did not carry an E4 and in the lowest tertile of ozone or PM2.5. Using the group with no E4 and highest ozone tertile as reference, all other E4–ozone combinations had significantly different slopes for cognitive decline. The differences between slopes regarding PM2.5 were not significant within E4-carriers.
Sensitivity analysis
Florida residence was included as a covariate to analyze the impact of migration, because many residents of the state would have received their exposure elsewhere. The association between ozone and cognitive decline remained significant when Florida was included for both MMSE and CDR-SB (p < 0.0001) at all exposure levels. Associations with PM2.5 remained insignificant.
Next, a BLMMSE cutoff of 26 was used as an alternate criterion to discriminate persons with at least a mild level of impairment from those who were cognitively normal. The effect of ozone on 2,048 cognitively normal individuals (BLMMSE > 26) was significant between the lowest and highest concentrations on both the MMSE (β = 0.3) and CDR-SB (β = −2.44) at a p-value of <0.0001. The effect of ozone levels on the 2065 cognitively impaired (BLMMSE ≤26) was not significant on the MMSE (p = 0.2), but significant between the lowest and highest ozone levels on the CDR-SB (β = −0.39, p = 0.003). PM remained insignificant in all cases (p > 0.05).
Discussion
Determination of whether or not environmental factors may exacerbate age-related cognitive decline is inherently compromised by the difficulty of retrospective exposure assessment [26]. Despite this challenge, our findings suggest that ground-level ozone, but not ambient PM2.5, is directly associated with the rate of cognitive decline in a heterogeneous and broadly distributed US cohort of AD study participants.
The degree of cognitive impairment was assessed in two ways: with MMSE cut scores of 24 and 26. The second stratification is justified by O'Bryant et al.'s report that the traditional MMSE cutoff of 24 has not been shown to optimally classify highly educated individuals [22]. The effect of ozone was seen primarily in those who were cognitively normal at baseline, regardless of BLMMSE cutoff. This suggests that processes underlying the various stages of dementia development are distinct from one another, and risk factors influencing onset or early stages of impairment may give way to other, late stage moderators. In the cognitively impaired, an ozone effect was seen only below the BLMMSE cutoff of 26 and when assessing change with the CDR-SB, but not the MMSE. Inconsistency between CDR-SB and MMSE outcomes might be attributed to the known ceiling effects of the MMSE and its limited sensitivity to change [14].
Two prior epidemiological studies have examined the impact of ozone exposure and four evaluated the impact of PM2.5 [24, 27–29] on cognitive decline in older adults [30, 31]. Although all of the PM2.5 studies observed a significant inverse association with cognitive function, three of those studies were cross-sectional, while only one was longitudinal. The sole prior longitudinal study [28] included a wider range of PM exposure (1.9–25.5 μg/m3 versus the 3.8–14.4 μg/m3 range utilized herein) and a longer observation period (7–14 years). Our lower maximum concentration and shorter observation period may have precluded observation of an effect of PM2.5 on cognitive performance. Both studies evaluating ozone were cross-sectional: one reported an association of cognitive decline with exposure to ozone, while the impact in the other study varied according to the cognitive test instrument utilized. To our knowledge, the present study is the only longitudinal evaluation of the potential influence of ozone exposure on cognitive performance to date. Prior studies had a wide range of sample sizes (780 to >16,000), used different neurological tests as outcomes and had different measures of pollution exposure.
Ozone exposure increases the rate of cognitive decline among both E4 carriers and non-carriers. However, E4-carrying status increases the rate of cognitive decline at similar levels of ozone exposure. Several studies have investigated whether APOE alleles modify the association between air pollution and cognitive decline. Schikowski et al. found that traffic exposure significantly impairs cognition in elderly females who were carriers of at least one E4 allele [31]. In addition, the findings of Calderon-Garciduenas et al. support the hypothesis that prolonged exposure to air pollution may initiate the neurodegenerative process and increase the risk of developing early onset AD in E4 carriers [32, 33].
The mechanisms by which environmental toxins can compromise the central nervous system are being increasingly recognized. Acute or chronic exposure to ozone may induce an inflammatory response in the lungs or generate oxidative stress leading to brain lipid peroxidation, neuronal morphology changes and memory deterioration [34]. Evidence suggests that over time even at low levels (33.3–53.1 ppb) ozone has been shown to be associated with detrimental health outcomes, particularly, increased risk of death from respiratory causes, as per Jerrett et al. [35]. Hong et al. [36] reported an association of stroke and ground-level ozone at mean levels of 22.6 (±12.4) ppb. In the absence of an annual ozone standard, the current association study could inform yearly permissible exposure levels for the secondary pollutant, whose source is mainly traffic and industrial emissions.
The HB fusion model we employed addresses the need for accurate spatial characterization of ground-level air pollution. The HBM provides reliable information about levels of ozone and PM2.5 at a reasonable geographic scale and outperforms ordinary kriging in terms of bias and prediction intervals [37]. Data fusion creates information that is more complete than using monitors or model predictions alone. The gridded HBM predictions encompassed the entire US, allowing us to incorporate residents of both urban and rural areas who are distant from air quality monitors. This maximized our sample size (n = 5,116) as compared to the more restricted sample size of other regional and national level studies: [27, 29, 30] (n = 3,499, 1,496, 780, respectively).
We found that cognitive decline was more rapid with increasing ozone; however, ozone has a complicated chemistry in the atmosphere and forms by photochemical reaction of NOx and VOCs in the presence of sunlight. Although, the CMAQ component of the HBM takes into account the NOx reaction with VOCs [7] we were not able to isolate the individual effect of ozone's precursors. Subsequently, a limitation of our study was not being able to study other types of exposure, as no other criteria pollutant estimations were provided by the HBM. Nor did the HBM allow us to model personal and indoor exposure (aside from smoking status), or take into account time spent at home or at work, which can substantially impact total exposure in this older population. Our estimate of air pollution exposure in this study was also likely attenuated as a result of the interpolation and aggregation steps. IDW interpolation is an averaging technique that, by definition, cannot evaluate sample extremes above the maximum or below the minimum [38], causing attenuation of peak concentrations. Misclassification or random error in exposure reduces the power of a study and increases the likelihood that associations go undetected [39]. The potential for exposure error and bias usually leads to underestimation of relative variability of pollution estimates and relative risk in health studies [37]. Classical exposure error arises when the average of replicate measurements does not equate to the true exposure [39]. In our case, ozone measurements taken over the course of the year were averaged, when in fact ozone concentrations during the winter are negligible and highest during hot summer months. Classical exposure error is known to bias the regression coefficients toward the null, attenuating the association [39]. The study is also subject to Berkson exposure error, which occurs when group average exposure is used as a proxy for individual exposure [39]. Although we were restricted to partial residential information (i.e., the first 3 digits of ZIP codes), the regional distribution of ozone/PM makes geographical precision less of a concern. Furthermore, Mannshardt et al. found that using exposure models based on Hierarchical Bayesian methods, such as the HBM employed herein, helps reduce uncertainty associated with health effect estimates [40].
The limitation of HBM data availability posed a temporal challenge, as we could not model the cognitive decline of NACC participants past 2008. The average time period for our participant monitoring was 4.4 years, which is sufficient to analyze effects of short-term exposure and cognitive decline [41], but correlation with a longer exposure period should be considered for future analyses. Given sufficient sample size, it would also be interesting to investigate whether a younger, less sensitive cohort (aged <60) would not be as susceptible to variations in air quality. Another limitation of the present study is that the ADC dataset is subject to survival bias, volunteer bias and other distortions that likely contribute to its socioeconomic composition differing from a random sampling of the population. However, our methodology can be extended to survey studies analyzing a nationally representative sample of US adults. Controlling for key lifestyle and risk factors did not appreciably change the effect of the association, as the adjusted and unadjusted effects of ozone exposure were nearly identical. That strengthens confidence that confounding is less of a concern.
Conclusions
This work underscores a potential role of ozone in cognitive decline, including potentiation by APOE4. It is estimated that >57 million people nationwide were exposed to concentrations of air pollution that exceeded recommended air quality levels in 2014 [42]. The present study adds to the emerging body of literature on the association of low-level air pollution exposure with cognitive decline [43–45]. Further research on the impact of ozone exposure, adequate margins of safety, and measures to increase awareness is warranted.
Acknowledgments
The authors thank Andrew Dufilie and Shweta Purushe (UMass Lowell) for their programming support, Alex Brown (UMass Lowell) for GIS guidance, Lilah Besser (U Washington) for insight on the NACC dataset, and Wig Zamore (Somerville Transportation Equity Partnership) for insight and discussions of air quality developments in the field. The NACC database is funded by NIA/NIH Grant U01 AG016976. NACC data are contributed by the NIA-funded ADCs: P30 AG019610 (PI Eric Reiman, MD), P30 AG013846 (PI Neil Kowall, MD), P50 AG008702 (PI Scott Small, MD), P50 AG025688 (PI Allan Levey, MD, PhD), P50 AG047266 (PI Todd Golde, MD, PhD), P30 AG010133 (PI Andrew Saykin, PsyD), P50 AG005146 (PI MarilynAlbert, PhD), P50 AG005134 (PI Bradley Hyman, MD, PhD), P50 AG016574 (PI Ronald Petersen, MD, PhD), P50 AG005138 (PI Mary Sano, PhD), P30 AG008051 (PI Steven Ferris, PhD), P30 AG013854 (PI M. Marsel Mesulam, MD), P30 AG008017 (PI Jeffrey Kaye, MD), P30 AG010161 (PI David Bennett, MD), P50 AG047366 (PI Victor Henderson, MD, MS), P30 AG010129 (PI Charles DeCarli, MD), P50 AG016573 (PI Frank LaFerla, PhD), P50 AG016570 (PI Marie-Francoise Chesselet, MD, PhD), P50 AG005131 (PI Douglas Galasko, MD), P50 AG023501 (PI Bruce Miller, MD), P30 AG035982 (PI Russell Swerdlow, MD), P30 AG028383 (PI Linda Van Eldik, PhD), P30 AG010124 (PI John Trojanowski, MD, PhD), P50 AG005133 (PI Oscar Lopez, MD), P50 AG005142 (PI Helena Chui, MD), P30 AG012300 (PI Roger Rosenberg, MD), P50 AG005136 (PI Thomas Montine, MD, PhD), P50 AG033514 (PI Sanjay Asthana, MD, FRCP), P50 AG005681 (PI John Morris, MD), and P50 AG047270 (PI Stephen Strittmatter, MD, PhD).
Footnotes
Authors' disclosures available online (http://j-alz.com/manuscript-disclosures/17-0658r1).
References
- 1.Hebert LE, Beckett LA, Scherr PA, Evans DA. Annual incidence of Alzheimer disease in the United States projected to the years 2000 through 2050. Alzheimer Dis Assoc Disord. 2001;15:169–173. doi: 10.1097/00002093-200110000-00002. [DOI] [PubMed] [Google Scholar]
- 2.Alzheimer's Association. 2015 Alzheimer's disease facts and figures. Alzheimers Dement. 2015;11:332–384. doi: 10.1016/j.jalz.2015.02.003. [DOI] [PubMed] [Google Scholar]
- 3.Kamboh MI. Molecular genetics of late-onset Alzheimer's disease. Ann Hum Genet. 2004;68(Pt 4):381–404. doi: 10.1046/j.1529-8817.2004.00110.x. [DOI] [PubMed] [Google Scholar]
- 4.Guxens M, Sunyer J. A review of epidemiological studies on neuropsychological effects of air pollution. Swiss Med Wkly. 2012;141:w13322. doi: 10.57187/smw.2012.13322. [DOI] [PubMed] [Google Scholar]
- 5.McMillan N, Holland D, Morara M, Feng J. Combining numerical model output and particulate data using Bayesian space-time modeling. Environmetrics. 2010;21:48–65. [Google Scholar]
- 6.Community Modeling and Analysis System Center. Operational Guidance for the Community Multiscale Air Quality (CMAQ) Modeling System 2010 [Google Scholar]
- 7.Byun DW, Schere KL. Review of the governing equations, computational algorithms, and other components of the Models-3 Community Multiscale Air Quality (CMAQ) modeling system. Appl Mech Rev. 2006;59:51. [Google Scholar]
- 8.Vinikoor-Imler LC, Davis JA, Meyer RE, Luben TJ. Early prenatal exposure to air pollution and its associations with birth defects in a state-wide birth cohort from North Carolina. Birth Defects Res A Clin Mol Teratol. 2013;97:696–701. doi: 10.1002/bdra.23159. [DOI] [PubMed] [Google Scholar]
- 9.Vinikoor-Imler LC, Davis JA, Meyer RE, Messer LC, Luben TJ. Associations between prenatal exposure to air pollution, small for gestational age, and term low birth weight in a state-wide birth cohort. Environ Res. 2014;132:132–139. doi: 10.1016/j.envres.2014.03.040. [DOI] [PubMed] [Google Scholar]
- 10.Morris JC, Weintraub S, Chui HC, Cummings J, Decarli C, Ferris S, Foster NL, Galasko D, Graff-Radford N, Peskind ER, Beekly D, Ramos EM, Kukull WA. The Uniform Data Set (UDS): Clinical and cognitive variables and descriptive data from Alzheimer Disease Centers. Alzheimer Dis Assoc Disord. 2006;20:210–216. doi: 10.1097/01.wad.0000213865.09806.92. [DOI] [PubMed] [Google Scholar]
- 11.Gaugler JE, Hovater M, Roth DL, Johnston JA, Kane RL, Sarsour K. Depressive, functional status, and neuropsychiatric symptom trajectories before an Alzheimer's disease diagnosis. Aging Ment Health. 2014;18:110–116. doi: 10.1080/13607863.2013.814100. [DOI] [PMC free article] [PubMed] [Google Scholar]
- 12.Folstein MF, Folstein SE, McHugh PR. “Mini-mental state”. A practical method for grading the cognitive state of patients for the clinician. J Psychiatr Res. 1975;12:189–198. doi: 10.1016/0022-3956(75)90026-6. [DOI] [PubMed] [Google Scholar]
- 13.Hughes CP, Berg L, Danziger WL, Coben LA, Martin RL. A new clinical scale for the staging of dementia. Br J Psychiatry. 1982;140:566–572. doi: 10.1192/bjp.140.6.566. [DOI] [PubMed] [Google Scholar]
- 14.Sheehan B. Assessment scales in dementia. Ther Adv Neurol Disord. 2012;5:349–358. doi: 10.1177/1756285613489764. [DOI] [PMC free article] [PubMed] [Google Scholar]
- 15.Azpurua MA, Ramos KD. A comparison of spatial interpolation methods for estimation of average electromagnetic field magnitude. Prog Electromagn Res M. 2010;14:135–145. [Google Scholar]
- 16.Lu GY, Wong DW. An adaptive inverse-distance weighting spatial interpolation technique. Comput Geosci. 2008;34:1044–1055. [Google Scholar]
- 17.Yao X, Fu B, Lu Y, Sun F, Wang S, Liu M. Comparison of four spatial interpolation methods for estimating soil moisture in a complex terrain catchment. PLoS One. 2013;8:e54660. doi: 10.1371/journal.pone.0054660. [DOI] [PMC free article] [PubMed] [Google Scholar]
- 18.Moore E, Mander A, Ames D, Carne R, Sanders K, Watters D. Cognitive impairment and vitamin B12: A review. Int Psychogeriatr. 2012;24:541–556. doi: 10.1017/S1041610211002511. [DOI] [PubMed] [Google Scholar]
- 19.Xie H, Mayo N, Koski L. Identifying and characterizing trajectories of cognitive change in older persons with mild cognitive impairment. Dement Geriatr Cogn Disord. 2011;31:165–172. doi: 10.1159/000323568. [DOI] [PubMed] [Google Scholar]
- 20.Singer JD, Willett JB. Applied Longitudinal Data Analysis: Modeling Change and Event Occurrence. Oxford University Press; New York, New York: 2003. [Google Scholar]
- 21.Akaike H. A New Look at the Statistical Model Identification. IEEE Transactions on Automatic Control. 1974;19:716–723. [Google Scholar]
- 22.O'Bryant SE, Humphreys JD, Smith GE, Ivnik RJ, Graff-Radford NR, Petersen RC, Lucas JA. Detecting dementia with the mini-mental state examination in highly educated individuals. Arch Neurol. 2008;65:963–967. doi: 10.1001/archneur.65.7.963. [DOI] [PMC free article] [PubMed] [Google Scholar]
- 23.Retirement Migration in the 2000 Census. AARP Knowledge Management 2005 [Google Scholar]
- 24.Ailshire JA, Crimmins EM. Fine particulate matter air pollution and cognitive function among older US adults. Am J Epidemiol. 2014;180:359–366. doi: 10.1093/aje/kwu155. [DOI] [PMC free article] [PubMed] [Google Scholar]
- 25.EPA National Ambient Air Quality Standards (NAAQS) [Accessed August 15, 2017];NAAQS Table. https://www.epa.gov/criteria-air-pollutants/naaqs-table, Posted December 20, 2016.
- 26.Bakulski KM, Rozek LS, Dolinoy DC, Paulson HL, Hu H. Alzheimer's disease and environmental exposure to lead: The epidemiologic evidence and potential role of epigenetics. Curr Alzheimer Res. 2012;9:563–573. doi: 10.2174/156720512800617991. [DOI] [PMC free article] [PubMed] [Google Scholar]
- 27.Gatto NM, Henderson VW, Hodis HN, St John JA, Lurmann F, Chen JC, Mack WJ. Components of air pollution and cognitive function in middle-aged and older adults in Los Angeles. Neurotoxicology. 2014;40:1–7. doi: 10.1016/j.neuro.2013.09.004. [DOI] [PMC free article] [PubMed] [Google Scholar]
- 28.Weuve J, Puett RC, Schwartz J, Yanosky JD, Laden F, Grodstein F. Exposure to particulate air pollution and cognitive decline in older women. Arch Intern Med. 2012;172:219–227. doi: 10.1001/archinternmed.2011.683. [DOI] [PMC free article] [PubMed] [Google Scholar]
- 29.Ailshire JA, Clarke P. Fine particulate matter air pollution and cognitive function among U.S. older adults. J Gerontol B Psychol Sci Soc Sci. 2014;70:322–328. doi: 10.1093/geronb/gbu064. [DOI] [PMC free article] [PubMed] [Google Scholar]
- 30.Chen JC, Schwartz J. Neurobehavioral effects of ambient air pollution on cognitive performance in US adults. Neurotoxicology. 2009;30:231–239. doi: 10.1016/j.neuro.2008.12.011. [DOI] [PubMed] [Google Scholar]
- 31.Schikowski T, Vossoughi M, Vierkotter A, Schulte T, Teichert T, Sugiri D, Fehsel K, Tzivian L, Bae IS, Ranft U, Hoffmann B, Probst-Hensch N, Herder C, Kramer U, Luckhaus C. Association of air pollution with cognitive functions and its modification by APOE gene variants in elderly women. Environ Res. 2015;142:10–16. doi: 10.1016/j.envres.2015.06.009. [DOI] [PubMed] [Google Scholar]
- 32.Calderon-Garciduenas L, Mora-Tiscareno A, Melo-Sanchez G, Rodriguez-Diaz J, Torres-Jardon R, Styner M, Mukherjee PS, Lin W, Jewells V. A critical proton MR spectroscopy marker of Alzheimer's disease early neurodegenerative change: Low hippocampal NAA/Cr ratio impacts APOE varepsilon4 Mexico City children and their parents. J Alzheimers Dis. 2015;48:1065–1075. doi: 10.3233/JAD-150415. [DOI] [PubMed] [Google Scholar]
- 33.Calderon-Garciduenas L, Mora-Tiscareno A, Franco-Lira M, Zhu H, Lu Z, Solorio E, Torres-Jardon R, D'Angiulli A. Decreases in short term memory, IQ, and altered brain metabolic ratios in urban apolipoprotein epsilon4 children exposed to air pollution. J Alzheimers Dis. 2015;45:757–770. doi: 10.3233/JAD-142685. [DOI] [PubMed] [Google Scholar]
- 34.Jung CR, Lin YT, Hwang BF. Ozone, particu-late matter, and newly diagnosed Alzheimer's disease: A population-based cohort study in Taiwan. J Alzheimers Dis. 2015;44:573–584. doi: 10.3233/JAD-140855. [DOI] [PubMed] [Google Scholar]
- 35.Jerrett M, Burnett RT, Pope CA, 3rd, Ito K, Thurston G, Krewski D, Shi Y, Calle E, Thun M. Long-term ozone exposure and mortality. N Engl J Med. 2009;360:1085–1095. doi: 10.1056/NEJMoa0803894. [DOI] [PMC free article] [PubMed] [Google Scholar]
- 36.Hong YC, Lee JT, Kim H, Ha EH, Schwartz J, Christiani DC. Effects of air pollutants on acute stroke mortality. Environ Health Perspect. 2002;110:187–191. doi: 10.1289/ehp.02110187. [DOI] [PMC free article] [PubMed] [Google Scholar]
- 37.Baxter LK, Dionisio KL, Burke J, Ebelt Sarnat S, Sarnat JA, Hodas N, Rich DQ, Turpin BJ, Jones RR, Mannshardt E, Kumar N, Beevers SD, Ozkaynak H. Exposure prediction approaches used in air pollution epidemiology studies: Key findings and future recommendations. J Expo Sci Environ Epidemiol. 2013;23:654–659. doi: 10.1038/jes.2013.62. [DOI] [PMC free article] [PubMed] [Google Scholar]
- 38.Liu JG, Mason PJ. Image Processing and GIS for Remote Sensing: Techniques and Applications. John Wiley & Sons, Ltd; Chichester, UK: 2016. Inverse distance weighted average; p. 220. [Google Scholar]
- 39.Armstrong BG. Effect of measurement error on epidemiological studies of environmental and occupational exposures. Occup Environ Med. 1998;55:651–656. doi: 10.1136/oem.55.10.651. [DOI] [PMC free article] [PubMed] [Google Scholar]
- 40.Mannshardt E, Sucic K, Jiao W, Dominici F, Frey HC, Reich B, Fuentes M. Comparing exposure metrics for the effects of fine particulate matter on emergency hospital admissions. J Expo Sci Environ Epidemiol. 2013;23:627–636. doi: 10.1038/jes.2013.39. [DOI] [PMC free article] [PubMed] [Google Scholar]
- 41.Wilson RS, Gilley DW, Bennett DA, Beckett LA, Evans DA. Person-specific paths of cognitive decline in Alzheimer's disease and their relation to age. Psychol Aging. 2000;15:18–28. doi: 10.1037//0882-7974.15.1.18. [DOI] [PubMed] [Google Scholar]
- 42.United States Environmental Protection Agency. National Air Quality and Emissions Trends Report 2014 [Google Scholar]
- 43.Olmo NR, Saldiva PH, Braga AL, Lin CA, Santos Ude P, Pereira LA. A review of low-level air pollution and adverse effects on human health: Implications for epidemiological studies and public policy. Clinics (Sao Paulo) 2011;66:681–690. doi: 10.1590/S1807-59322011000400025. [DOI] [PMC free article] [PubMed] [Google Scholar]
- 44.Kim CS, Alexis NE, Rappold AG, Kehrl H, Hazucha MJ, Lay JC, Schmitt MT, Case M, Devlin RB, Peden DB, Diaz-Sanchez D. Lung function and inflammatory responses in healthy young adults exposed to 0.06 ppm ozone for 6.6 hours. Am J Respir Crit Care Med. 2011;183:1215–1221. doi: 10.1164/rccm.201011-1813OC. [DOI] [PMC free article] [PubMed] [Google Scholar]
- 45.Bell ML, Peng RD, Dominici F. The exposure-response curve for ozone and risk of mortality and the adequacy of current ozone regulations. Environ Health Perspect. 2006;114:532–536. doi: 10.1289/ehp.8816. [DOI] [PMC free article] [PubMed] [Google Scholar]
- 46.Yin Y, Shan W, Ji X, Deng X, Cheng J, Li L. Analysis of the surface ozone during summer and autumn at a coastal site in East China. Bull Environ Contam Toxicol. 2010;85:10–14. doi: 10.1007/s00128-010-9977-0. [DOI] [PubMed] [Google Scholar]
- 47.Dufilie A, Fallon J, Stickney P, Grinstein G. Weave: A web-based architecture supporting asynchronous and real-time collaboration. AVI 2012 Advanced Visual Interfaces International Working Conference 2012 [Google Scholar]