Abstract
Protein-protein interactions are fundamental mechanisms for relaying signal transduction in most cellular processes; therefore, identification of novel protein-protein interaction pairs and monitoring protein interaction dynamics are of particular interest for revealing how plants respond to environmental factors and/or developmental signals. A plethora of approaches have been developed to examine protein-protein interactions, either in vitro or in vivo. Among them, the recently established luciferase complementation imaging (LCI) assay is the simplest and fastest method for demonstrating in vivo protein-protein interactions. In this assay, protein A or protein B is fused with the amino-terminal or carboxyl-terminal half of luciferase, respectively. When protein A interacts with protein B, the two halves of luciferase will be reconstituted to form a functional and active luciferase enzyme. Luciferase activity can be recorded with a luminometer or CCD-camera. Compared with other approaches, the LCI assay shows protein-protein interactions both qualitatively and quantitatively. Agrobacterium infiltration in Nicotiana benthamiana leaves is a widely used system for transient protein expression. With the combination of LCI and transient expression, these approaches show that the physical interaction between COP1 and SPA1 was gradually reduced after jasmonate treatment.
Keywords: Cellular Biology, Issue 129, Plant biology, luciferase complementation, protein-protein interactions, Nicotiana benthamiana, photomorphogenesis, jasmonate, skotomorphogenesis, constitutive photomorphogenic 1 (COP1), suppressor of phytochrome A-105 1 (SPA1)
Introduction
In order to coordinate growth with its environment, plants have evolved elegant signaling pathways to sense, transduce, and respond to signaling cues. Like the runners in a relay race, proteins are necessary players in plant signal transduction. It has been widely recognized that protein-protein interaction (PPI) plays a major role for cellular communication. Protein phosphorylation, acetylation, and degradation are all dependent on physical interaction between a target protein and its modifying enzymes. For example, Jasmonate ZIM-domain protein (JAZ) family proteins interact with transcription factor MYC2 and suppress its transcriptional activity1,2. Given the importance of PPI, large-scale protein interactomes in plants have been explored recently3,4,5. These interactome results further reveal the complex regulatory network that coordinates diverse cellular functions.
There are some established approaches for monitoring PPI. The yeast two hybrid (Y2H) assay is the most widely used method for PPI detection. Y2H is easy to perform, and suitable for a quick test to examine protein interactions. Y2H is also widely used for screening unknown interaction partners for the specific protein-of-interest. However, because Y2H is entirely carried out in yeast, it cannot reflect the real scenario in plant cells and brings high false positive rates. Another similar strategy is the pull-down assay. In general, two proteins are expressed and purified from Escherichia coli cells and then mixed and immobilized for detecting protein interactions. Although this method is not time-consuming, it cannot obtain in vivo interaction results either. For in vivo interaction purposes, co-immunoprecipitation (co-IP) is the most popular assay, which requires high quality antibody to immunoprecipitate the protein-of-interest and cannot exclude the possibility of indirect PPIs. Moreover, due to the complicated experimental procedures in co-IP, the results usually vary with individual expertise.
Reporter based reconstitution assays greatly advance the detection of in vivo PPI. These methods include fluorescence resonance energy transfer (FRET)6, bimolecular fluorescence complementation (BiFC)7, and the firefly luciferase complementation imaging (LCI) assay8. Although these three approaches are better than co-IP to reflect the direct in vivo PPI, FRET, and BiFC need specific microscopes to detect fluorescence signals and cannot easily quantify the interaction intensity. In contrast, LCI takes advantage of firefly luciferase, which will glow after reacting with its substrate luciferin. More importantly, PPI intensity can be determined from the value of luciferase activity. Thus, LCI not only indicates whether two proteins interact or not, but also provides information on the interaction dynamics upon treatment. Although there are some established methods for monitoring interaction dynamics (based on surface plasmon resonance or thermo-stability shifts)9,10, these approaches require delicate instruments or specific labeling. In contrast, LCI is easier to perform and detect.
The principle for LCI is that the amino-terminal and carboxyl-terminal halves of luciferase (named N-Luc or C-Luc, respectively) were fused with protein A and B, and these two fusion proteins were simultaneously expressed in plant cells. If protein A interacts with protein B, then the two halves of luciferase will be reconstituted to be an active luciferase enzyme. Luciferase activity can be detected with a luminometer or CCD-camera. It is not necessary to obtain stable transformants for LCI; transient expression is enough to get a high-quality interaction result.
RING-type E3 ubiquitin ligase constitutive photomorphogenic 1 (COP1) interacts with a myriad of transcription factors and promotes their degradation through the 26S proteasome11. Some of these COP1-targeted transcription factors are positive regulators for photomorphogenesis. In darkness, COP1 interacts with suppressor of phytochrome A-105 1 (SPA1), which enhances COP1 E3 activity8. After perception of light, photoreceptors will abrogate the COP1-SPA1 interaction to inhibit COP1 activity and then stabilize COP1 substrates12,13,14. This example illustrates the biological significance of studying PPI and determining PPI dynamics.
Protocol
1. Preparation of Plants (8 weeks)
Put 50 Nicotiana benthamiana seeds in one 1.5 mL microcentrifuge tube containing 1 mL of 5% NaClO and 0.1% Triton X-100 (V/V) solution and leave for 5 min to sterilize the seeds.
Rinse the seeds with sterile water 5 times and suspend seeds in 200 µL of sterile water.
Carefully place individual seeds onto the surface of MS-agar medium (1 L: 1x Murashige & Skoog salts, 10 g sucrose, pH 5.8 (KOH), 1% agar) with fine tips and store medium plates in 4 °C for 3 days to synchronize germination. NOTE: To avoid microbe contamination, perform this step on a clean bench. It is not necessary to shake the tube during sterilization.
Place medium plates under normal growth conditions (22 °C, 80 - 90 µmolm-2s-1 white light intensity) for 10 days, and then transfer the germinated seedlings into soil. NOTE: Make sure to insert seedling roots into soil and do not damage the roots. Cover the tray with a transparent plastic cover overnight to maintain humidity.
Grow plants in a controlled growth room on a 16 h/8 h light/dark cycle and 70% humidity. 7-week-old N. benthamiana plants are ready for Agrobacteriumtumefaciens infiltration (Figure 1A). NOTE: Water plants and control pests as needed to keep plants healthy.

2. Transient Expression in N. Benthamiana Leaves (7 - 10 days)
Deliver 150 ng of plasmids (pEGAD-HA-LUC control plasmid, empty vector, and constructed plasmid for LCI assay, in this case we used pCAMBIA1300-Nluc and pCAMBIA1300-Cluc for plasmid construction) into A. tumefaciens competent cell strain GV3101 with a standard electroporation method.
Culture A. tumefaciens on Luria-Bertani (LB) agar medium (1 L: 10 g NaCl, 5 g yeast extract, 10 g tryptone, 1.5% agar) containing 50 µg/mL of kanamycin and 50 µg/mL of rifampicin at 28 °C for 4 days. NOTE: The choice of antibiotics depends on the vector and the A. tumefaciens strain used.
Inoculate one single A. tumefaciens colony from each plate into 3 mL of LB liquid medium containing 50 µg/mL of kanamycin and 50 µg/mL of rifampicin and shake at 220 rpm at 28 °C for 24 h to propagate cell culture.
Transfer 75 µL of bacterial culture into 15 mL fresh LB liquid medium containing 50 µg/mL of kanamycin and 50 µg/mL of rifampicin, diluting it by a factor of 200. Culture the bacteria at 220 rpm at 30 °C for about 8 h, until OD600 is between 0.5 to 1.0.
Transfer the A. tumefaciens liquid culture in 15 mL centrifuge tubes and centrifuge at 4,000 x g and 4 °C for 15 min. Discard the supernatant and suspend the pellet in 15 mL of transformation solution to wash pellet.
Spin the tube at 4,000 x g and 4 °C for 15 min and discard the supernatant. Repeat the washing step once again.
Resuspend the pellet in 5 mL of transformation solution and keep for 2 h at room temperature. Adjust the density of A. tumefaciens pellet cells with transformation solution until the final concentration of OD600 is 0.5, or mix two samples with equal volume for testing paired protein interactions.
Infiltrate suspended cells into the 4th to 7th leaves with a 1 mL needleless syringe (Figure 1B-C). After infiltration, cover plants immediately with a black plastic cover and place the tray in darkness for 12 h. After that, grow plants as usual for 2 to 4 days before detecting LUC activities. NOTE: Choose healthy leaves of similar size. The infiltration of four different zones in one leaf is fine.
3. Detecting Luciferase Activity (one day)
Note: There are two ways to monitor luciferase activity. One is based on imaging, and the other is to quantitatively measure luciferase activity.
- Imaging method
- Detach an infiltrated leaf and put the entire leaflet on MS-agar medium.
- Spray luciferin working buffer onto the leaf adaxial surface with a 50-mL spray bottle. Keep the materials in the dark for 5 min to quench the chlorophyll auto-fluorescence.
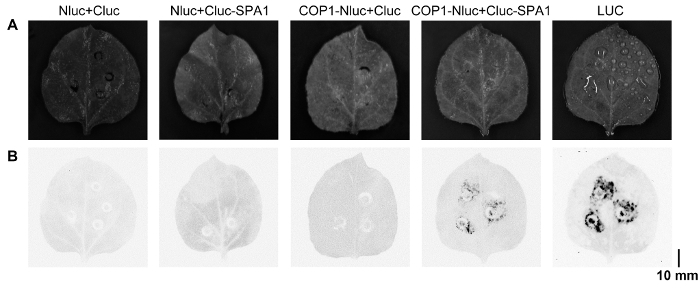
- Use a low-light cooled CCD imaging apparatus (cooled to -30 °C) to capture images (Figure 2). The light-filed exposure time is 50 ms, and luminescence detection time is 1 min. NOTE: Adjust the parameters according to the machine manual. Lower temperatures will enhance the signal-noise ratio to improve image quality.
- Alternatively, measure luminescence directly with a commercial luminometer.
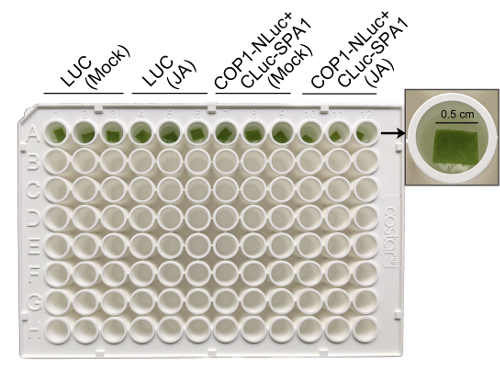
- Carefully cut out leaf fragments (about 0.25 cm2) from the infiltration area of the N. benthamiana leaves and immerse the leaf disk into 100 µL of deionized water in a 96-well white plate (Figure 3).
- Add 10 µL of luciferin working buffer and leave for 5 min. Then perform specific treatments to study the protein interaction dynamics. NOTE: Detect the luminescence with a luminometer at different time points to obtain the luciferase activity dynamics, which represent the kinetics of protein-protein interactions under certain treatment. This method has advantages for testing a large number of protein pairs simultaneously. For those without a commercial luminometer, examine the luciferase protein abundances by western blot, therefore refer to the LUC activity quantitively. If light is not necessarily required, just keep the plate in the luminometer and measure luminescence at different time points. Otherwise, move the plate into a growth chamber during the detection gap. To obtain statistically significant results, use at least three biological replicates. Although LUC activities from different infiltration zones will vary, their changing patterns are consistent after normalization.


Representative Results
Three major steps can be singled out in this luciferase complementation protocol for studying protein-protein interactions in vivo, including plant growth, tobacco infiltration, and the luciferase assay. The most crucial step in this protocol is infiltrating liquid A. tumefaciens into N. benthamiana leaves (Figure 1).
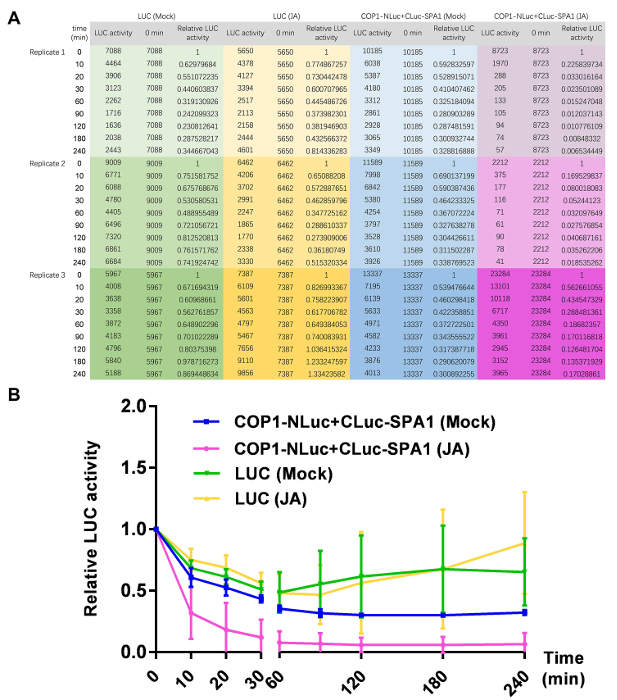
Here is an example of the usefulness of this technique confirming jasmonate reducing COP1-SPA1 interactions. The amino-terminal and carboxyl-terminal halves of luciferase were fused with COP1 (COP1-NLuc) or SPA1 (CLuc-SPA1), respectively. COP1-SPA1 interactions result in the complementation of functional luciferase. The luciferase activity was imaged by CCD camera (Figure 2), and the enzymatic activity can be detected with a luminometer (Figure 3). To exclude the possibility that luciferase itself is affected by treatment, the full-length luciferase (LUC) gene was also transiently expressed in N. benthamiana leaves to serve as a control. The luciferase activity before jasmonate treatment (time 0) was set as 1, and then each luciferase activity value obtained under jasmonate treatment was normalized with time 0 to get the relative luciferase activity (Figure 4). The results showed that COP1-SPA1 interactions (reflected by luciferase activity) gradually declined in darkness, and that JA treatment further reduced their interactions.

Figure 1. Process for N. benthamiana infiltration. (A) Abaxial and adaxial view of plants before infiltration. (B) Representative image to show the infiltration protocol. (C) Abaxial and adaxial view of plants after infiltration. Please click here to view a larger version of this figure.
Figure 2. Imaging luciferase activity under CCD-camera. (A) Representative image of one N. benthamiana leaf under a normal light field. (B) Detecting luminescence signals under CCD-camera to show luciferase activities. Please click here to view a larger version of this figure.
Figure 3. Representative image to show how to measure luminescence from cut leaf disks. Infiltrated leaf disks were cut and put into a 96-well white plate for measuring luminescence signals. Please click here to view a larger version of this figure.
Figure 4. Representative results from one transient luciferase complementation assay. (A) The treatment duration (time) and the original results of the luminescence value (LUC activity) were listed. There are three independent replicates for each sample. For preparing this chart, LUC activity at different treatment time points was normalized with time 0 as the relative LUC activity. (B) Quantification of relative LUC activities, showing COP1-SPA1 interactions in darkness gradually declined, which can be reduced by further JA treatment. The error bar indicates the standard deviation (sd). Please click here to view a larger version of this figure.
Discussion
The protocol described here is simple and reproducible for studying in vivo protein-protein interactions, and particularly suitable for detecting protein interaction dynamics under exogenous treatment. The key step in this assay is N. benthamiana infiltration. To ensure infiltration success, plants must be very healthy. Another critical factor is when to check luciferase activity after infiltration. There is no correct answer for this question. Researchers are encouraged to monitor luciferase activity at different days after infiltration to judge when the luciferase is expressed at the highest level, because we observed the protein expression levels fluctuating with time8.
It is possible that no luminescence may be detected in some experiments. False negatives could not be excluded without appropriate controls. A full-length luciferase control is required to prove infiltration and luciferase detection works. Then if there is still no luminescence in putative protein interaction pairs, an immunoblot would be required to detect protein expression, in case one or two proteins are not successfully expressed. The last possibility is that the protein interactions might hinder the luciferase complementation due to protein conformational reasons. If this happens, using truncated protein or switching the protein fusion with N-Luc or C-Luc will be helpful to solve this problem.
Although protoplasts are also popular for transient expression, the isolation of protoplasts and plasmid delivery into protoplast cells needs specific expertise and requires harmful CsCl2 for large-scale plasmid extraction. In addition, during protoplast isolation, plants are heavily wounded, which might affect PPI assays.
There is no golden standard assay. To our knowledge, this easily performed luciferase complementation assay could provide useful protein interaction kinetics information. Of course, alternative approaches for studying protein interactions in vivo will confirm these results and improve understanding of biochemical events in cells.
Disclosures
The authors have nothing to disclose.
Acknowledgments
This work was supported by the Natural Science Foundation of Jiangsu Province (BK20140919), the National Natural Science Foundation of China (31470375), the Priority Academic Program Development of Jiangsu Higher Education Institutions and Qing Lan Project.
References
- Thines B, et al. JAZ repressor proteins are targets of the SCF(COI1) complex during jasmonate signalling. Nature. 2007;448:661–665. doi: 10.1038/nature05960. [DOI] [PubMed] [Google Scholar]
- Chini A, et al. The JAZ family of repressors is the missing link in jasmonate signalling. Nature. 2007;448:666–671. doi: 10.1038/nature06006. [DOI] [PubMed] [Google Scholar]
- Jones AM, et al. Border control--a membrane-linked interactome of Arabidopsis. Science. 2014;344:711–716. doi: 10.1126/science.1251358. [DOI] [PubMed] [Google Scholar]
- Arabidopsis Interactome Mapping Consortium. Evidence for network evolution in an Arabidopsis interactome map. Science. 2011;333:601–607. doi: 10.1126/science.1203877. [DOI] [PMC free article] [PubMed] [Google Scholar]
- Yazaki J, et al. Mapping transcription factor interactome networks using HaloTag protein arrays. Proc Natl Acad Sci U S A. 2016;113:4238–4247. doi: 10.1073/pnas.1603229113. [DOI] [PMC free article] [PubMed] [Google Scholar]
- Kenworthy AK. Imaging protein-protein interactions using fluorescence resonance energy transfer microscopy. Methods. 2001;24:289–296. doi: 10.1006/meth.2001.1189. [DOI] [PubMed] [Google Scholar]
- Walter M, et al. Visualization of protein interactions in living plant cells using bimolecular fluorescence complementation. Plant J. 2004;40:428–438. doi: 10.1111/j.1365-313X.2004.02219.x. [DOI] [PubMed] [Google Scholar]
- Chen H, et al. Firefly luciferase complementation imaging assay for protein-protein interactions in plants. Plant Physiol. 2008;146:368–376. doi: 10.1104/pp.107.111740. [DOI] [PMC free article] [PubMed] [Google Scholar]
- Layton CJ, Hellinga HW. Quantitation of protein-protein interactions by thermal stability shift analysis. Protein Sci. 2011;20:1439–1450. doi: 10.1002/pro.674. [DOI] [PMC free article] [PubMed] [Google Scholar]
- Schuck P. Reliable determination of binding affinity and kinetics using surface plasmon resonance biosensors. Curr Opin Biotechnol. 1997;8:498–502. doi: 10.1016/s0958-1669(97)80074-2. [DOI] [PubMed] [Google Scholar]
- Huang X, Ouyang X, Deng XW. Beyond repression of photomorphogenesis: role switching of COP/DET/FUS in light signaling. Current opinion in plant biology. 2014;21:96–103. doi: 10.1016/j.pbi.2014.07.003. [DOI] [PubMed] [Google Scholar]
- Liu B, Zuo Z, Liu H, Liu X, Lin C. Arabidopsis cryptochrome 1 interacts with SPA1 to suppress COP1 activity in response to blue light. Genes Dev. 2011;25:1029–1034. doi: 10.1101/gad.2025011. [DOI] [PMC free article] [PubMed] [Google Scholar]
- Lian HL, et al. Blue-light-dependent interaction of cryptochrome 1 with SPA1 defines a dynamic signaling mechanism. Genes Dev. 2011;25:1023–1028. doi: 10.1101/gad.2025111. [DOI] [PMC free article] [PubMed] [Google Scholar]
- Zuo Z, Liu H, Liu B, Liu X, Lin C. Blue light-dependent interaction of CRY2 with SPA1 regulates COP1 activity and floral initiation in Arabidopsis. Curr Biol. 2011;21:841–847. doi: 10.1016/j.cub.2011.03.048. [DOI] [PMC free article] [PubMed] [Google Scholar]


