Abstract
Antibody titers are commonly used as surrogate markers for serological protection against influenza and other pathogens. Detailed knowledge of antibody production pre- and post-vaccination is required to understand vaccine-induced immunity. This article describes a reliable point-by-point protocol to determine influenza-specific antibody titers. The first protocol describes a method to specify the antigen amounts required for hemagglutination, which standardizes the concentrations for subsequent usage in the second protocol (hemagglutination assay, HA assay). The second protocol describes the quantification of influenza-specific antibody titers against different viral strains by using a serial dilution of human serum or cell culture supernatants (hemagglutination inhibition assay, HI assay).
As an applied example, we show the antibody response of a healthy cohort, which received a trivalent inactivated influenza vaccine. Additionally, the cross-reactivity between the different influenza viruses is shown and methods to minimize cross-reactivity by using different types of animal red blood cells (RBCs) are explained. The discussion highlights advantages and disadvantages of the presented assays and how the determination of influenza-specific antibody titers can improve the understanding of vaccine-related immunity.
Keywords: Medicine, Issue 130, Hemagglutination inhibition assay, screening, titer, antibody, influenza A, influenza B, H1N1, H3N2, cross-reactivity, titration, antigen
Introduction
Infection with influenza virus is associated with considerable morbidity, mortality, and high healthcare costs1,2,3,4. In particular, elderly, newborns, pregnant women, and patients with chronic disease are at risk for more severe clinical outcomes. Therefore, vaccination against circulating influenza virus strains is the primary measure to decrease the burden of disease in these high-risk populations. The increase of the individual immune response after vaccination, e.g., influenza-specific antibodies above a protective threshold, reduces the individual risk of infection and in general the likelihood of viral transmission within a population5. A detailed understanding of the vaccine-induced humoral immune response in different populations and across various age groups is a key element to answer important clinical questions6,7,8,9, such as: Why do some elderly patients have infections despite previous vaccination? What is a "good" and "sufficient" vaccine-induced protection? How often should a vaccine be applied to an immunosuppressed patient to reach protective titers? What is the most effective dosage? What is the impact of a novel adjuvant on post-vaccination antibody titers? The measurement of the vaccine-specific antibody production may help answer these important questions and improve vaccination outcomes.
The quantification of virus-specific antibody titers can be performed with various immunological methods. This includes solid-phase10 or bead-based ELISA11 assays, the HI assay12, and neutralizing assays13. ELISA-based methods allow the screening of relatively large amounts of serum samples against various antigens. Also, pathogen-specific Immunoglobulin (Ig)M and IgG can be separately explored. Although the characteristics of an antigen, e.g., the linear amino acid sequence or virus-like particle may influence the binding of antibodies, the spectrum of potential epitopes is very broad and does not provide information on whether an antibody response has functional relevance.
In contrast, the neutralization assay determines the potential of antibodies to functionally inhibit the infection of cells and therefore reflects the neutralization potential. However, this method is very labor intensive, requires culturing of specific cell lines and live viruses, and therefore, it is time-consuming, expensive, and requires special equipment.
This article describes a step-by-step the World Health Organization (WHO)-based HI protocol12 to quantify influenza-specific antibody titers. Hemagglutination is a characteristic effect of some viruses leading to the agglutination of erythrocytes. The inhibition of this effect with patient sera allows the measurement of inhibitory antibody concentrations, which reflects a neutralizing effect.
We have modified the workflow of the WHO-protocol to allow a more efficient handling of multiple samples at the same time and thereby reducing the required time. The first protocol describes the determination of the agglutination potential of a particular influenza antigen. In doing so, the correct influenza antigen concentration is determined for the second protocol. This part should be repeated with every new viral antigen, as well as each batch of blood.
The second protocol describes the determination of influenza-specific antibody titers. The presented protocols are optimized for the investigation of influenza virus and human serum samples however, it can also be applied for mouse serum samples or cell-culture supernatants from stimulated immune cells, e.g., virus-specific B-cells. Results can be determined as absolute measured titers. In many vaccine studies, the geometric mean titers and the 95% confidence interval are shown for each particular population. For interpretation, seroprotection or seroconversion are often used to describe the susceptibility of a population to a certain virus. Seroprotection is defined as a titer of ≥1:40, and seroconversion as a more than 4-fold titer increase with achievement of seroprotective titers between two time points (most commonly pre-vaccination and 30 days post-vaccination are used).
Both protocols are easy to use and they can be adapted to a broad range of research questions. In particular, they can be used to determine reliably and quickly the antibody titers against various other viruses with the capacity for hemagglutination, such as measles, polyomaviruses, mumps, or rubella14,15,16.
Protocol
The study protocols were approved through the local ethical review board (www.EKNZ.ch) and written informed consent was obtained from all participants.
1. Serum Collection
Collect serum samples from humans at time points of interest. For this study, we collected sera at days 0 (time of influenza vaccination), +7, +30, +60, and +180 after vaccination.
To obtain the serum, centrifuge the sample tubes at 1,200 x g for 10 min at room temperature (20 - 25 °C). NOTE: Non-centrifuged blood samples should be stored at 4 °C, and for no longer than 24 h.
Aliquot the serum into different tubes (cryo-vials) and freeze at -80 °C until use.
Perform the subsequent assays batch-wise, including all the time-points of one person to reduce variability within a patient.
2. Preparation of Antigens
CAUTION: Five different antigens are used (see Table of Materials). Prepare antigens in a Biosafety Level 2 (BSL-2) laboratory.
According to the manufacturer's instructions, reconstitute the total contents of one lyophilized influenza antigen ampoule with 1.0 mL of distilled water and allow the dissolved antigen to stand for a minimum of 5 min at room temperature before proceeding.
Aliquot the antigen solution to 1.5 mL tubes and freeze at -80 °C until further use.
3. Preparation of Cholera Filtrate
NOTE: Cholera filtrate is used as a receptor destroying enzyme (RDE) according to the WHO protocol12. This removes innate inhibitors from the serum which would interfere with the assay17.
Reconstitute the lyophilized RDE according to the manufacturer's instructions.
Store the RDE solution in a 15 mL tube at 4 °C until further use.
4. HA Assay
NOTE: To ensure that the HI assays are comparable between several plates, the same amount of virus particles must be used for each plate. The HA assay (also called HA titration) is performed to quantify the virus particles necessary for hemagglutination, and is recorded in HA units. A "unit" of hemagglutination is an operational unit dependent on the method used for HA titration and is not a measurement of an absolute amount of virus. Thus, an HA unit is defined as the amount of virus needed to agglutinate an equal volume of a standardized RBC suspension. According to the WHO, the standard amount used for the HI assay is 4 HA units per 25 µL. For an illustration of the principle of the HA assay see Figure 1.
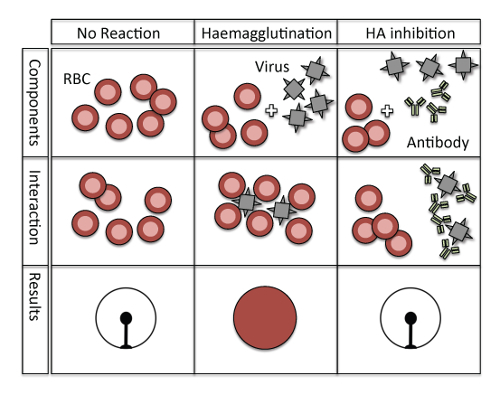
Figure 1: Principle of hemagglutination and hemagglutination inhibition. No hemagglutination occurs in a negative control situation without viruses and antibodies (left column), and erythrocytes hemagglutinate only in the presence of influenza virus (middle column). However, when the hemagglutinin of the influenza virus is blocked by virus-specific antibodies then no hemagglutination can occur (right column). Please click here to view a larger version of this figure.
NOTE: The RBCs used are dependent on the type of influenza virus in the assay (Table 1). Further, for various types of 96-well micro titer plates, the incubation time as well as the appearance of the non-agglutinated cells differ (Table 2).
| Influenza antigen | A/California/7/09 (H1N1) | A/Switzerland/9715293/2013 (H3N2) | A/Texas/50/2012 (H3N2) | B/Brisbane/60/08 | B/Massachusetts/02/2012 |
| RBC species | Chicken | Guinea Pig | Guinea Pig | Turkey | Turkey |
Table 1: Influenza antigens and corresponding species of RBCs. According to the manufacturer's instructions (NIBSC).
| RBC species | Chicken | Turkey | Guinea pig | Human type O |
| Concentration of RBCs (v/v) | 0.75% | 0.75% | 1% | 1% |
| Type of microtiter plate | V bottom | V bottom | U bottom | U bottom |
| Incubation time, RT | 30 min | 30 min | 1 hour | 1 hour |
| Appearance of non-agglutinated cells | Button* | Button* | halo | halo |
Table 2: Assay conditions with different species of RBCs. According to the WHO protocol. (* flows when tilted).
- Preparation of the RBC Suspension
- Dilute the RBC stock suspension (10%, v/v; except human type O) (see Table of Materials) with phosphate buffered saline (PBS) to make the proper concentrations for avian and mammalian RBCs of 0.75% and 1%, respectively.
Figure 2: Plate design of the HA assay. The HA titration is performed in duplicates. No antigen was added to the control rows. Also see Figure 4 for the determination of the best antigen concentration. Please click here to view a larger version of this figure.
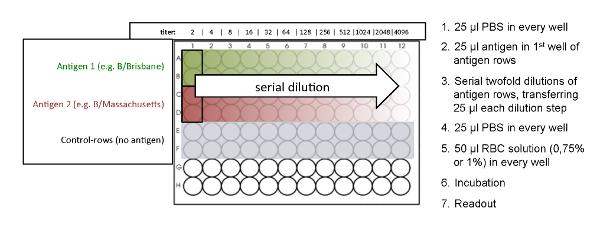
- Preparation of the 96-well Micro Titer Plate NOTE: SeeFigure 2for an overview of the plate design.
- Add 25 µL of PBS to wells 1 to 12 of each used row of a 96-well micro titer plate by using a multichannel pipette (Figure 2). Use the V-shaped micro titer plate when working with avian RBCs, like chicken and turkey. Use the U-shaped micro titer plate when working with mammalian RBCs, like guinea pig and human type O (Table 2).
- Add 25 µL of influenza antigen to the first well of the antigen-rows, which are arranged in duplicates. No antigen is added to the control rows. The control rows should not show a hemagglutination effect and serve as negative controls (Figure 2).
- Perform a serial 2-fold dilution by transferring 25 µL from the first well of the antigen-rows to successive wells by using a multichannel pipette. Mix each dilution step by pipetting up and down gently 10 times.
- Discard the final 25 µL of the last wells.
- Add 25 µL of PBS to wells 1 to 12 of each used row by using a multichannel pipette, in order to reach a total volume of 50 µL per well.
- Add 50 µL of the RBC suspension to each used well by using a multichannel pipette.
- Tap the plate carefully 10 times on all four sides to mix.
- Cover the plate with a lid and incubate at room temperature for the appropriate amount of time depending on the RBC species used (see Table 2). Do not move the plate while incubating.
Figure 3: Agglutination patterns of avian and mammalian RBCs. V-shaped micro titer plates are used when working with avian RBCs. The readout is performed in a tilted plate position, and non-agglutinated RBCs start to run down forming a tear-like shape. U-shaped microtiter plates are used when working with mammalian RBCs. The readout is then performed in a non-tilted position, and non-agglutinated RBCs form a small halo. Please click here to view a larger version of this figure.

- Reading the plate NOTE: The readout is slightly different when using avian RBCs compared to mammalian RBCs, because of the different shaped micro titer wells (Figure 3).
- Readout of avian RBCs
- Tilt the plate 90° for 25 s. NOTE: Tilting the plate is crucial for the differentiation of avian patterns, because all three different types of agglutination patterns (completely agglutinated, partially agglutinated, and non-agglutinated) appear as a button when not tilted.
- Mark the results immediately, while the plate is still in a tilted position, on a printed scheme of the 96-well plate. The agglutination patterns of the avian RBCs are shown in Figure 3.
- Readout of mammalian RBCs
- Mark the results on a printed scheme of the 96-well plate, without tilting the plate (horizontal position on the bench). NOTE: When hemagglutination occurs, the agglutinated cells do not settle to the bottom, whereas non-agglutinated cells appear as a halo at the bottom of the well. The halo of the partially agglutinated cells is less intense and has a larger diameter (Figure 3).
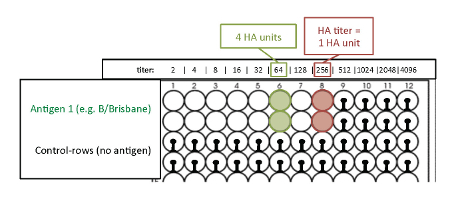
- Determination of 4 HA units. NOTE: The HA titration end point is the last well where complete hemagglutination occurs. This well contains 1 HA unit of virus. Because of the 2-fold dilutions of the antigen, two wells ahead of the HA titration endpoint is the well that contains 4 HA units of virus (Figure 4).
Figure 4: Readout of the HA titration with avian RBCs to determine the titer of 4 HA units. The optimal antigen amount required for hemagglutination is measured by the hemagglutination assay (antigen titration assay). The last well where complete hemagglutination occurs is the HA titration endpoint and contains 1 HA unit. Because of the 2-fold dilutions of the antigen, two wells ahead of the HA titration endpoint, the titer corresponds to 4 HA units. Please click here to view a larger version of this figure.
5. HI Assay
NOTE: The work-flow of the protocol has been optimized to allow a more efficient handling of multiple samples at the same time, by using PCR tube stripes and a thermo cycler (see below).
- Preparation of the Serum Samples NOTE: Prepare serum samples in a BSL-2 laboratory.
- Thaw the frozen serum samples of each time point of every person (see step 1.2) at room temperature.
- Add an aliquot of 10 µL of each thawed serum sample to a tube of a PCR tube strip (10-tubes in one strip). NOTE: The big advantage of using PCR tube strips is that a multichannel pipette can be used for the following steps in the HI assay; this saves a lot of time when testing a large amount of serum samples and when performing repeated measures of the same samples for antibody titers against different virus strains.
- Store the aliquoted serum samples in the PCR tube strips at -80 °C until use.
- One day before the HI assay is performed, thaw the serum sample aliquots of interest at room temperature.
- Add 10 µL of the appropriate anti-serum to an empty PCR tube. NOTE: To serve as a positive control, the anti-serum against a specific virus must match the used virus. The positive control allows for standardization of plate performance over multiple plates.
- Add 30 µL of cholera filtrate solution to each serum aliquot and to the anti-serum (3 volumes of cholera filtrate to 1 volume of serum) by using a multichannel pipette.
- Keep the PCR tubes in a PCR 96-well rack or an empty tip-box and vortex for 5 s.
- Incubate the samples overnight at 37 °C using a thermo cycler.
- Incubate the samples at 56 °C for 30 min to inactivate the cholera filtrate using a thermo cycler. NOTE: Depending on the thermo cycler, this step can be programmed to further automate the process.
- Keep the PCR tubes in a PCR 96-well rack or an empty tip-box and vortex for 5 s.
- Store the samples at 4 °C in the fridge until use for the HI assay.
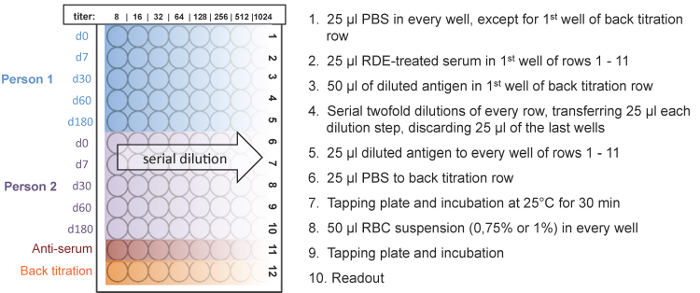
Figure 5: Plate design and workflow of the HI assay. Five time points of two people can be measured on one plate. The HI titer ranges from 8 to 1,024. An anti-serum of the used antigen served as a positive control and a back titration was performed to check if the antigen dilution equals 4 HA units. The serial dilution of the serum sample is shown for 2 individual vaccine recipients. Please click here to view a larger version of this figure.
- HI assay NOTE: For an illustration of the principle of the HI assay see Figure 1. Depending on the virus, different species of RBCs are used for the assay (Table 1). The different species of RBCs are used in various types of 96-well plates, and the incubation time as well as the appearance of the non-agglutinated cells differs (Table 2). For the HI assay, 4 HA units of virus or antigen are added to the 2-fold dilution series of the samples.
- Preparation of the antigen solution
- Calculate the volume of antigen solution needed according to the number of 96-well plates used (25 µL antigen per well × 96 = 2,400 µL antigen per 96-well plate; add 100 µL per plate extra due to the usage of a reservoir for the multichannel pipette; a total 2.5 mL of antigen per plate). NOTE: For example, if measuring 100 serum samples then 10 plates are needed (10 samples per plate): 2.5 mL x 10 = 25 mL of antigen solution needed in total.
- Prepare the proper dilution of 4 HA units for the calculated volume using PBS. NOTE: 4 HA units are determined for the HA assay. For the appropriate amount of antigen, divide the calculated volume by the titer corresponding to 4 HA units. For example, 4 HA units correspond to a dilution of 1/64, and we needed 15,000 µL of antigen solution are needed: 15,000/64 = 234.4 µL of the dissolved lyophilized influenza antigen are added.
- Preparation of the RBC suspension
- Calculate the volume of RBC suspension needed according to the number of 96-well micro titer plates used (50 µL RBC suspension per well × 96 = 4,800 µL RBC suspension per 96-well plate; add 200 µL per plate extra due to the usage of a reservoir for the multichannel pipette).
- Dilute the RBC stock suspension (normally 10%, v/v; except human type O) with PBS to make the proper concentrations for avian and mammalian RBCs of 0.75% and 1%, respectively.
- Preparation of the 96-well micro titer plate
- Label the 96-well micro titer plates (sample ID, positive control, and back titration). Please check the plate orientation in Figure 5 carefully.
- Add 25 µL of PBS to every well except to the first well of the "back titration" row (Figure 5, 12th row) using the multichannel pipette. NOTE: A back titration was performed to check if the used antigen dilution equals 4 HA units. An antigen titer of 4 HA units is indicated if hemagglutination occurs in the first three wells of the "back titration" row, but not in the fourth well.
- Add 50 µL of the prepared antigen solution (described in 5.2.1) to the first well of the "back titration" row (12th row).
- Add 25 µL of the RDE-treated serum samples to the first wells of rows 1 to 10 on each plate, using the multichannel pipette.
- Add 25 µL of the appropriate anti-serum to the first well of the 11th row as a positive control.
- Perform serial 2-fold dilutions by transferring 25 µL from the first well of each row (1 - 12) to successive wells by using a multichannel pipette. Mix by pipetting up and down 10 - 15 times for each dilution step. The same tips can be used for each dilution step per sample.
- Discard the final 25 µL of the last wells.
- Add 25 µL of the antigen solution by using a multichannel pipette to each well of rows 1 to 11 (serum samples and anti-serum). The same tips can be used if they do not touch the wells.
- Add 25 µL of PBS instead of antigen to each well of the "back titration" row (12th row).
- Tap the plate carefully 10 times on all four sides to mix.
- Cover the plate with a lid and incubate at room temperature for 30 min. Do not move the plate while incubating.
- Add 50 µL of the RBC suspension to every well.
- Tap the plate carefully 10 times on all 4 sides to mix.
- Cover the plate with a lid and incubate at room temperature for the appropriate amount of time depending on the RBC species used (see Table 2). Do not move the plate while incubating.
- Reading the plate NOTE: The HI titer is the reciprocal of the last dilution of (anti-) serum that completely inhibits hemagglutination. It is important to consider that the RDE-treated sera were already diluted 1:4 and after the serial dilution step, the sera in the first wells are diluted 1:8, which corresponds to a HI titer of 8.
- Readout of avian RBCs
- Tilt the plate 90° for 25 s. NOTE: Tilting the plate is crucial for the differentiation of avian patterns, because all three different types of agglutination patterns (completely agglutinated, partially agglutinated, and non-agglutinated) appear as a button when not tilted.
- Mark the results immediately, while the plate is still in a tilted position, on a printed scheme of the 96-well plate. The agglutination patterns of avian RBCs are shown in Figure 3.
- Readout of mammalian RBCs
- Mark the results on a printed scheme of the 96-well plate, without tilting the plate. NOTE: When hemagglutination occurs, the agglutinated cells do not settle down whereas non-agglutinated cells appear as a halo at the bottom of the well. The halo of the partially agglutinated cells is less intense and has a larger diameter (Figure 3).
- Determine the HI of each sample and transfer it to a computer-based table (Figure 6)
- NOTE: Partially agglutinated wells were determined as a lower titer. For example, if a serum sample completely inhibits hemagglutination up to the 4th well (1:64 dilution) and the 5th well (1:128 dilution) is partially agglutinated, then the HI titer is set to the lower titer 64 for the final analysis (Figure 6, 4th row).
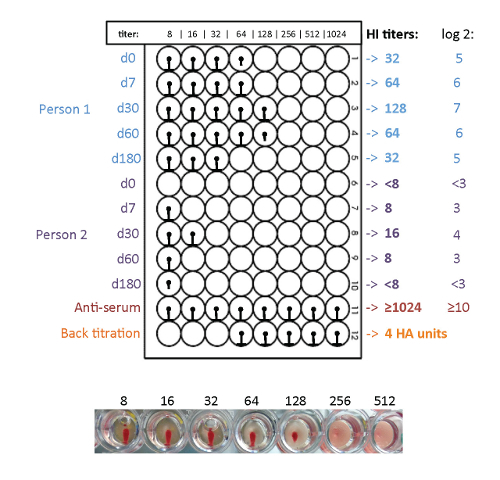
Figure 6: Readout of the HI assay with avian RBCs. The pre- and post-vaccination induced influenza specific antibody response is determined by HI assay. In this example, person one has higher HI titers than person two. Both persons show an antibody response after vaccination; 180 days after the vaccination the antibody titers of both persons are decreased again. Please click here to view a larger version of this figure.
Representative Results
Pre- and post-vaccination induced antibody response against Influenza A H3N2 The vaccine-induced antibody response was assessed in 26 healthy volunteers who received an inactivated trivalent subunit influenza vaccine containing Influenza A/H1N1/California/2009, A/H3N2/Texas/2012, and B/Massachusetts/02/2012 prior to the 2014/2015 influenza season. Figure 6 shows a representative example of 2 vaccine recipients. Interestingly, during that particular influenza season, A/H3N2/Texas/2012 was not circulating, and instead the season included the somewhat different viral strain: A/H3N2/Switzerland/2013. The viral hemagglutinin of A/H3N2/Texas/2012 and A/H3N2/Switzerland/2013 show 97% sequence identity and differ in only eleven amino acids (see Table 4), whose positions are highlighted in Figure 7.

Figure 7: Hemagglutinin comparison of A/H3N2 influenza strains. We compared the hemagglutinin of the viral strains A/Texas/50/2012 and A/Switzerland/9715293/2013. Since there are no hemagglutinin crystal structures of these strains, we used the crystal structure of the highly similar hemagglutinin of the influenza strain A/Victoria/361/201118, which shows 98% sequence identity with the Texas strain and 95% sequence identity with the Switzerland strain. The amino acid positions in which the Texas and Switzerland strains differ are highlighted. Please click here to view a larger version of this figure.
We observed a cross-reactive immune response for the viral strains A/H3N2/Switzerland/2013 and A/H3N2/Texas/2012. HI titers against Influenza A/H3N2/Switzerland/2013 were significantly lower in terms of geometric mean titers and induced seroprotection (Figure 8A) in comparison to Influenza A/H3N2/Texas/2012 (Figure 8B).

Figure 8: Geometric mean antibody-titers of healthy donors. The geometric mean antibody-titers (GMTs) of 25 healthy donors pre- and post-vaccination are determined using two different antigens. The mean titers of A/H3N2/Switzerland/2013 (A) and A/H3N2/Texas/2012 (B) are shown. An immune response due to the vaccination can be observed as increasing titers after the vaccination (d7-d60), compared to the GMTs before the vaccination (d0). 180 days after the vaccination, the GMTs decrease again. Of note, only A/H3N2/Texas/2012 (which was in the vaccine) reaches protective titers. Bars indicate geometric mean titers, and whiskers indicate the 95% confidence intervals. The dashed line indicates the seroprotection threshold. The % of seroprotected people (titer >1:40) is shown in the graph. Please click here to view a larger version of this figure.
After vaccination, the antibody titers against A/H3N2/Texas/2012 increased in most subjects; although the A/H3N2/Switzerland/2013 strain was not present in the vaccine, the titer against A/H3N2/Switzerland/2013 increased in some subjects as well. Figure 9 shows the correlation between both titers over all time points with an R2 of 0.745 for a linear regression model. As one would expect, the induction of the antibody response against A/H3N2/Switzerland/2013 was less potent.
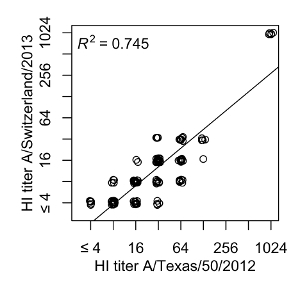
Figure 9: Cross-reaction between A/H3N2 influenza strains. The A/H3N2/Texas titers of every individual and time point are plotted against the corresponding A/H3N2/Switzerland titers. A linear regression model shows an R2 of 0.745. Please click here to view a larger version of this figure.
Hemagglutination potential is based on the type of blood used The viral hemagglutinin shows different species-dependent potential to hemagglutinate erythrocytes. This species-dependent effect also impacts the hemagglutination inhibition assay. To improve the specificity of measured anti-viral titers, we evaluated the best suited type of erythrocytes for five viral antigens (Influenza B/Brisbane/60/2008 and B/Massachusetts/02/2012, Influenza A/H1N1/California/2009, A/H3N2/Texas/2012, and A/H3N2/Switzerland/2013) to achieve the maximum hemagglutination but also the lowest cross-reactivity. We used positive control sera from the National Institute for Biological Standards and Control (NIBSC) against each antigen to perform these assays.
For Influenza B, we could observe that the B/Massachusetts/02/2012 induced antibody response does not provide protection against B/Brisbane/60/2008. In contrast, antibodies against B/Brisbane/60/2008 showed cross-reactivity against B/Massachusetts/02/2012 at a 4-fold lower titer across different erythrocytes (see Table 3). Of interest, guinea pig blood did not properly hemagglutinate with Influenza B. Turkey blood did best in showing the potential to hemagglutinate and the highest titers with relative low cross-reactivity apart from the previously mentioned A/H3N2/Texas and /Switzerland strains.
| Turkey | Guinea Pig | Chicken | Human type O | |
| B/Brisbane | 1024 | - | 1024 | 1024 |
| B/Massachusetts | 1024 | 384 | 768 | 1024 |
| A/H3N2/Switzerland | 1024 | 1024 | - | 1024 |
| A/H3N2/Texas | 1024 | 1024 | 512 | 1024 |
| A/H1N1/California | 1024 | 1024 | 768 | 768 |
Table 3: Positive control titers against the respective influenza HA antigen across different species.
| No | A/H3N2/Texas/2012 strain | A/H3N2/Switzerland/2013 strain | Position |
| 1 | Asparagine (N) | Alanine (A) | 128 |
| 2 | Alanine (A) | Serine (S) | 138 |
| 3 | Isoleucine (I) | Arginine (R) | 140 |
| 4 | Arginine (R) | Glycine (G) | 142 |
| 5 | Asparagine (N) | Serine (S) | 145 |
| 6 | Phenylalanine (F) | Serine (S) | 159 |
| 7 | Glycine (G) | Valine (V) | 186 |
| 8 | Proline (P) | Serine (S) | 198 |
| 9 | Serine (S) | Phenylalanine (F) | 219 |
| 10 | Asparagine (N) | Aspartate (D) | 225 |
| 11* | Lysine (K) | Arginine (R) | 326 |
| *not shown in the crystal structure in Figure 8, because the hemagglutinin was cutted at residue 325. |
Table 4: List of different amino acids of hemagglutinin between A/H3N2/Texas/2012 and A/H3N2/Switzerland/2013 strains
Discussion
Quantification of pre- and post-vaccination influenza virus specific antibody titers is an important tool necessary for vaccine studies. Based on the surrogate measures of protection against virus infection, such as seroprotection (>1:40) or seroconversion (4-fold titer increase), vaccination strategies can be optimized9. Using the provided protocols can determine: (i) the hemagglutination potential of a particular virus, and (ii) the antibody titers for a virus of interest.
Modification and Troubleshooting:
This protocol is based on the WHO standard12. We modified the protocol by using PCR tube strips for serum preparations (see step 5). This modification helped to significantly reduce the workload and to increase the throughput of the assay. Further, we reduced the antigen amount by one fourth in the antigen titration step, which is cost effective overtime. A lower amount of serum (10 µL) can be used for the RDE treatment, which helps especially when the sample amount is limited (e.g., mouse sera). The back titration and positive control are included in the antibody measurement plate to serve as a proper internal control and to monitor the aging of erythrocytes.
In addition, we used different erythrocyte concentrations than those in the WHO standard12 to set the optimal size of the erythrocyte clot for a good visual readout. To guarantee this we suggest checking the erythrocyte concentration before the assay. Although, we have not optimized this part in our protocol, methods such as absorbance measurement with OD or cell counting could be used.
If the RDE is not completely inactivated, RBCs can be desialylated and reverse HA-positive wells when hemagglutination is measured at room temperature. Although we never observed this problem, in this case, we suggest performing the HI at 4 °C, since RDE activity is significantly lower at 4 °C. However, performing the HI assay at 4 °C is slower.
Limitations of the Technique:
A few critical aspects of the HI assay include the following points: Interestingly, the hemagglutination is strongly dependent on the particular type of erythrocyte (e.g., turkey or guinea pig RBC). The optimal type of blood should be tested before a particular virus strain is evaluated and the same type of blood should be used throughout the assay. Although the induction of cross-reactivity between viruses may generate an immunological advantage in the case of a slightly new virus19,20, this may cause some problems from a diagnostic point of view due to low specificity. Therefore, cross reactivity between similar viruses should be carefully addressed and discussed in studies. By choosing erythrocytes from a specific species, the amount of cross-reactivity can be somewhat lowered.
Significance with Respect to Existing Methods:
The HI is a well-established gold standard method providing highly reproducible and reliable results. Other techniques such as ELISA may detect non-neutralizing antibodies, whereas the HI only detects antibodies which bind to the HA stem loop and thereby correlate with neutralization.
Critical Steps Within the Protocol:
The most critical steps include the serum treatment with RDE to inactivate unspecific inhibitors and binding to the HA of the virus. Another critical step is to control for hemolysis of the erythrocytes as they age over time.
Future Applications:
The protocol may be used for other viruses with hemagglutination potential. Although we have only shown results on human sera samples here, the assay can also be used to measure antibody titers in mouse sera or in cell culture supernatant with stimulated B-cells (data not shown). In summary, the HI allows a rapid and reproducible assessment of vaccine-induced antibody titers.
Disclosures
A.E. was supported by a research grants from the "SNSF Ambizione Score" program (PZ00P3_154709), "Forschungsfond, Förderung strategischer Projekte" University of Basel, Stiftungsinfektionskrankheiten Basel, and Bangeter Rhyner Stiftung. L.K. was supported by a grant of the Technical University of Graz, Austria. J.L. acknowledges support by an iPhD fellowship of the SystemsX.ch initiative in systems biology program (9th call).
Acknowledgments
none.
References
- MMWR Recomm Rep. Vol. 62. Centers for Disease, C. & Prevention; 2013. Prevention and control of seasonal influenza with vaccines. Recommendations of the Advisory Committee on Immunization Practices--United States, 2013-2014; pp. 1–43. RR-07. [PubMed] [Google Scholar]
- Dominguez-Cherit G, et al. Critically Ill patients with 2009 influenza A(H1N1) in Mexico. JAMA. 2009;302(17):1880–1887. doi: 10.1001/jama.2009.1536. [DOI] [PubMed] [Google Scholar]
- Fox BD, et al. Pandemic influenza (H1N1): impact on lung transplant recipients and candidates. J Heart Lung Transplant. 2010;29(9):1034–1038. doi: 10.1016/j.healun.2010.05.007. [DOI] [PubMed] [Google Scholar]
- Piercy J, Miles A, Krankheiten SBfGSV, Values M. The Economic Impact of Influenza in Switzerland: Interpandemic Situation. Swiss Federal Office of Public Health, Division of Epidemiology and Infectious Diseases, Section of Viral Diseases and Sentinel Systems; 2003. [Google Scholar]
- Barclay VC, et al. Positive network assortativity of influenza vaccination at a high school: implications for outbreak risk and herd immunity. PLoS One. 2014;9(2):87042. doi: 10.1371/journal.pone.0087042. [DOI] [PMC free article] [PubMed] [Google Scholar]
- Baluch A, et al. Randomized controlled trial of high-dose intradermal versus standard-dose intramuscular influenza vaccine in organ transplant recipients. Am J Transplant. 2013;13(4):1026–1033. doi: 10.1111/ajt.12149. [DOI] [PubMed] [Google Scholar]
- Haralambieva IH, et al. The Impact of Immunosenescence on Humoral Immune Response Variation after Influenza A/H1N1 Vaccination in Older Subjects. PLoS One. 2015;10(3):0122282. doi: 10.1371/journal.pone.0122282. [DOI] [PMC free article] [PubMed] [Google Scholar]
- Egli A, et al. Vaccine adjuvants--understanding molecular mechanisms to improve vaccines. Swiss Med Wkly. 2014;144:13940. doi: 10.4414/smw.2014.13940. [DOI] [PubMed] [Google Scholar]
- O'Shea D, Widmer LA, Stelling J, Egli A. Changing face of vaccination in immunocompromised hosts. Curr Infect Dis Rep. 2014;16(9):420. doi: 10.1007/s11908-014-0420-2. [DOI] [PubMed] [Google Scholar]
- Meulemans G, Carlier MC, Gonze M, Petit P. Comparison of hemagglutination-inhibition, agar gel precipitin, and enzyme-linked immunosorbent assay for measuring antibodies against influenza viruses in chickens. Avian Dis. 1987;31(3):560–563. [PubMed] [Google Scholar]
- Martins TB. Development of internal controls for the Luminex instrument as part of a multiplex seven-analyte viral respiratory antibody profile. Clin Diagn Lab Immunol. 2002;9(1):41–45. doi: 10.1128/CDLI.9.1.41-45.2002. [DOI] [PMC free article] [PubMed] [Google Scholar]
- Webster R, Cox N, Stöhr K. WHO Animal Influenza Manual. WHO/CDS/CSR/NCS. 2002;2002.5:1–99. [Google Scholar]
- Mittelholzer CM, et al. Human cell lines used in a micro neutralization test for measuring influenza-neutralizing antibodies. Scand J Immunol. 2006;63(4):257–263. doi: 10.1111/j.1365-3083.2006.01740.x. [DOI] [PubMed] [Google Scholar]
- Hamilton RS, Gravell M, Major EO. Comparison of antibody titers determined by hemagglutination inhibition and enzyme immunoassay for JC virus and BK virus. J Clin Microbiol. 2000;38(1):105–109. doi: 10.1128/jcm.38.1.105-109.2000. [DOI] [PMC free article] [PubMed] [Google Scholar]
- Kumakura S, et al. Comparison of hemagglutination inhibition assay and enzyme immunoassay for determination of mumps and rubella immune status in health care personnel. J Clin Lab Anal. 2013;27(5):418–421. doi: 10.1002/jcla.21621. [DOI] [PMC free article] [PubMed] [Google Scholar]
- Ogundiji OT, Okonko IO, Adu FD. Determination of measles hemagglutination inhibiting antibody levels among school children in Ibadan, Nigeria. J Immunoassay Immunochem. 2013;34(2):208–217. doi: 10.1080/15321819.2012.699496. [DOI] [PubMed] [Google Scholar]
- Cwach KT, Sandbulte HR, Klonoski JM, Huber VC. Contribution of murine innate serum inhibitors toward interference within influenza virus immune assay. Influenza Other Respir Viruses. 2012;6(2):127–135. doi: 10.1111/j.1750-2659.2011.00283.x. [DOI] [PMC free article] [PubMed] [Google Scholar]
- Lee PS, et al. Receptor mimicry by antibody F045-092 facilitates universal binding to the H3 subtype of influenza virus. Nat Commun. 2014;5:3614. doi: 10.1038/ncomms4614. [DOI] [PMC free article] [PubMed] [Google Scholar]
- Blumel B, et al. Age-related prevalence of cross-reactive antibodies against influenza A(H3N2) variant virus, Germany, 2003 to 2010. Euro Surveill. 2015;20(32):16–24. [PubMed] [Google Scholar]
- Reber AJ, et al. Seasonal Influenza Vaccination of Children Induces Humoral and Cell-Mediated Immunity Beyond the Current Season: Cross-reactivity with Past and Future Strains. J Infect Dis. 2016. [DOI] [PMC free article] [PubMed]


