Abstract
The wound-healing assay is efficient and one of the most economical ways to study cell migration in vitro. Conventionally, images are taken at the beginning and end of an experiment using a phase-contrast microscope, and the migration abilities of cells are evaluated by the closure of wounds. However, cell movement is a dynamic phenomenon, and a conventional method does not allow for tracking single-cell movement. To improve current wound-healing assays, we use live-cell imaging techniques to monitor cell migration in real time. This method allows us to determine the cell migration rate based on a cell tracking system and provides a clearer distinction between cell migration and cell proliferation. Here, we demonstrate the use of live-cell imaging in wound-healing assays to study the different migration abilities of breast epithelial cells influenced by the presence of TIP60. As cell motility is highly dynamic, our method provides more insights into the processes of wound healing than a snapshot of wound closure taken with the traditional imaging techniques used for wound-healing assays.
Keywords: Cancer Research, Issue 130, Live-cell imaging, cell migration, wound healing, TIP60, transient depletion, MCF10A
Introduction
HIV-Tat-interactive protein 60 kDa (TIP60) is a lysine acetyltransferase that can acetylate both histone and non-histone proteins1,2. Its functions are found to have implications in multiple signaling pathways, including transcription, DNA-damage repair, and apoptosis1,3,4,5,6,7,8. Furthermore, TIP60 is often downregulated in cancers, and its downregulation is correlated with cancer metastasis and poor survival rates9,10,11,12,13,14. Tumor metastasis is the major cause of cancer-related death. It is a multi-step process, and the initial step of metastasis involves the migration and invasion of tumor cells into adjacent tissues15,16. In order to do so, tumor cells first must detach from the primary tumor mass, either in the form of a collectively invading cell sheet or as detached single cells17. During this process, tumor cells often undergo epithelial to mesenchymal transition (EMT), resulting in changes in morphology and cell adhesion capability17,18.
A few techniques have been developed to study the migration and invasion ability of tumor cells in vitro. Among them, the wound-healing assay is the most efficient and economical19. First, this method involves the creation of an artificial gap on a confluent monolayer of cells, thus allowing cells to migrate and close the gap. Second, images of the gaps can be captured at the beginning and end of the experiment. Finally, a comparison of gap closure is used to determine the rate of cell migration. A phase-contrast microscope is usually used to capture images for conventional wound-healing assays. Another advantage of the wound-healing assay is that it partly resembles in vivo tumor cell migration. Similarly to in vivo tumor metastasis, cell migration in wound-healing assays shows both the collective migration of epithelial sheets and the migration of detached single cells.
However, cell migration is known to be dynamic, and there is a need to document the movement of cells in real time. For instance, a conventional wound-healing assay does not allow a researcher to analyze single-cell movement. On the other hand, cells cultured for wound-healing assays are often serum-starved to inhibit cell proliferation. This is done to rule out the possibility of gap closure due to cell proliferation. Nonetheless, there will still be some proliferation and cell death, and phase-contrast images taken before and after the experiment are unable to differentiate between them.
The live-cell imaging technique addresses this limitation of conventional wound-healing assays. Using a live-imaging microscope combined with a CO2 incubator and appropriate temperature control, researchers can measure the gap size and its rate of closure over time while tracing the movement of actively migrating cells located at the tips of the invasive front. Hence, the implementation of live-cell imaging to monitor cell migration will not only provide better visualization of cell migration, but will also allow for the possibility to differentiate between cell migration and cell proliferation, thus providing a more reliable analysis of cell migration.
In this study, MCF10A breast epithelial cells were used to demonstrate the combination of the wound-healing assay and live-cell imaging to study the role of TIP60 in cell migration. The depletion of TIP60 results in increased migration abilities in MCF10A cells.
Protocol
1. Preparation
Prepare MCF10A culture medium: Dulbecco's Modified Eagle Medium (DMEM)/F12 (1:1) with 5% horse serum, 20 ng/mL epithelial growth factor, 0.5 mg/mL hydrocortisone, 100 ng/mL cholera toxin, and 10 µg/mL insulin.
Prepare serum-free medium: DMEM/F12 (1:1) with 20 ng/mL epithelial growth factor, 0.5 mg/mL hydrocortisone, 100 ng/mL cholera toxin, and 10 µg/mL insulin.
Use the following siRNA sequence: siControl: Forward: 5'-CGUACGCGGAAUACUUCGAdTdT-3' Reverse: 5'-UCGAAGUAUUCCGCGUACGdTdT-3' siTIP60: Forward: 5'-UGAUCGAGUUCAGCUAUGAdTdT-3' Reverse: 5'-UCAUAGCUGAACUCGAUCAdTdT-3'
Use 10-cm cell culture dishes and 24-well plates.
2. Transient Depletion of TIP60 Using siRNA
On day 1, aliquot 15 µL of transfection reagent (e.g., Lipofectamine RNAiMAX) and 2 mL of reduced serum medium (e.g., Opti-MEM) and mix them with 10 µL of each siRNA (10 µM stock), respectively.
Incubate the mixture at room temperature for 20 min.
Seed 1 x 10⁶ MCF10A cells together with 3 mL of culture medium in a 10 cm dish. Count the cells using a hemocytometer.
Add the siRNA mixture drop by drop to the 10 cm dish.
Shake the dish to ensure that the cells are equally distributed before putting it into the 37 °C incubator.
After 6 h of incubation, replace the siRNA-containing medium with 8 mL of fresh culture medium.
On day 2, prepare another batch of siRNA mixtures and incubate them at room temperature for 20 min.
Aspirate out 8 mL of the culture medium added on day 1 and replace it with 3 mL of fresh culture medium.
Add the second batch of siRNA mixture to the dishes drop by drop. Shake the dishes to ensure that the reagents are fully mixed before putting them into the incubator.
After 6 h, replace the siRNA-containing medium with 8 mL of fresh culture medium.
3. Seed Cells for the Wound-healing Assay
On day 3, discard the medium and wash the cells once with 2 mL of phosphate-buffered saline (PBS) buffer. Discard the PBS buffer.
Trypsinize the siControl and siTIP60-treated cells by adding 1 mL of 1x trypsin-EDTA buffer to the plate. Put it back in the incubator for 20 min.
Add 4 mL of complete culture medium to each plate, resuspend the cells by pipetting, and transfer them to a 15-mL tube.
Centrifuge at 200 g for 5 min and remove the supernatant.
Re-suspend the cells with 5 mL of serum-free medium and count the cells using a hemocytometer.
Prepare a cell suspension of 6 x 10⁵ cells/mL for both the siControl and siTIP60; ensure that the cells are well-mixed. Add 500 µL of the cell suspension to one well of a 24-well plate to ensure 100% confluency. Seed 5 to 6 wells each for siControl and siTIP60.
Gently shake the plate back and forth and then side-to-side to ensure even distribution. Avoid a circular motion. Leave the plate in the incubator for 24 h.
Harvest the remaining cells to check the knockdown efficiency of TIP60. To do so, centrifuge the remaining cell suspension at 200 g for 5 min and remove the supernatant.
Isolate RNA using a commercial reagent, following the manufacturer's protocol, and proceed to real-time quantitative PCR to evaluate the knockdown efficiency.
4. Create the Wound
Check under a phase contrast microscope to ensure that the cells are fully attached. Observe the cells under the microscope (4X, 10X, and 20X magnification) to ensure that the cells are fully attached that a confluent monolayer of cells has formed. NOTE: siControl cells usually attach better than siTIP60 cells. This is expected because the depletion of TIP60 makes the cells more mesenchymal-like20. Here, a normal benchtop white-light phase contrast microscope is used.
To generate the wound, gently scratch a straight line across the center of the well with a 200 µL pipette tip; the length of the wound generated is same as the diameter of the well. Repeat this step for all remaining wells. Use a new pipette tip for each well.
Gently wash each well 5 times using serum-free medium to remove the detached cells.
Add 1 mL of serum-free medium to each well and proceed to live-cell imaging.
5. Setup of Live-cell Imaging
Turn on the microscope and the temperature control at least 1 h before setting up live-cell imaging to ensure that the temperature in the chamber reaches 37 °C.
Turn on the carbon dioxide (CO2) gas supply before starting the live-cell imaging. Set the CO2 concentration to 5%.
Place the 24-well plate on the stage of the microscope and select the objective lens with 10X magnification for imaging. Direct the emitted light to the eyepieces instead of the camera and adjust the focus to locate the wound and the cells around it. NOTE: In this case, white light with phase contrast was used.
Use a live-cell observer system to mark the position of the wound in each well. NOTE: The automated stage of the live-cell imaging system allows for image acquisition at multiple positions. Images are taken on every marked position once every interval.
Set up the time condition: 1 h interval and 72 h duration; according to this setting, the system will take pictures at each marked position every hour for 72 h. Set up any desired time interval and period for monitoring. NOTE: Here, a duration of 72 h is best because these cells start dying after 72 h in serum-free medium.
6. Tracking Single-cell Movement
Export the data after 72 h. Export the data both as images in JPEG format and as videos in AVI format. NOTE: This is important because ImageJ software can only recognize videos in AVI format. The different cell migration speeds between siTIP60 and siControl cells can be clearly observed in the video.
Open the AVI video in the ImageJ software.
Open the MTrackJ plugin (the plugin must be downloaded and installed separately): Plugins > MtrackJ.
Add a track for single cells chosen from the video by clicking the "Add" tab in the MtrackJ toolbar. Choose a cell at the tip of the invasive front and a cell that can migrate on its own (single-cell migration). Follow the movement of the chosen cells on the video and trace them using MtrackJ.
Measure the distance of movement by clicking the "measure" tab on the toolbar. NOTE: Here, almost no cells in the siControl moved as single cells, making it difficult to measure single-cell movement, whereas many of the siTIP60 cells moved as single cells. However, the movement of cells located at the invasive front can still be traced and calculated in both siControl and siTIP60 cells.
Save the video with the tracks in AVI format.
7. Quantification of Cell Migration Ability
For quantification, select images at 0 h and images at "n" h, where "n" refers to the timepoint when either the siTIP60 or siControl cells have completely closed the wound. NOTE: Here, 48 h was chosen, as the wounds in siTIP60 cells were almost completely closed.
Quantify the percent migration using ImageJ using the following formula: (area of wound at 0 h - area of wound at "n" h) / area of wound at 0 h x 100.
Representative Results
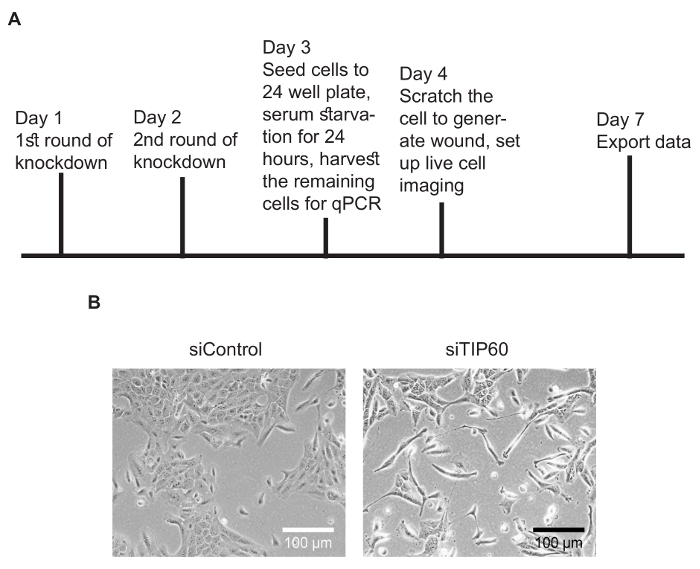
General Schema of Live-cell Imaging-based Cell Migration AssayFigure 1A is a schema of this protocol. MCF10A cells transfected with siControl showed typical epithelial morphology. After the depletion of TIP60, MCF10A cells were more mesenchymal compared to control cells (Figure 1B).
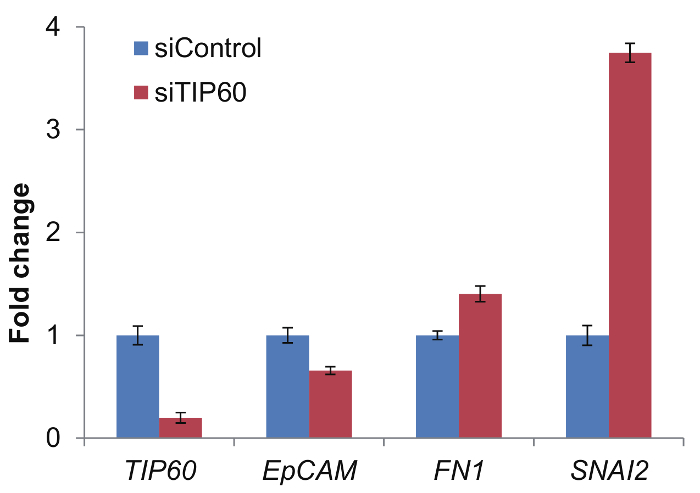
Examination of TIP60 Knockdown EfficiencyFigure 2 shows the TIP60 knockdown efficiency. The TIP60 expression level decreased significantly after siTIP60 treatment. In addition to TIP60, the expressions of several cell migration-related proteins were also examined20. For example, the expression of epithelial adhesion molecule (EpCAM), which is an epithelial marker, was decreased, whereas the expressions of Fibronectin (FN1) and SNAIL2 (SNAI2), which are both EMT drivers, were increased upon depletion of TIP60. These data suggest that the TIP60 levels in the MCF10A cells used for live-cell imaging were sufficiently reduced.
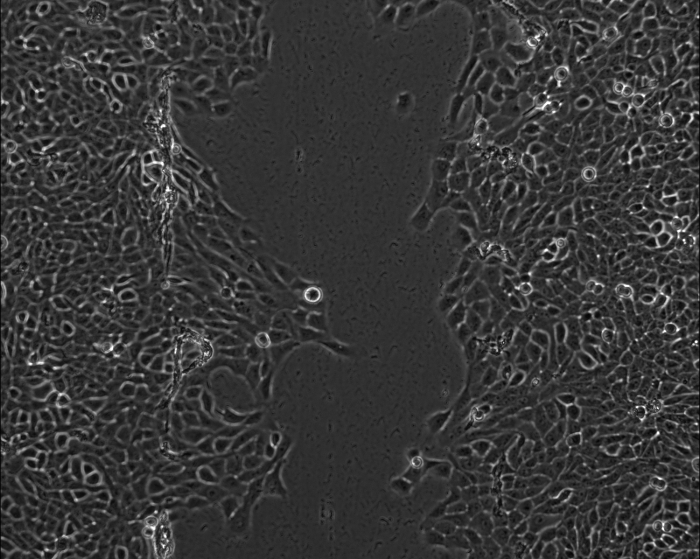
Depletion of TIP60 Changes the Dynamic of Cell MigrationFigure 3 shows the videos taken for siControl and siTIP60 cells. The videos clearly show a faster cell migration of siTIP60 compared to siControl. Other than this, a difference in the dynamic of cell migration between siControl and siTIP60 cells was also observed (i.e., siControl cells moved as a sheet, whereas more single-cell movement was observed in siTIP60 cells).
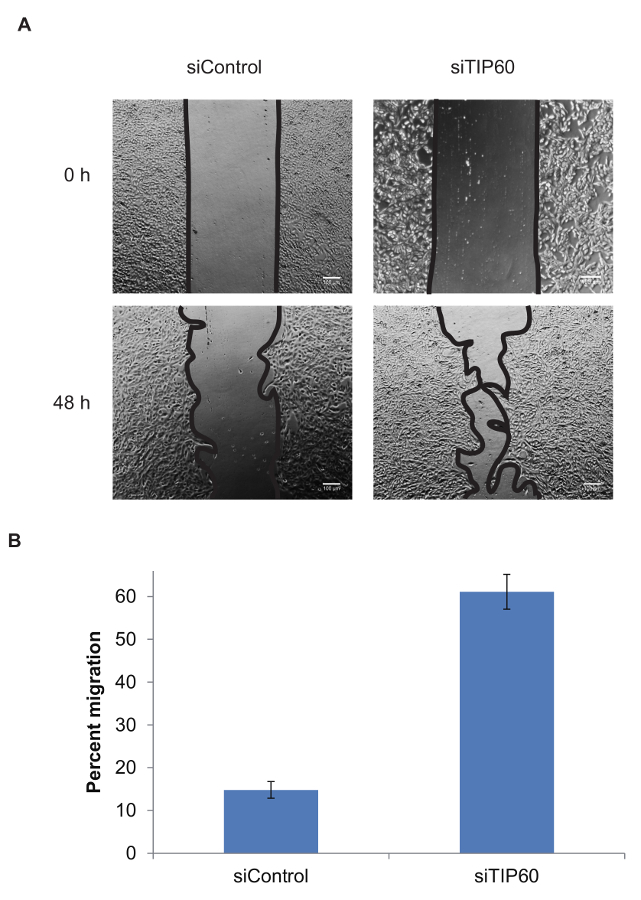
Increase in Cell Migration after TIP60 KnockdownFigure 4 shows the quantification of cell migration for siControl and siTIP60 cells. The percentage of migrated cells increased significantly after the depletion of TIP60.
TIP60 Depletion Changes the Pattern of Cell MigrationFigure 5 shows videos tracking single-cell movement. Most of the siControl cells collectively migrated as part of cell sheets, and only two cells showed single-cell migration, whereas most siTIP60 cells showed single-cell migration. The changes in the pattern of cell migration indicate that cells with depleted TIP60 have a more mesenchymal phenotype.
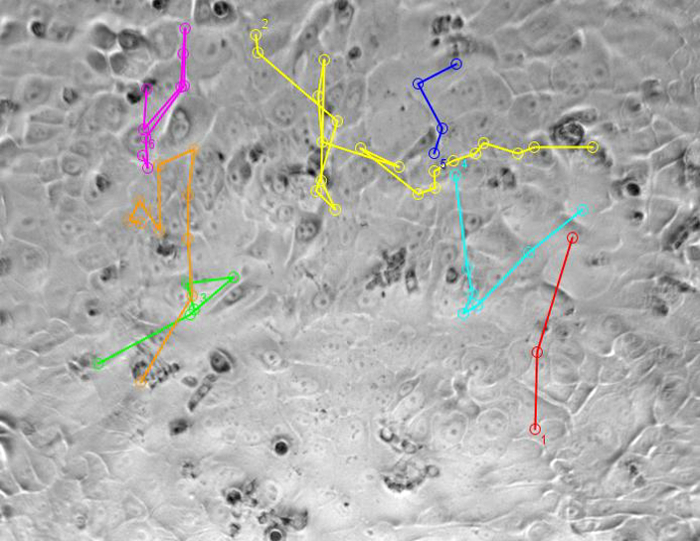
Figure 1: Experimental overview and representative images. (A) Schema of the protocol. (B) Representative images of MCF10A cells transfected with siControl or siTIP60. MCF10A cells show a more mesenchymal morphology after the depletion of TIP60. Please click here to view a larger version of this figure.
Figure 2: TIP60 was efficiently depleted after siTIP60 transfection. Real-time quantitative PCR was used to check the expression level of TIP60, EpCAM, FN1, and SNAI2. The total RNA was isolated using Trizol reagent following the manufacture's protocol. 2 µg of the total RNA of each sample was used to make cDNA. The results are represented as the fold-change. Actin was used as an internal control. Error bar indicates the standard deviation from at least 3 independent experiments. Please click here to view a larger version of this figure.
Figure 3: Live-cell imaging videos of siControl and siTIP60 cells show different patterns of cell movement. The time interval was set to 1 h and the duration was to 72 h. The video was taken using a Zeiss live-cell observer. Please click here to download these videos.
Figure 4: Quantification of the percentage of cell migration. (A) Representative images were obtained from live-cell imaging videos. Pictures taken at 0 h and 48 h were used. (B) Quantification of the percentage of cell migration within 48 h was done using ImageJ software using the following formula: (area of wound at 0 h - area of wound at "n" h) / area of wound at 0 h x 100. The error bar indicates the standard deviation from at least three independent experiments. Please click here to view a larger version of this figure.
Figure 5: Live-cell imaging videos show the tracking of single-cell movement. The colored lines show the migratory track of each selected isolated single cell. Please click here to download these videos.
Discussion
It is known that in the process of cell migration, cells can either move in the form of adherent sheets; loose clusters; or single, isolated cells. The mode and dynamic of cell invasion can vary from one condition to another, and the phenotype can change within hours. The traditional wound-healing assay is based on snapshot pictures taken from a microscope with a long time interval, such as 12 or 24 h. This makes it difficult to capture the dynamic of wound closure and the pattern of cell movements.
On the other hand, live-cell imaging systems monitor cell migration over a much shorter interval (30 min or 1 h) and at the exact same position, which is not feasible for images taken manually. The system is automated, and researchers only need to export the data at the end of the experiments. This makes it possible to monitor the pattern of cell movement and the process of wound closure in real time. In this study, the incorporation of a quantitative live-cell imaging system in wound-healing assays allows for the capture of dynamic cell movement, as well as the process of wound closure in control or TIP60-depleted cells. From the video taken using a live-cell imaging system, most of the siControl cells moved as an adherent sheet, whereas TIP60-depleted cells moved as isolated single cells (Figure 3 and Figure 5).
Cell proliferation and cell death might complicate the study of cell migration in a wound-healing assay. Therefore, the wound-healing assay is performed in serum-free medium to minimize the effect of cell proliferation. Also, the knockdown of TIP60 was optimized to reduce its impact on cell survival. However, it is impossible to eliminate the influences of cell proliferation and cell death in wound-healing assays. The snapshots can only capture wound closure at a certain time point, making it impossible to distinguish whether the wound closure was due to cell migration or cell proliferation. Live-cell imaging monitors the dynamics of cell migration and tracks individual cell movement, making it possible for researchers to distinguish cell migration from cell proliferation and cell death. In this study, single-cell tracking revealed the migration path of the isolated single cells in the siTIP60 condition, while siControl cells mostly moved in the form of sheets. The live-cell imaging system also captured an increase in collective cell migration (i.e., the cells migrated as a cohesive group) in siTIP60 cells compared to siControl cells. From the videos, MCF10A siTIP60 showed more single-cell movements and faster migration of epithelial cell sheets compared to siControl (Figure 5).
Various parameters used in this protocol need to be optimized to avoid experimental failure. First, the number of cell deaths after transient transfection should be less than 10% to minimize the effect on cell migration. In this case, the depletion of TIP60 may reduce cell survival; hence, researchers should be aware of this potential phenotype, as it may complicate cell migration. To avoid this problem, researchers should optimize the cell number and amount of siRNA used to deplete their target gene. For MCF10A, 1 x 10⁶ cells with 20 nM siTIP60 was the optimized condition in this study. Second, MCF10A cells are often clustered and difficult to count. Errors in cell counts may lead to a significant difference in initial cell numbers across different conditions, and this could be a confounding variable in wound-healing assays. To avoid this problem, trypsinize MCF10A cells for at least 20 min. Add complete growth medium to stop the trypsinization and mix by pipetting up and down 20 times to disperse the clumps and to make it easier to count. Third, cells are usually in the center of the well after being seeded to the 24-well plate. Re-suspend the cells after seeding to ensure an even distribution. Shake the plate back and forth and side to side before putting it into the incubator. Fourth, the depletion of TIP60 makes the cell more mesenchymal and thus harder to attach. If this happens, leave the plate in the incubator for a longer period of time. After 24 h, the cells are usually attached. If the cells are still not properly attached, researchers could use complete growth medium for cell seeding and replace it with serum-free medium when the cells are fully attached. These cells are usually attached after 12 h in complete medium. Fifth, the edge of the wound may not be smooth. Increase the speed of scratching to create smooth edges. Sixth, the wound may be too big to visualize through the camera of the microscope. Use 200 µL pipette tips with less strength to generate the wound. Alternatively, a needle can be used to generate a smaller gap. Seventh, some cells that are detached during scratching may re-attach to the wound due to insufficient washes. Wash the wells with serum-free medium instead of PBS at least 5 times. Eighth, cells may start to detach from the plate after a few washes. However, the number of washes cannot be compromised in order to ensure that detached cells do not re-attach to the wound. In this case, researchers can wash the cells gently 3 times and leave the plate inside the incubator for a maximum time of 1 h to let the cells settle down before proceeding to the rest of the washes. Ninth, the microscope may lose focus, and the images may become blurry halfway through the experiment. A change in temperature around the microscope may be the reason, as temperature has a minor effect on the adjusted stage distance. Researchers should turn on the microscope and temperature control at least 1 h before starting the experiment to ensure that the incubator is warmed up before adjusting the focus on cells.
Disclosures
The authors declare that they have no competing financial interests.
Acknowledgments
We thank the members of the Jha laboratory for their helpful discussion and comments. S.J. was supported by grants from the National Research Foundation Singapore and the Singapore Ministry of Education under its Research Centers of Excellence initiative to the Cancer Science Institute of Singapore (R-713-006-014-271), the National Medical Research Council (CBRG-NIG; BNIG11nov001 and CS-IRG; R-713-000-162-511), the Ministry of Education Academic Research Fund (MOE AcRF Tier 1 T1-2012 Oct -04). Y.Z., G.S.C., and C.Y.T. were supported by a post-graduate fellowship awarded by the Cancer Science Institute of Singapore, National University of Singapore.
References
- Sun Y, Jiang X, Chen S, Fernandes N, Price BD. A role for the Tip60 histone acetyltransferase in the acetylation and activation of ATM. Proc Natl Acad Sci U S A. 2005;102(37):13182–13187. doi: 10.1073/pnas.0504211102. [DOI] [PMC free article] [PubMed] [Google Scholar]
- Sykes SM, Stanek TJ, Frank A, Murphy ME, McMahon SB. Acetylation of the DNA binding domain regulates transcription-independent apoptosis by p53. J Biol Chem. 2009;284(30):20197–20205. doi: 10.1074/jbc.M109.026096. [DOI] [PMC free article] [PubMed] [Google Scholar]
- Jha S, Shibata E, Dutta A. Human Rvb1/Tip49 is required for the histone acetyltransferase activity of Tip60/NuA4 and for the downregulation of phosphorylation on H2AX after DNA damage. Mol Cell Biol. 2008;28(8):2690–2700. doi: 10.1128/MCB.01983-07. [DOI] [PMC free article] [PubMed] [Google Scholar]
- Sapountzi V, Logan IR, Robson CN. Cellular functions of TIP60. Int J Biochem Cell Biol. 2006;38(9):1496–1509. doi: 10.1016/j.biocel.2006.03.003. [DOI] [PubMed] [Google Scholar]
- Squatrito M, Gorrini C, Amati B. Tip60 in DNA damage response and growth control: many tricks in one HAT. Trends Cell Biol. 2006;16(9):433–442. doi: 10.1016/j.tcb.2006.07.007. [DOI] [PubMed] [Google Scholar]
- Sun Y, Xu Y, Roy K, Price BD. DNA damage-induced acetylation of lysine 3016 of ATM activates ATM kinase activity. Mol Cell Biol. 2007;27(24):8502–8509. doi: 10.1128/MCB.01382-07. [DOI] [PMC free article] [PubMed] [Google Scholar]
- Sykes SM, et al. Acetylation of the p53 DNA-binding domain regulates apoptosis induction. Mol Cell. 2006;24(6):841–851. doi: 10.1016/j.molcel.2006.11.026. [DOI] [PMC free article] [PubMed] [Google Scholar]
- Tang Y, Luo J, Zhang W, Gu W. Tip60-dependent acetylation of p53 modulates the decision between cell-cycle arrest and apoptosis. Mol Cell. 2006;24(6):827–839. doi: 10.1016/j.molcel.2006.11.021. [DOI] [PubMed] [Google Scholar]
- Chen G, Cheng Y, Tang Y, Martinka M, Li G. Role of Tip60 in human melanoma cell migration, metastasis, and patient survival. J Invest Dermatol. 2012;132(11):2632–2641. doi: 10.1038/jid.2012.193. [DOI] [PubMed] [Google Scholar]
- Gorrini C, et al. Tip60 is a haplo-insufficient tumour suppressor required for an oncogene-induced DNA damage response. Nature. 2007;448(7157):1063–1067. doi: 10.1038/nature06055. [DOI] [PubMed] [Google Scholar]
- Jha S, et al. Destabilization of TIP60 by human papillomavirus E6 results in attenuation of TIP60-dependent transcriptional regulation and apoptotic pathway. Mol Cell. 2010;38(5):700–711. doi: 10.1016/j.molcel.2010.05.020. [DOI] [PMC free article] [PubMed] [Google Scholar]
- Kim JH, et al. Transcriptional regulation of a metastasis suppressor gene by Tip60 and beta-catenin complexes. Nature. 2005;434(7035):921–926. doi: 10.1038/nature03452. [DOI] [PubMed] [Google Scholar]
- Sakuraba K, et al. Down-regulation of Tip60 gene as a potential marker for the malignancy of colorectal cancer. Anticancer Res. 2009;29(10):3953–3955. [PubMed] [Google Scholar]
- Subbaiah VK, et al. E3 ligase EDD1/UBR5 is utilized by the HPV E6 oncogene to destabilize tumor suppressor TIP60. Oncogene. 2015. [DOI] [PubMed]
- Friedl P, Wolf K. Tumour-cell invasion and migration: diversity and escape mechanisms. Nat Rev Cancer. 2003;3(5):362–374. doi: 10.1038/nrc1075. [DOI] [PubMed] [Google Scholar]
- Nguyen DX, Bos PD, Massague J. Metastasis: from dissemination to organ-specific colonization. Nat Rev Cancer. 2009;9(4):274–284. doi: 10.1038/nrc2622. [DOI] [PubMed] [Google Scholar]
- Zijl F, Krupitza G, Mikulits W. Initial steps of metastasis: cell invasion and endothelial transmigration. Mutat Res. 2011;728(1-2):23–34. doi: 10.1016/j.mrrev.2011.05.002. [DOI] [PMC free article] [PubMed] [Google Scholar]
- Lamouille S, Xu J, Derynck R. Molecular mechanisms of epithelial-mesenchymal transition. Nat Rev Mol Cell Biol. 2014;15(3):178–196. doi: 10.1038/nrm3758. [DOI] [PMC free article] [PubMed] [Google Scholar]
- Liang CC, Park AY, Guan JL. In vitro scratch assay: a convenient and inexpensive method for analysis of cell migration in vitro. Nat Protoc. 2007;2(2):329–333. doi: 10.1038/nprot.2007.30. [DOI] [PubMed] [Google Scholar]
- Zhang Y, et al. TIP60 inhibits metastasis by ablating DNMT1-SNAIL2-driven epithelial-mesenchymal transition program. J Mol Cell Biol. 2016. [DOI] [PubMed]
- Riahi R, Yang Y, Zhang DD, Wong PK. Advances in wound-healing assays for probing collective cell migration. J Lab Autom. 2012;17(1):59–65. doi: 10.1177/2211068211426550. [DOI] [PubMed] [Google Scholar]
- Jonkman JE, et al. An introduction to the wound healing assay using live-cell microscopy. Cell Adh Migr. 2014;8(5):440–451. doi: 10.4161/cam.36224. [DOI] [PMC free article] [PubMed] [Google Scholar]


