

Abstract
Background
Patients managed non-operatively have been excluded from risk-adjusted benchmarking programs, including the American College of Surgeons (ACS) National Surgical Quality Improvement Program (NSQIP). Consequently, optimal performance evaluation is not possible for specialties like emergency general surgery (EGS) where non-operative management is common. We developed a multi-institutional EGS clinical data registry within ACS NSQIP that includes patients managed non-operatively to evaluate variability in non-operative care across hospitals and identify gaps in performance assessment that occur when only operative cases are considered.
Methods
Using ACS NSQIP infrastructure and methodology, surgical consultations for acute appendicitis, acute cholecystitis, and small bowel obstruction (SBO) were sampled at 13 hospitals that volunteered to participate in the EGS clinical data registry. Standard NSQIP variables and 16 EGS-specific variables were abstracted with 30-day follow-up. To determine the influence of complications in non-operative patients, rates of adverse outcomes were identified and hospitals were ranked by performance with and then without including non-operative cases.
Results
2,091 patients with EGS diagnoses were included, 46.6% with appendicitis, 24.3% with cholecystitis, and 29.1% with SBO. The overall rate of non-operative management was 27.4%, 6.6% for appendicitis, 16.5% for cholecystitis, and 69.9% for SBO. Despite comprising only 27.4% of patients in the EGS Pilot, non-operative management accounted for 67.7% of deaths, 34.3% of serious morbidities, and 41.8% of hospital readmissions. After adjusting for patient characteristics and hospital diagnosis mix, addition of non-operative management to hospital performance assessment resulted in 12 of 13 hospitals changing performance rank, with 4 hospitals changing by 3 or more positions.
Conclusions
This study identifies a gap in performance evaluation when non-operative patients are excluded from surgical quality assessment and demonstrates the feasibility of incorporating non-operative care into existing surgical quality initiatives. Broadening the scope of hospital performance assessment to include non-operative management creates an opportunity to improve the care of all surgical patients, not just those who have an operation.
Level of Evidence
III, Prognostic and Epidemiological
Keywords: emergency general surgery, surgical quality assessment, non-operative management
Background
Efforts to enhance the quality of surgical care have resulted in improved clinical outcomes following surgery.(1–4) The foundation of successful surgical quality initiatives is the collection of accurate clinical information that can be translated into meaningful, risk-adjusted hospital performance feedback. This approach has helped quality programs such as the American College of Surgeons (ACS) National Surgical Quality Improvement Program (NSQIP) decrease perioperative complication rates, mortality rates, and costs at participating hospitals.(5–7)
The scope of existing surgical quality initiatives is primarily limited to the care of patients undergoing operative interventions. However, there are an increasing number of patients with surgical diagnoses being managed non-operatively each year, particularly for patients presenting to hospitals with acute surgical diagnoses such as diverticulitis, small bowel obstruction (SBO), cholecystitis, and appendicitis.(8) The systematic exclusion of this growing segment of the surgical patient population from current surgical quality initiatives has created a “blind spot” in surgical quality assessment. For many surgeons, non-operative management of surgical disease may only comprise a small portion of their clinical practice. However, for surgeons who routinely provide emergency general surgery (EGS) care, non-operative management may play a far more substantial role.
Patients with EGS diagnoses are an important component of the surgical patient population, accounting for nearly 7% of all hospital admissions in the United States each year at a cost of nearly $38 billion.(9) Despite the higher complication rates and increased costs associated with the acute management of surgical disease, widely accepted surgical quality initiatives do not currently focus on EGS.(10–12) Although the reasons for this are multi-factorial, challenges collecting data on patients managed non-operatively and difficulties providing adequately risk-adjusted performance feedback are likely key contributing factors.
We hypothesized that by leveraging ACS NSQIP to create an EGS clinical data registry, we could 1) evaluate clinical outcomes for both the operative and non-operative management of surgical disease, 2) assess hospital performance on key surgical quality metrics for operative and non-operative treatment modalities, and 3) demonstrate the influence the addition of non-operative management can have on overall hospital-level performance rankings.
Methods
Data were obtained from the ACS NSQIP Emergency General Surgery (EGS) Pilot Project. The ACS NSQIP is a clinical data registry containing more than 200 variables related to peri-operative surgical care, including pre-operative patient characteristics, operative information, and post-operative outcomes. Trained clinical abstractors at participating institutions prospectively collect all data included in ACS NSQIP. To ensure the consistency and reliability of included data, highly standardized data definitions are used. Results of data collection audits periodically performed at participating hospitals have proven the data contained within the NSQIP clinical data registry to be highly reliable.(13) Full details of the ACS NSQIP have been previously described.(14–16)
The EGS Pilot Project was developed by the ACS NSQIP in conjunction with the American Association for the Surgery of Trauma (AAST) to collect data important to the care of patients with common EGS diagnoses, regardless of whether or not they underwent operative intervention. This pilot project is the first time that the ACS NSQIP has been used to collect data on the non-operative management of surgical patients. Thirteen NSQIP hospitals in the United States and Canada volunteered to participate in the initial phase of the EGS Pilot. Data were collected at participating sites between March 1, 2015 and November 30, 2015.
Eligibility criteria for patients to be included in the EGS Pilot were documentation of acute appendicitis, acute cholecystitis, or small bowel obstruction (SBO) by a physician, imaging supporting the diagnosis, evaluation or management by a general surgeon, and age ≥18 years old. Patients were excluded if the diagnosis of appendicitis, cholecystitis, or SBO was made ≥48 hours after admission or if any diagnosis-specific exclusion criteria were met. The three included diagnoses were selected for the EGS Pilot because they are common surgical diagnoses, are often managed by surgeons, and can be managed either operatively or non-operatively. Detailed inclusion and exclusion criteria are provided in Supplement A.
Standard ACS NSQIP demographic, risk factor, and 30-day outcome data were collected for each patient included in the EGS Pilot. Patient characteristics included in these analyses are listed in Tables 1 and 2. When necessary, ACS NSQIP variable definitions were modified to make them applicable to patients managed non-operatively. EGS-specific demographic and risk factor data were also collected, including initial admitting service, physiologic and laboratory data at the time of general surgery consultation, initial management plan (i.e. operative vs. non-operative), AAST disease severity grade(17), and presence of abdominal co-morbidities such as previous operations, Crohn’s disease, radiation, and carcinomatosis.
Table 1.
Baseline demographic and risk-factor characteristics of study sample
| Overall n (%) |
Appendicitis n (%) |
Cholecystitis n (%) |
SBO n (%) |
|||||
|---|---|---|---|---|---|---|---|---|
| Operative Management | Non-Operative Management | Operative Management | Non-Operative Management | Operative Management | Non-Operative Management | Operative Management | Non-Operative Management | |
|
|
|
|
|
|||||
| Total Patients | 1,518 (72.6) | 573 (27.4) | 911 (93.4) | 64 (6.6) | 424 (83.5) | 84 (16.5) | 183 (30.1) | 425 (69.9) |
| Age, mean (SD) | 46.5 (19.0) | 62.5 (18.9) | 40.2 (17.0) | 50.1 (21.7) | 52.6 (17.7) | 67.3 (18.5) | 63.3 (16.7) | 63.4 (17.8) |
| Gender | ||||||||
| Male | 743 (49.0) | 290 (50.6) | 477 (52.4) | 34 (53.1) | 180 (42.5) | 39 (46.4) | 86 (47.0) | 217 (51.1) |
| Female | 775 (51.1) | 183 (49.4) | 434 (47.6) | 30 (46.9) | 244 (57.6) | 45 (53.6) | 97 (53.0) | 208 (48.9) |
| Preoperative Functional Status | ||||||||
| Independent | 1,457 (96.0) | 541 (94.4) | 885 (97.2) | 63 (98.4) | 401 (94.6) | 77 (91.7) | 171 (93.4) | 401 (94.4) |
| Partially dependent | 16 (1.1) | 17 (3.0) | 3 (0.3) | 0 (0.0) | 7 (1.7) | 4 (4.8) | 6 (3.3) | 13 (3.1) |
| Totally dependent | 8 (0.5) | 12 (2.1) | 2 (0.2) | 0 (0.0) | 3 (0.7) | 3 (3.6) | 3 (1.6) | 9 (2.1) |
| Unknown | 37 (2.4) | 3 (0.5) | 21 (2.3) | 1 (1.6) | 13 (3.1) | 0 (0.0) | 3 (1.6) | 2 (0.5) |
| Preoperative History | ||||||||
| Hypertension | 392 (25.8) | 242 (42.2) | 145 (15.9) | 19 (29.7) | 163 (38.4) | 46 (54.8) | 84 (45.9) | 177 (41.7) |
| CHF | 5 (0.3) | 9 (1.6) | 1 (0.1) | 1 (1.6) | 1 (0.2) | 1 (1.2) | 3 (1.6) | 7 (1.7) |
| Dyspnea | 20 (1.3) | 17 (3.0) | 8 (0.9) | 1 (1.6) | 6 (1.4) | 4 (4.8) | 6 (3.3) | 12 (2.8) |
| COPD | 33 (2.2) | 30 (5.2) | 8 (0.9) | 2 (3.1) | 8 (1.9) | 3 (3.6) | 17 (9.3) | 25 (5.9) |
| Smoker in past year | 200 (13.2) | 50 (8.7) | 104 (11.4) | 6 (9.4) | 70 (16.5) | 9 (10.7) | 26 (14.2) | 35 (8.2) |
| Ventilator dependent | 2 (0.1) | 7 (1.2) | 0 (0) | 1 (1.6) | 0 (0) | 1 (1.2) | 2 (1.1) | 5 (1.2) |
| Diabetes | 113 (7.4) | 74 (12.9) | 34 (3.7) | 3 (4.7) | 57 (13.4) | 25 (29.8) | 22 (12.0) | 46 (10.8) |
| Corticosteroid Use | 53 (3.5) | 34 (5.9) | 16 (1.8) | 2 (3.1) | 24 (5.7) | 0 (0.0) | 13 (7.1) | 32 (7.5) |
| Albumin <3.0g/dL | 67 (4.4) | 44 (7.7) | 11 (1.2) | 6 (9.4) | 39 (9.2) | 11 (13.1) | 17 (9.3) | 27 (6.4) |
| Ascites | 8 (0.5) | 11 (1.9) | 1 (0.1) | 0 (0.0) | 0 (0.0) | 0 (0.0) | 7 (3.8) | 11 (2.6) |
| Renal failure/dialysis | 14 (0.9) | 26 (4.5) | 2 (0.2) | 1 (1.6) | 3 (0.7) | 6 (7.1) | 9 (4.9) | 19 (4.5) |
| Bleeding disorder | 50 (3.3) | 60 (10.5) | 19 (2.1) | 6 (9.4) | 14 (3.3) | 21 (25.0) | 17 (9.3) | 33 (7.8) |
| SIRS | 270 (17.8) | 74 (12.9) | 179 (19.7) | 4 (6.3) | 67 (15.8) | 18 (21.4) | 24 (13.1) | 52 (12.2) |
| Sepsis | 121 (8.0) | 25 (4.4) | 91 (10.0) | 12 (18.8) | 20 (4.7) | 9 (10.7) | 10 (5.5) | 4 (0.9) |
| Septic shock | 5 (0.3) | 7 (1.2) | 0 (0.0) | 1 (1.6) | 0 (0.0) | 1 (1.2) | 5 (2.7) | 5 (1.2) |
| Disseminated cancer | 20 (1.3) | 63 (11.0) | 1 (0.1) | 1 (1.6) | 4 (0.9) | 4 (4.8) | 15 (8.2) | 58 (13.7) |
| Abdominalcomorbidities | 497 (32.7) | 429 (74.9) | 181 (19.9) | 18 (28.1) | 174 (41.0) | 41 (48.8) | 142 (77.6) | 370 (87.1) |
| BMI | ||||||||
| <18.5 | 29 (1.9) | 18 (3.1) | 11 (1.2) | 2 (3.1) | 4 (0.9) | 0 (0.0) | 14 (7.7) | 16 (3.8) |
| 18.5–24.9 | 384 (25.3) | 108 (18.9) | 254 (27.9) | 14 (21.9) | 66 (15.6) | 9 (10.7) | 64 (35.0) | 85 (20.0) |
| 25.0–29.9 | 372 (24.5) | 93 (16.2) | 227 (24.9) | 4 (6.3) | 114 (26.9) | 15 (17.9) | 31 (16.9) | 74 (17.4) |
| 30.0–34.9 | 221 (14.6) | 42 (7.3) | 112 (12.3) | 5 (7.8) | 90 (21.2) | 7 (8.3) | 19 (10.4) | 30 (7.1) |
| >35.0 | 176 (11.6) | 40 (7.0) | 78 (8.6) | 2 (3.1) | 83 (19.6) | 10 (11.9) | 15 (8.2) | 28 (6.6) |
| Unknown | 336 (22.1) | 272 (47.5) | 229 (25.1) | 37 (57.8) | 67 (15.6) | 43 (51.2) | 40 (21.9) | 192 (45.2) |
| Disease Severity* | ||||||||
| Normal | 72 (4.7) | 15 (2.6) | 35 (3.8) | 5 (7.8) | 36 (8.5) | 9 (10.7) | 1 (0.6) | 1 (0.2) |
| Mild | 920 (60.6) | 427 (74.5) | 592 (65.0) | 26 (40.6) | 265 (62.5) | 58 (69.1) | 63 (34.4) | 343 (80.7) |
| Moderate | 369 (24.3) | 108 (18.9) | 186 (20.4) | 28 (43.8) | 94 (22.2) | 10 (11.9) | 89 (48.6) | 70 (16.5) |
| Severe | 68 (4.5) | 7 (1.2) | 38 (4.2) | 4 (6.3) | 10 (2.4) | 2 (2.4) | 20 (10.9) | 1 (0.2) |
| Unknown | 89 (5.9) | 16 (2.8) | 60 (6.6) | 1 (1.6) | 19 (4.5) | 5 (6.0) | 10 (5.5) | 10 (2.4) |
Disease severity is categorized into normal, mild, moderate, and severe using AAST disease severity grades. Normal represents the absence of local disease at the time of operation.
Table 2.
Unadjusted 30-day outcomes
| Overall # of events (rate, %) |
Appendicitis # of events (rate, %) |
Cholecystitis # of events (rate, %) |
SBO # of events (rate, %) |
|||||
|---|---|---|---|---|---|---|---|---|
| Operative Management (n = 1,518) |
Non-Operative Management (n = 573) |
Operative Management (n = 911) |
Non-Operative Management (n = 64) |
Operative Management (n = 424) |
Non-Operative Management (n = 84) |
Operative Management (n = 183) |
Non-Operative Management (n = 425) |
|
|
|
|
|
|
|||||
| Death | 10 (0.7) | 21 (3.7) | 2 (0.2) | 0 (0.0) | 2 (0.5) | 2 (2.4) | 6 (3.3) | 19 (4.5) |
| Serious Morbidity | 88 (5.8) | 46 (8.0) | 39 (4.3) | 9 (14.1) | 18 (4.3) | 9 (10.7) | 31 (16.9) | 28 (6.6) |
| Cardiac Event (MI/Arrest) | 6 (0.4) | 4 (0.7) | 2 (0.2) | 1 (1.6) | 3 (0.7) | 1 (1.2) | 1 (0.6) | 2 (0.5) |
| Pneumonia | 9 (0.6) | 5 (0.9) | 3 (0.3) | 0 (0.0) | 3 (0.7) | 2 (2.4) | 3 (1.6) | 3 (0.7) |
| Venous Thromboembolism | 6 (0.4) | 5 (0.9) | 1 (0.1) | 0 (0.0) | 2 (0.5) | 2 (2.4) | 3 (1.6) | 3 (0.7) |
| Acute Renal Failure | 4 (0.3) | 2 (0.4) | 2 (0.2) | 0 (0.0) | 0 (0.0) | 0 (0.0) | 2 (1.1) | 2 (0.5) |
| Septic Shock | 4 (0.3) | 2 (0.4) | 0 (0.0) | 0 (0.0) | 1 (0.2) | 0 (0.0) | 3 (1.6) | 2 (0.5) |
| Urinary Tract Infection | 1 (0.1) | 4 (0.7) | 0 (0.0) | 0 (0.0) | 0 (0.0) | 0 (0.0) | 1 (0.6) | 4 (0.9) |
| Deep/Organ Space SSI | 42 (2.8) | 9 (1.6) | 26 (2.9) | 6 (9.4) | 5 (1.2) | 2 (2.4) | 11 (6.0) | 1 (0.2) |
| Wound Dehiscence1 | 3 (0.2) | n/a | 0 (0.0) | n/a | 0 (0.0) | n/a | 3 (1.6) | n/a |
| Unplanned Operation | 33 (2.2) | 18 (3.1) | 14 (1.5) | 3 (4.7) | 5 (1.2) | 2 (2.4) | 14 (7.7) | 13 (3.1) |
| Unplanned Intubation | 7 (0.5) | 2 (0.4) | 2 (0.2) | 0 (0.0) | 3 (0.7) | 0 (0.0) | 2 (1.1) | 2 (0.5) |
| Death or Serious Morbidity2 | 98 (6.5) | 67 (11.7) | 41 (4.5) | 9 (14.1) | 20 (4.7) | 11 (13.1) | 36 (19.7) | 47 (11.1) |
| Failure To Rescue | 5 (5.7) | 2 (4.3) | 1 (2.6) | 0 (0.0) | 1 (5.6) | 0 (0.0) | 3 (9.7) | 2 (7.1) |
| Hospital Readmission | 96 (6.3) | 69 (12.0) | 40 (4.4) | 7 (10.9) | 35 (8.3) | 15 (17.9) | 21 (11.5) | 47 (11.1) |
Wound dehiscence is not applicable to non-operative management because a wound is not created.
Failure to rescue is defined as the number of mortalities following the occurrence of one or more serious post-operative morbidities.
To determine the extent to which non-operative management was used in the treatment of appendicitis, cholecystitis, and SBO, operative and non-operative management rates at participating hospitals were calculated in aggregate and by diagnosis. Demographic and comorbidity information were assessed for the overall EGS patient population, as well as independently for the appendicitis, cholecystitis, and SBO patient cohorts.
Clinical outcomes associated with appendicitis, cholecystitis, and SBO were evaluated by calculating rates of adverse events occurring within 30-days of initial evaluation by a surgeon. Outcome rates were independently derived for both the operative and non-operative management of patients with each diagnosis to quantify the complication burden of both management strategies. Statistical comparisons between operative and non-operative management strategies were not performed because this was beyond the scope of this study. The clinical outcome metrics assessed included death, serious morbidity, a death or serious morbidity composite measure (DSM), failure to rescue, and hospital readmission. Serious morbidity is an ACS NSQIP composite measure defined by the presence of one or more of the following post-operative occurrences: cardiac event (myocardial infarction or cardiac arrest), pneumonia, venous thromboembolism (deep venous thrombosis or pulmonary embolism), acute renal failure, septic shock, urinary tract infection, deep or organ space surgical site infection, wound dehiscence, unplanned operation, and unplanned intubation. In this analysis, a patient meeting criteria for failure to rescue was a patient who died after experiencing one or more serious post-operative morbidities.
To assess hospital-level performance in emergency general surgery, each of the thirteen participating hospitals were ranked based on rate of DSM. Unadjusted DSM rates were derived for both operative and non-operative management at each hospital. Performance rankings from 1–13 were then assigned to hospitals based on rates of DSM. A performance ranking of 1 reflects the hospital with the lowest DSM rate, while a performance ranking of 13 was assigned to the hospital with the highest rate.
The influence of incorporating non-operative management into surgical quality assessment was evaluated by ranking hospital performance on the DSM outcome measure with and without the inclusion of patients managed non-operatively. To account for variability in patient factors and hospital diagnosis mix, risk-adjusted odds ratios for DSM were derived for each hospital with and without the inclusion of non-operative patients using a hierarchical logistic regression model with hospital random intercepts. Age, gender, functional status, co-morbidities (see “Preoperative History” in Table 1 for full list), BMI, hospital diagnosis mix, and disease severity were each selected as covariates a priori and adjusted for in the model. Hospitals were ranked from 1–13 using the risk-adjusted odds ratios calculated with and without the inclusion of non-operative patients in the model.
All analyses were conducted using SAS version 9.4 (SAS Institute, Cary NC). The Chesapeake Research Review Institutional Review Board approved this study and granted a waiver of informed consent due to the de-identified nature of the data that were collected.
Results
Of the 2,091 patients meeting inclusion criteria, 975 (46.6%) had a diagnosis of appendicitis, 508 (24.3%) had cholecystitis, and 608 (29.1%) had a SBO. The rate of non-operative management was 6.6% for appendicitis, 16.5% for cholecystitis, and 69.9% for SBO, yielding a 27.4% overall rate of non-operative management in the EGS Pilot. Baseline characteristics of the operative and non-operative patient cohorts are provided in Table 1.
EGS Pilot patients who underwent operative management experienced a 5.8% rate of serious morbidity, a 0.7% rate of mortality, and a 6.5% rate of DSM. The most common serious morbidity among these patients was deep/organ space surgical site infection, occurring at a rate of 2.8%. Among patients managed non-operatively, the serious morbidity rate was 8.0%, the mortality rate was 3.7%, and the DSM rate was 11.7%. The most common serious morbidity for patients managed non-operatively was unplanned operation, which occurred in 3.1% of patients following discharge from the hospital. Rate of hospital readmission following operative management was 6.3%, while the readmission rate after non-operative management was 12.0%. Despite comprising only 27.4% of patients included in the EGS Pilot, patients managed non-operatively accounted for a significant portion of the overall 30-day morbidity and mortality, including 42.0% of all DSMs, 34.3% of serious morbidities, 67.7% of deaths, and 41.8% of hospital readmissions. Complete unadjusted 30-day outcome data are provided in Table 2.
Hospital-level performance assessment revealed substantial variability in unadjusted rates of DSM across hospitals. Among the 13 hospitals participating in the EGS Pilot, DSM rates following operative management ranged from 3.2% at the top performing hospital to 14.3% at the bottom performing hospital. DSM rates for non-operative management ranged from 4.4% to 22.2% among participating hospitals (Table 3). DSM rates for operative management did not closely correlate with those for non-operative management with hospitals. This is reflected in the differences in performance ranking for DSM between operative and non-operative management at participating hospitals, with 8 hospitals having rank changes of 3 or more positions between these two management approaches (Table 3)
Table 3.
Unadjusted hospital performance for 30-day death or serious morbidity
| Event Rate, % | Performance Ranking | |||
|---|---|---|---|---|
| Operative Management | Non-Operative Management | Operative Management | Non-Operative Management | |
|
|
|
|||
|
Hospital A (n=242) |
3.2% | 12.9% | 1st | T-6th |
|
Hospital B (n=118) |
3.6% | 16.7% | T-2nd | T-10th |
|
Hospital C (n=188) |
3.6% | 6.3% | T-2nd | 2nd |
|
Hospital D (n=208) |
3.6% | 10.0% | T-2nd | 4th |
|
Hospital E (n=107) |
4.2% | 11.1% | 5th | 5th |
|
Hospital F (n=285) |
6.2% | 9.3% | 6th | 3rd |
|
Hospital G (n=233) |
6.4% | 15.1% | 7th | 9th |
|
Hospital H (n=36) |
6.7% | 16.7% | 8th | T-10th |
|
Hospital I (n=91) |
7.3% | 22.2% | 9th | 13th |
|
Hospital J (n=243) |
8.2% | 12.9% | 10th | T-6th |
|
Hospital K (n=152) |
11.5% | 13.6% | 11th | 8th |
|
Hospital L (n=114) |
12.1% | 4.4% | 12th | 1st |
|
Hospital M (n=74) |
14.3% | 16.7% | 13th | T-10th |
Following risk-adjustment, odds ratios for 30-day DSM across hospitals ranged from 0.80 to 1.44 for the operative management cohort and from 0.81 to 1.26 for the overall EGS patient cohort (Table 4). However, due to limited size of patient sample all confidence intervals overlap. Measures of fit this model included a c-statistic of 0.86 (95% CI: 0.83–0.90) and Hosmer-Lemeshow test of 21.9 (p<0.01). Odds ratios could not be derived for the non-operative management cohort due to limited sample size. Comparison of risk-adjusted performance rankings for operative management alone to those including both operative and non-operative management reveal the influence the addition of non-operative care can have on surgical performance assessment. The addition of non-operatively managed patients to risk-adjusted hospital performance assessment influenced the performance ranking of 12 of the 13 hospitals included in the analysis, with 4 hospitals changing rank by 3 or more positions (Figure 1). The c-statistic of the model for the combined operative and non-operative patient population was 0.82 (95% CI: 0.79–0.85) and the Hosmer-Lemeshow test was 12.87 (p=0.12).
Table 4.
Risk-adjusted odds ratios for 30-day death or serious morbidity, by hospital
| Odds Ratio (95% CI) | ||
|---|---|---|
| Operative Management | Operative + Non-Operative Management | |
|
|
||
|
Hospital A (n=242) |
1.06 (0.57–1.97) | 1.01 (0.67–1.53) |
|
Hospital B (n=118) |
0.85 (0.51–1.42) | 0.89 (0.59–1.33) |
|
Hospital C (n=188) |
1.02 (0.58–1.79) | 0.98 (0.66–1.57) |
|
Hospital D (n=208) |
0.83 (0.48–1.45) | 0.93 (0.62–1.40) |
|
Hospital E (n=107) |
1.27 (0.81–1.97) | 1.22 (0.77–1.93) |
|
Hospital F (n=285) |
1.44 (0.67–3.06) | 1.05 (0.71–1.55) |
|
Hospital G (n=233) |
0.84 (0.49–1.43) | 0.81 (0.48–1.37) |
|
Hospital H (n=36) |
1.05 (0.84–1.32) | 1.01 (0.71–1.42) |
|
Hospital I (n=91) |
1.32 (0.81–2.16) | 1.16 (0.73–1.82) |
|
Hospital J (n=243) |
0.83 (0.54–1.27) | 0.92 (0.63–1.33) |
|
Hospital K (n=152) |
0.80 (0.43–1.48) | 1.03 (0.70–1.51) |
|
Hospital L (n=114) |
1.29 (0.66–2.53) | 1.26 (0.68–2.34) |
|
Hospital M (n=74) |
0.81 (0.50–1.32) | 0.89 (0.59–1.35) |
Please note that all confidence intervals overlap due to limited sample size and low event rates.
Figure 1.
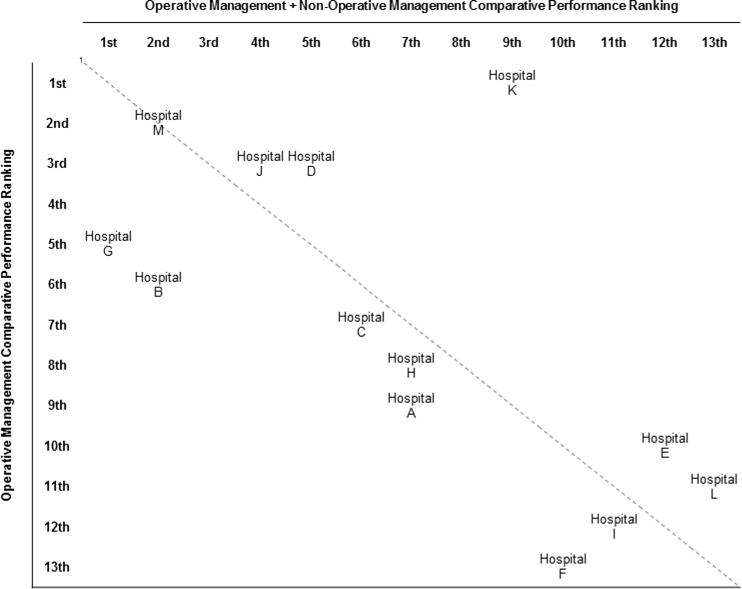
Concordance of risk-adjusted hospital performance rankings for 30-day death or serious morbidity with and without the inclusion of patients managed non-operatively.
1Hospitals located along the diagnol have no differences in performance ranking between operative and non-operative management. Hospital distance from the diagnol correlates with differences in performance ranking between operative and non-operative management at that hospital.
Discussion
Non-operative management is an important treatment modality in emergency general surgery that is used in more than one-fourth of patients with common EGS diagnoses, though utilization rates vary considerably by diagnosis. Patients receiving non-operative surgical care are also at risk for adverse outcomes, including complications, readmissions, and/or death, as demonstrated by the rates of adverse outcomes among patients who receive this treatment modality. The potential value in incorporating non-operative management into surgical quality assessment is supported by the effect its inclusion has on hospital performance rankings.
The results of this pilot study suggest that operative and non-operative management approaches both contribute to adverse outcome burden in EGS. In fact, the non-operative management of surgical disease may actually account for a disproportionately high rate of complications when compared to operative management of the same diagnoses. Hospital-level outcomes analyses identified considerable variability in morbidity and mortality rates among hospitals participating in the EGS Pilot for both operative and non-operative care. These findings highlight opportunities for performance improvement at hospitals for both operative and non-operative EGS care.
In addition to the identification of variability in outcomes across hospitals, this study revealed performance variability within hospitals as well. Hospital-level outcomes analyses revealed that morbidity and mortality rates for operative management do not consistently correlate with adverse outcome rates for non-operative management within hospitals. This finding is reflected in differences in hospital performance rankings that exist when independently evaluating operative and non-operative management. The changes in rankings identified in this study demonstrate that the delivery of high quality operative care does not always translate into the delivery of high quality non-operative care. These results underscore the importance of incorporating non-operative management into surgical quality assessment efforts and the opportunity that exists to improve upon the quality of care being delivered to surgical patients.
The majority of outcomes research in EGS has focused on the burden of EGS diagnoses in the United States and the post-operative morbidity and mortality associated with these diagnoses.(9, 11, 18, 19) Despite the increasing utilization of non-operative management in surgery, clinical outcomes related to non-operative management strategies are rarely evaluated. Diseases such as diverticulitis, SBO, cholecystitis, choledocholithiasis, and even appendicitis are being managed non-operatively at increasingly high rates.(20–26) However, little has been done to systematically evaluate the way in which non-operative care is being provided. Similarly, little has been done to identify which patients should be selected for non-operative management and how long patients should be managed non-operatively before converting to operative management. This study establishes the feasibility of collecting data on the non-operative management of surgical disease in a national clinical data registry and highlights the benefits of including non-operative care in surgical quality assessment efforts.
The ability to leverage the infrastructure of an existing clinical data registry was a major strength of this study. While this study represents the first time that non-operatively managed surgical patients have been included in ACS NSQIP, detailed patient characteristics and clinical outcome information were able to be collected. The ability to collect EGS-specific data points, including disease severity, was another strength of this study. The data collected during the ACS NSQIP EGS Pilot can facilitate robust analyses beyond those that are possible using institutional or administrative data sets. Additional strengths of this study include the utilization of a well-established methodology for hospital-level performance assessment in surgery, the inclusion of a diverse group of hospitals, and the ability to obtain reliable 30-day outcome information.
However, this study was not without limitations. As a pilot project, the primary objective was to demonstrate the feasibility of collecting data and evaluating performance on the non-operative management of surgical disease using the ACS NSQIP. The EGS Pilot was therefore not powered to conduct robust risk-adjusted analyses. Consequently, statistical analyses were unable to be performed on each of the included diagnoses independently. Similarly, meaningful statistical comparisons between outcomes for operative and non-operative management strategies were not possible. Small sample size in conjunction with low event rates limited statistical analyses of clinical outcomes to the DSM composite outcome measure. Lastly, the inability to follow patients for longer than 30 days is a significant limitation. This is particularly true in the non-operative management of surgical disease, where failures of non-operative management (complications) are likely to manifest as disease recurrence requiring hospital readmission and/or operative intervention beyond the 30 days patients are followed by the ACS NSQIP. The optimal duration of time EGS patients should be followed for adverse outcomes is unclear. Practical constraints are likely to limit the potential for consistent follow-up beyond one year. However, extending the follow-up period to one year would likely provide valuable outcome information beyond what is currently collected, particularly among the non-operatively managed patients.
The results of this study illustrate the importance and the feasibility of expanding the scope of surgical quality assessment to include the non-operative management of surgical disease. However, establishing the importance and feasibility of non-operative surgical quality assessment is just the first step. Moving forward, non-operative care should be incorporated into surgical quality initiatives such as clinical data registries and public reporting programs. The detailed clinical data collected for these initiatives will hold the information necessary to identify optimal practices in the non-operative management of surgical disease and ultimately improve the quality of care provided to surgical patients.
Supplementary Material
Presentations.
This paper was a podium presentation at the 75th Annual Meeting of the American Association for the Surgery of Trauma on September 16, 2016.
Acknowledgments
Disclosures: The work reported in this manuscript was in part supported by grant F32GM113513 from the National Institute of General Medical Sciences of the National Institutes of Health.
Footnotes
Conflicts of Interest: None
Author Contributions:
MWW, ABN, and CYK participated in the literature search, study design, data collection, data analysis, data interpretation, writing, and critical revisions for this manuscript. PEB, CC, HGC, JJD, TMD, SMH, MMH, MHM, JLR, PMR, HDR, JLS, KLS, and GHU participated in the data collection, data interpretation, and critical revisions for this manuscript. MLC and KYB participated in the data interpretation and critical revisions for this manuscript.
References
- 1.Chassin MR. Achieving and sustaining improved quality: lessons from New York State and cardiac surgery. Health Aff (Millwood) 2002;21(4):40–51. doi: 10.1377/hlthaff.21.4.40. [DOI] [PubMed] [Google Scholar]
- 2.Fung CH, Lim YW, Mattke S, Damberg C, Shekelle PG. Systematic review: the evidence that publishing patient care performance data improves quality of care. Ann Intern Med. 2008;148(2):111–23. doi: 10.7326/0003-4819-148-2-200801150-00006. [DOI] [PubMed] [Google Scholar]
- 3.Ko CY, Hall BL, Hart AJ, Cohen ME, Hoyt DB. The American College of Surgeons National Surgical Quality Improvement Program: achieving better and safer surgery. Jt Comm J Qual Patient Saf. 2015;41(5):199–204. doi: 10.1016/s1553-7250(15)41026-8. [DOI] [PubMed] [Google Scholar]
- 4.Totten AM, Wagner J, Tiwari A, O’Haire C, Griffin J, Walker M. Closing the quality gap: revisiting the state of the science (vol. 5: public reporting as a quality improvement strategy) Evid Rep Technol Assess. 2012;208(5):1–645. [PMC free article] [PubMed] [Google Scholar]
- 5.Cohen ME, Liu Y, Ko CY, Hall BL. Improved Surgical Outcomes for ACS NSQIP Hospitals Over Time: Evaluation of Hospital Cohorts With up to 8 Years of Participation. Ann Surg. 2016;263(2):267–73. doi: 10.1097/SLA.0000000000001192. [DOI] [PubMed] [Google Scholar]
- 6.Guillamondegui OD, Gunter OL, Hines L, Martin BJ, Gibson W, Clarke PC, Cecil WT, Cofer JB. Using the National Surgical Quality Improvement Program and the Tennessee Surgical Quality Collaborative to improve surgical outcomes. J Am Coll Surg. 2012;214(4):709–14. doi: 10.1016/j.jamcollsurg.2011.12.012. discussion 14–6. [DOI] [PubMed] [Google Scholar]
- 7.Hall BL, Hamilton BH, Richards K, Bilimoria KY, Cohen ME, Ko CY. Does surgical quality improve in the American College of Surgeons National Surgical Quality Improvement Program: an evaluation of all participating hospitals. Ann Surg. 2009;250(3):363–76. doi: 10.1097/SLA.0b013e3181b4148f. [DOI] [PubMed] [Google Scholar]
- 8.Wandling M, Nathens AB, Pavey ES, Chung JW, Yang AD, Shapiro MB, Ko CY, Bilimoria KY. Evaluating the Blind Spot of Surgical Quality: A National Assessment of Non-Operative Management. 2016 Association for Academic Surgery Academic Surgical Congress; February 4, 2016; Jacksonville, FL. 2016. [Google Scholar]
- 9.Ogola GO, Gale SC, Haider A, Shafi S. The financial burden of emergency general surgery: National estimates 2010 to 2060. J Trauma Acute Care Surg. 2015;79(3):444–8. doi: 10.1097/TA.0000000000000787. [DOI] [PubMed] [Google Scholar]
- 10.Haider AH, Obirieze A, Velopulos CG, Richard P, Latif A, Scott VK, Zogg CK, Haut ER, Efron DT, Cornwell EE, 3rd, et al. Incremental Cost of Emergency Versus Elective Surgery. Ann Surg. 2015;262(2):260–6. doi: 10.1097/SLA.0000000000001080. [DOI] [PubMed] [Google Scholar]
- 11.Ingraham AM, Cohen ME, Raval MV, Ko CY, Nathens AB. Comparison of hospital performance in emergency versus elective general surgery operations at 198 hospitals. J Am Coll Surg. 2011;212(1):20–8.e1. doi: 10.1016/j.jamcollsurg.2010.09.026. [DOI] [PubMed] [Google Scholar]
- 12.Ingraham AM, Haas B, Cohen ME, Ko CY, Nathens AB. Comparison of hospital performance in trauma vs emergency and elective general surgery: implications for acute care surgery quality improvement. Arch Surg. 2012;147(7):591–8. doi: 10.1001/archsurg.2012.71. [DOI] [PubMed] [Google Scholar]
- 13.Shiloach M, Frencher SK, Jr, Steeger JE, Rowell KS, Bartzokis K, Tomeh MG, Richards KE, Ko CY, Hall BL. Toward robust information: data quality and inter-rater reliability in the American College of Surgeons National Surgical Quality Improvement Program. J Am Coll Surg. 2010;210(1):6–16. doi: 10.1016/j.jamcollsurg.2009.09.031. [DOI] [PubMed] [Google Scholar]
- 14.Khuri SF, Henderson WG, Daley J, Jonasson O, Jones RS, Campbell DA, Jr, Fink AS, Mentzer RM, Jr, Neumayer L, Hammermeister K, et al. Successful implementation of the Department of Veterans Affairs’ National Surgical Quality Improvement Program in the private sector: the Patient Safety in Surgery study. Ann Surg. 2008;248(2):329–36. doi: 10.1097/SLA.0b013e3181823485. [DOI] [PubMed] [Google Scholar]
- 15.Khuri SF, Daley J, Henderson W, Hur K, Demakis J, Aust JB, Chong V, Fabri PJ, Gibbs JO, Grover F, et al. The Department of Veterans Affairs’ NSQIP: the first national, validated, outcome-based, risk-adjusted, and peer-controlled program for the measurement and enhancement of the quality of surgical care. National VA Surgical Quality Improvement Program. Ann Surg. 1998;228(4):491–507. doi: 10.1097/00000658-199810000-00006. [DOI] [PMC free article] [PubMed] [Google Scholar]
- 16.Cohen ME, Ko CY, Bilimoria KY, Zhou L, Huffman K, Wang X, Liu Y, Kraemer K, Meng X, Merkow R, et al. Optimizing ACS NSQIP modeling for evaluation of surgical quality and risk: patient risk adjustment, procedure mix adjustment, shrinkage adjustment, and surgical focus. J Am Coll Surg. 2013;217(2):336–46.e1. doi: 10.1016/j.jamcollsurg.2013.02.027. [DOI] [PubMed] [Google Scholar]
- 17.Shafi S, Aboutanos M, Brown CV, Ciesla D, Cohen MJ, Crandall ML, Inaba K, Miller PR, Mowery NT, American Association for the Surgery of Trauma Committee on Patient A et al. Measuring anatomic severity of disease in emergency general surgery. J Trauma Acute Care Surg. 2014;76(3):884–7. doi: 10.1097/TA.0b013e3182aafdba. [DOI] [PubMed] [Google Scholar]
- 18.Scott JW, Olufajo OA, Brat GA, Rose JA, Zogg CK, Haider AH, Salim A, Havens JM. Use of National Burden to Define Operative Emergency General Surgery. JAMA surgery. 2016;151(6):e160480. doi: 10.1001/jamasurg.2016.0480. [DOI] [PubMed] [Google Scholar]
- 19.Gale SC, Shafi S, Dombrovskiy VY, Arumugam D, Crystal JS. The public health burden of emergency general surgery in the United States: A 10-year analysis of the Nationwide Inpatient Sample–2001 to 2010. J Trauma Acute Care Surg. 2014;77(2):202–8. doi: 10.1097/TA.0000000000000362. [DOI] [PubMed] [Google Scholar]
- 20.Wandling MW, Hungness ES, Pavey ES, Stulberg JJ, Schwab B, Yang AD, Shapiro MB, Bilimoria KY, Ko CY, Nathens AB. Nationwide Assessment of Trends in Choledocholithiasis Management in the United States From 1998 to 2013. JAMA surgery. 2016 doi: 10.1001/jamasurg.2016.2059. [DOI] [PubMed] [Google Scholar]
- 21.Salminen P, Paajanen H, Rautio T, Nordstrom P, Aarnio M, Rantanen T, Tuominen R, Hurme S, Virtanen J, Mecklin JP, et al. Antibiotic Therapy vs Appendectomy for Treatment of Uncomplicated Acute Appendicitis: The APPAC Randomized Clinical Trial. JAMA. 2015;313(23):2340–8. doi: 10.1001/jama.2015.6154. [DOI] [PubMed] [Google Scholar]
- 22.Novitsky YW, Sechrist C, Payton BL, Kercher KW, Heniford BT. Do the risks of emergent colectomy justify nonoperative management strategies for recurrent diverticulitis? Am J Surg. 2009;197(2):227–31. doi: 10.1016/j.amjsurg.2007.11.027. [DOI] [PubMed] [Google Scholar]
- 23.Masoomi H, Buchberg BS, Magno C, Mills SD, Stamos MJ. Trends in diverticulitis management in the United States from 2002 to 2007. Arch Surg. 2011;146(4):400–6. doi: 10.1001/archsurg.2010.276. [DOI] [PubMed] [Google Scholar]
- 24.Gutt CN, Encke J, Koninger J, Harnoss JC, Weigand K, Kipfmuller K, Schunter O, Gotze T, Golling MT, Menges M, et al. Acute cholecystitis: early versus delayed cholecystectomy, a multicenter randomized trial (ACDC study, NCT00447304) Ann Surg. 2013;258(3):385–93. doi: 10.1097/SLA.0b013e3182a1599b. [DOI] [PubMed] [Google Scholar]
- 25.Etzioni DA, Mack TM, Beart RW, Jr, Kaiser AM. Diverticulitis in the United States: 1998–2005: changing patterns of disease and treatment. Ann Surg. 2009;249(2):210–7. doi: 10.1097/SLA.0b013e3181952888. [DOI] [PubMed] [Google Scholar]
- 26.Azagury D, Liu RC, Morgan A, Spain DA. Small bowel obstruction: A practical step-by-step evidence-based approach to evaluation, decision making, and management. J Trauma Acute Care Surg. 2015;79(4):661–8. doi: 10.1097/TA.0000000000000824. [DOI] [PubMed] [Google Scholar]
Associated Data
This section collects any data citations, data availability statements, or supplementary materials included in this article.