Abstract
The objective of the present study was to compare the influence of Eudragit® RS PO and RL PO blends on the release of water-soluble and insoluble drugs from hot-melt extruded formulations. In addition, we aimed to evaluate drug content uniformity and distribution by Fourier transform-infrared (FT-IR) chemical imaging. Theophylline (TP) and carbamazepine (CBZ) were selected as the water-soluble and insoluble model drugs, respectively. Eudragit® RS PO and RL PO were selected as the polymeric matrices. FT-IR chemical imaging clearly demonstrated the content uniformity and distribution for both drugs in the extrudates, which was confirmed by HPLC. Increasing the ratio of Eudragit® RL PO led to an increase in the in vitro drug release, whereas an increase in the ratio of Eudragit® RS PO sustained the drug release for up to 12 h. The hot-melt extrusion of TP and CBZ with varying ratios of Eudragit® RS PO and RL PO can be employed to tailor the drug release profiles. In this study, we demonstrated, for the first time, the use of FT-IR chemical imaging as a process analytical technique to determine the drug content uniformity and distribution. Our data correlated well with the results of HPLC analysis in the study of tailored drug release from the prepared hot-melt extruded formulation.
Keywords: Hot-melt extrusion, Sustained drug release, Eudragit®, FT-IR imaging, Process Analytical Technology (PAT)
Graphical Abstract
INTRODUCTION
Conventional drug delivery systems do not usually provide a rate-controlled or prolonged release. Thus, long-term sustained-release (SR) systems are critical to maintain drug concentrations between the maximum safe concentration (Cmax) and the minimum effective concentration (Cmin) to achieve therapeutic efficacy and safety [1]. In addition, SR systems are more effective in achieving an ideal therapeutic effect with drugs that have a short biological half-life and require repeated doses to maintain efficacy in long-term treatment [2].
However, SR dosage forms should exhibit a pH-independent release and sufficient robustness to resist the variable pH in the gastrointestinal tract (GIT), as well as numerous biopharmaceutical properties, and they should minimize the intra- and inter-individual variations with respect to bioavailability [3, 4]. Moreover, SR dosage forms that contain water-soluble drugs require a more compact fabrication within the polymer [5]. However, poorly water-soluble drugs require a solubilization process and release modulation to maximize their therapeutic efficacy [3]. The present study was performed to assess the viability of hot-melt extrusion (HME) techniques for this purpose.
HME is a processing technique that is gaining traction within the pharmaceutical industry [6–8]. It is used in the production of a variety of dosage forms, including tablets, pellets, and novel drug delivery systems [9–11]. The advantages of this technique over those of traditional methods include: 1) enhanced solubility (and hence bioavailability) of poorly soluble drugs by molecularly dispersing the drug within the polymer matrix; 2) a more environment-friendly process that does not require organic solvents or water; and 3) it involves a continuous and less labor-intensive process, which is amenable to quality by design (QbD) and process analytical techniques (PAT) [9–11]. Several researchers have suggested that owing to lower porosity and higher tortuosity, diffusion-controlled sustained-release dosage forms prepared using the HME technique have slower drug release rates than those prepared by traditional methods [12, 13]. Additionally, HME has been widely used to enhance the dissolution rate of actives via preparation of solid dispersions for immediate and sustained-release applications [11, 14, 15].
Among the extrudable polymers, which have both solubilizing and sustained-release effects, Eudragit® RS PO and RL PO (methacrylic resins) were selected owing to their high chemical stability, good extrudability, and pH-independent properties [16]. In particular, insoluble but water-dispersible types of Eudragit® RS PO and RL PO were used, separately or in different (w/w) combinations, to prepare dosage forms by HME. Theophylline (TP) and carbamazepine (CBZ) were selected as the water-soluble and insoluble model drugs, respectively.
The PAT initiative from the Food and Drug Administration represents a collaborative effort with industry to introduce new and efficient manufacturing technologies into the pharmaceutical industry [17]. Quality control (QC) using PAT is based on in-process electronic data rather than laboratory testing on a subset of the final product; thus, essentially, the entire production run may be evaluated for QC purposes [17]. PAT can support manufacturing through the QbD principles. QbD aims to design and develop formulations and manufacturing processes that ensure a predefined quality. Thus, QbD requires the understanding of how the formulation and process variables influence the product quality [18].
Fourier transform-infrared (FT-IR) chemical imaging is a powerful non-invasive technique that combines classical spectroscopy with spatial information on the distribution of components within a drug product [19, 20]. The technique provides spatially resolved information based on the chemical composition of the different structural compartments [21]. FT-IR chemical imaging does not require the use of dyes, tags, or stains. Thus, compared with conventional histological techniques, FT-IR chemical imaging of the pharmaceutical dosage forms may simplify the sample preparation procedures and minimize the required sample modification [21]. Thus, FT-IR imaging can be considered as a PAT or QbD tool for drug identification and quantification, visualization of manufacturing problems and process effects on dissolution, and for estimation of the homogeneity of the dosage forms.
The objectives of the present study were (1) to establish robust sustained-release formulations using Eudragit® RS PO and RL PO blends to control the release of water-soluble and insoluble drugs from hot-melt extruded formulations, and (2) to evaluate the feasibility of novel FT-IR chemical imaging as a PAT or QbD tool in comparison that of the content uniformity data determined by high-performance liquid chromatography (HPLC).
MATERIALS AND METHODS
Materials
Eudragit® RS PO (ammonium methacrylic copolymer, type A NF) and RL PO (ammonium methacrylic copolymer, type B NF) were kindly provided by Evonik Industries (Piscataway, NJ). TP was provided by Teva Pharmaceutical Industries Ltd (Woodcliff, NJ) and micronized CBZ was purchased from Acros Organics (Pittsburgh, PA). The solvents used were of HPLC grade. All other chemicals were of analytical grade.
Preparation of HME formulation containing TP or CBZ
Batches (100 g) of various formulations with Eudragit® RS PO and/or RL PO (individually or in combination at different ratios) that contained TP (10–30%) and CBZ (10–30%) were extruded (Table I) with barrel temperatures ranging from 140–150 °C and a screw speed of 80 rpm by using a lab-scale twin-screw hot-melt extruder (Prism 16 mm EuroLab, Thermo Fisher Scientific). Prior to each run of HME, the required materials were sieved through a USP #30 (600 µm) mesh, accurately weighed, and transferred to a twin-shell V-blender (The Patterson-Kelly Co. Inc., East Stroudsburg, PA). The extrudates were cooled to room temperature, milled using a comminuting mill (Fitzpatrick, Model ″L1A″), and then passed through a 30-mesh sieve to obtain either granules or pellets.
Table I.
10% or 30 % drug-loaded formulations (w/w %)
| No.1 | No.2 | No.3 | No.4 | No.5 | No.6 | No.7 | No.8 | No.9 | No.10 | |
|---|---|---|---|---|---|---|---|---|---|---|
| API (TP or CBZ) | 10 | 10 | 10 | 10 | 10 | 30 | 30 | 30 | 30 | 30 |
| RS PO | 90 | 60 | 45 | 30 | 0 | 70 | 46 | 35 | 24 | 0 |
| RL PO | 0 | 30 | 45 | 60 | 90 | 0 | 24 | 35 | 46 | 70 |
Physicochemical properties
Thermogravimetric analysis (TGA; Pyris 1 TGA Perkin Elmer, Waltham, MA) was used to determine the thermal stability of the pure TP, CBZ, Eudragit® RS PO and RL PO, and the physical mixtures at the temperatures required for melt-extrusion processing. During TGA, each of the weighed samples was heated from 25 °C to 200 °C at a rate of 20 °C/min in a platinum pan under an inert nitrogen atmosphere purge of 20 mL/min. The samples were held at 150 °C for 5 min to simulate and exceed the thermal stresses encountered during HME.
A Diamond differential scanning calorimeter (DSC) (Perkin-Elmer, Waltham, MA) was used to study the crystallinity of both drugs and to characterize the drug miscibility in the extrudate formulations. The thermograms of pure TP, pure CBZ, Eudragit® RS PO and RL PO, and hot-melt extrudates were obtained by scanning from 30–300 °C with a scan rate of 5 °C/min. The samples (3–4 mg) were weighed in a standard open aluminum pan using an empty pan as a reference. Nitrogen was used as the purge gas. The calibration of the temperature and heat flow was performed using indium.
A D5005 diffractometer (Bruker, Germany) using Cu-K radiation at a voltage of 40 kV, 50 mA, was used to investigate the powder X-ray diffraction (PXRD) patterns of all samples: pure TP, pure CBZ, Eudragit® RS PO and RL PO, and hot-melt extrudates. The samples were scanned from 5° to 60° with increments of 0.02° (diffraction angle 2θ) at 1 s/step using a zero-background sample holder.
Drug release study
Drug release studies were performed by filling the milled extrudates into capsules by using a USP II paddle method equipped with an Autoplus™ & MultiFill™ autosampler (Hanson Research, Chatsworth, CA). For TP, the dissolution medium of 900 mL of deaerated deionized water was maintained at a constant temperature of 37 ± 0.5 °C. The rate of the rotating paddle was 50 rpm. The dissolution method for “Theophylline Tablets” (USP 36-NF 31) was adopted. For CBZ, 900 mL of deaerated deionized water containing 1% sodium lauryl sulfate (SLS) was used and the paddle speed was 75 rpm. The dissolution method for “Carbamazepine Tablets” (USP 36-NF 31) was employed.
Furthermore, the formulations that contained both drugs were tested in gastric fluid (pH 1.2) for 2 h followed by intestinal fluid (pH 6.8) for 10 h to check the pH-dependency of the release of the extrudates [3]. Six samples were taken at 1-, 2-, 4-, 8-, and 12-h time points, and the concentration of the active pharmaceutical ingredients (APIs) was measured by HPLC at the wavelength indicated by the USP (USP36-NF31).
Content uniformity study
The term “content uniformity” is defined as the degree of uniformity of the amount of the drug substance among the dosage units. Extrudates containing TP (10 mg) or CBZ (20 mg) were accurately weighed, dissolved in 100 mL of the mobile phase, and mixed. The mixtures were then assayed using an appropriate analytical method. All experiments were carried out 10 times.
HPLC analysis for determination of drugs
A Waters Alliance 2695 HPLC system (Milford, MA) with a 996 Photodiode Array (PDA) detector and Empower® was used to analyze TP and CBZ. To analyze TP, a Waters Symmetry Shield RP18 Column, 100 Å, (5 µm, 4.6 mm × 150 mm) was used with the UV detector set at a wavelength of 254 nm. The mobile phase consisted of water:MeOH:glacial acetic acid (64:35:1, v/v) at a flow rate of 1 mL/min. For the assay of CBZ, the same column was used; however, UV detection was performed at a wavelength of 230 nm. The mobile phase consisted of water:MeOH:methylene chloride (55:41:4, v/v) at a flow rate of 1.5 mL/min. The entire solution was filtered using a 0.45-µM membrane filter (Millipore Corp., Bedford) and degassed before HPLC.
FT-IR and mid-infrared chemical imaging
An FT-IR spectrophotometer (Cary 660 FT-IR, Agilent Technologies, Santa Clara, CA) was used. The spectral scan was conducted in the wavelength 500–4000 cm−1 with a resolution of 2 cm−1. The APIs, Eudragit® RS PO and RL PO, and milled hot-melt extrudates (approximate size: 200–300 µm) were tested to confirm the interaction between the API and polymer. Chemical imaging was conducted using an infrared microscope (Agilent Technologies Cary 620 IR, Santa Clara, CA) equipped with a 64 × 64 pixel focal plane array (FPA), with and without a germanium micro-ATR.
RESULTS AND DISCUSSION
Properties of HME formulations containing TP or CBZ
Each drug and polymer blend (individually or in combination at different ratios) was extrudable at the employed processing conditions (Table I). TGA studies confirmed the thermal stability of the drugs and polymers (individually or in combination at different ratios) at the utilized extrusion temperatures (data not shown). Less than 1% decrease was observed at approximately 100 °C owing to water evaporation. No further degradation or mass decrease was observed in 100–200 °C range.
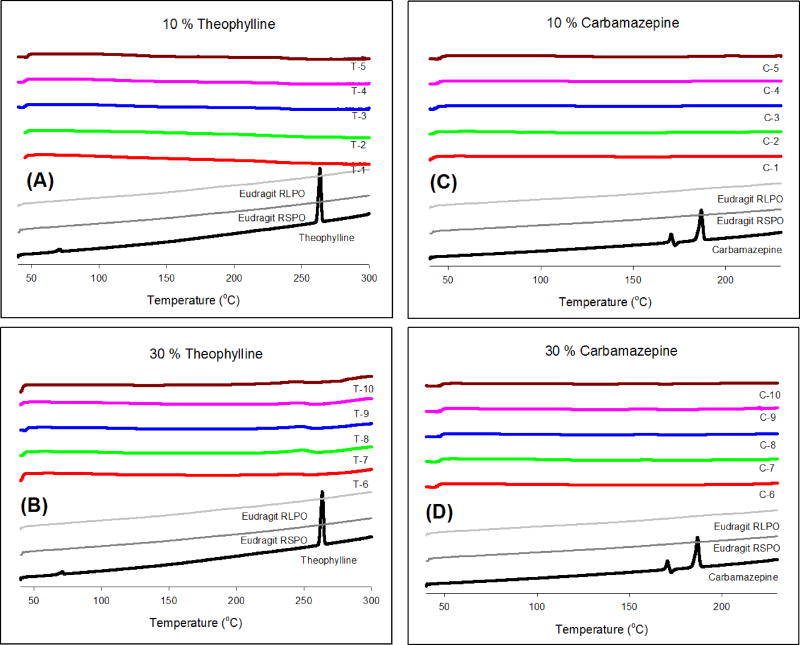
Fig. 1 shows the DSC thermograms of pure TP, pure CBZ, Eudragit® RS PO and RL PO, and the extrudates. The endothermic peaks for TP and CBZ were observed at 270 °C and 190 °C, which corresponded to the melting points of the APIs, respectively. Eudragit® RS PO and RL PO appeared as amorphous materials without characteristic peaks in the thermogram. DSC studies of the milled extrudates confirmed the amorphous form of both drugs within the extrudates.
Figure 1.
DSC thermograms of pure API, Eudragit® RS PO and RL PO, and hot-melt extrudates; (A) 10% TP, (B) 30% TP, (C) 10% CBZ, and (D) 30% CBZ.
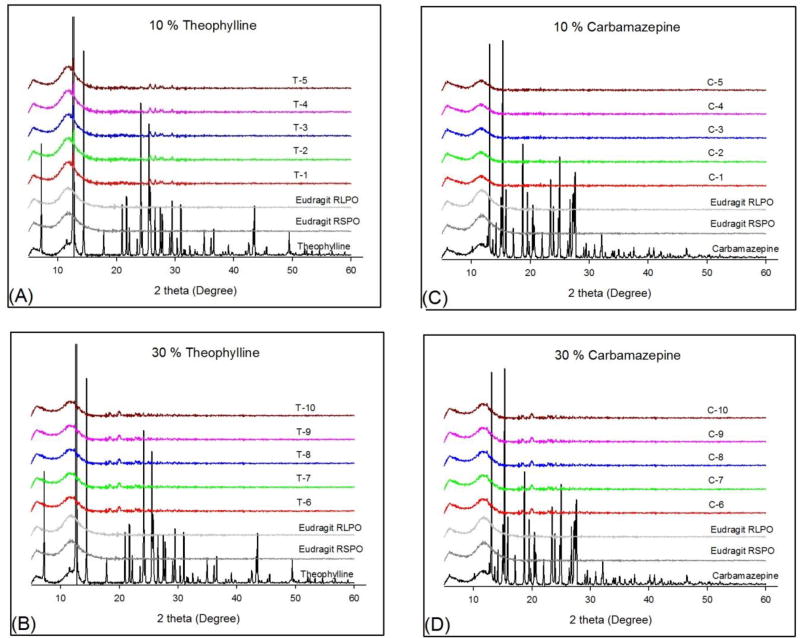
The PXRD diffraction patterns of pure TP, pure CBZ, Eudragit® RS PO and RL PO, and all the extrudates are shown in Fig. 2. The pure crystalline APIs, TP and CBZ, are characterized by prominent diffraction peaks in the range of 5–50° in PXRD analysis. The crystalline form of both APIs changed into an amorphous form in the hot-melt extrudates or was dispersed molecularly within the polymer regardless of the water solubility of the API and the amount of drug loading.
Figure 2.
PXRD patterns of pure API, Eudragit® RS PO and RL PO, and hot-melt extrudates; (A) 10% TP, (B) 30% TP, (C) 10% CBZ, and (D) 30% CBZ.
Drug release study
The two polymers used in this study, Eudragit® RS PO and RL PO, have very similar characteristics. Eudragit® RL PO and RS PO are copolymers of ethyl acrylate and methyl methacrylate, with a low content of methacrylic acid ester with quaternary ammonium groups. These polymers are water-insoluble and exhibit a pH-independent release. The only difference is in the content of the ammonium functional group, which is present as a salt and controls the permeability of the polymers [4].
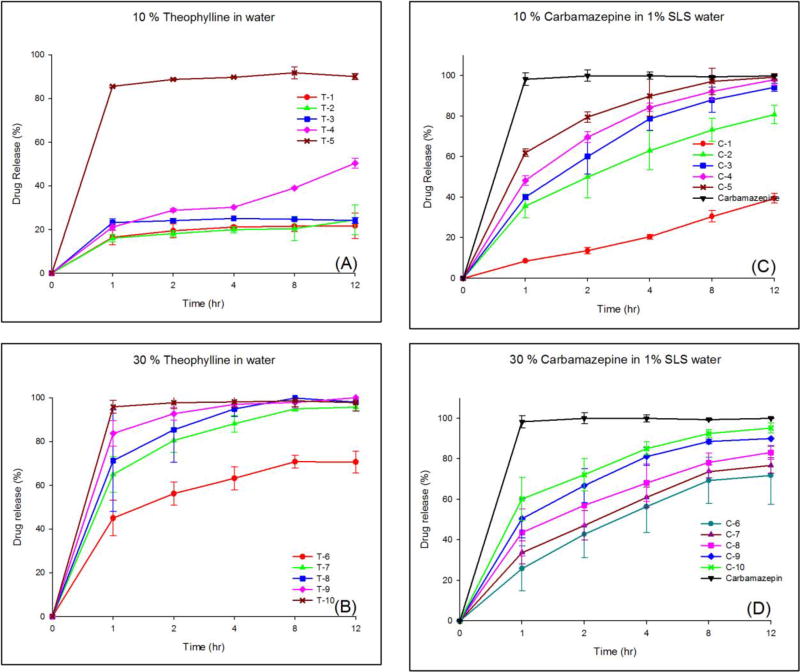
The results of the release studies of TP and micronized CBZ from the different hot-melt extrudates are illustrated in Fig. 3. An increase in the ratio of Eudragit® RL PO increased the drug release regardless of the loading amount of the API or the type of the API. As shown in Fig. 3-(A), only T-5 (highest portion of RL PO) showed the desired drug release profile. It appears that TP was markedly encapsulated in the extrudates and Eudragit® RS PO hindered the contact between TP and the dissolution media. However, when the drug loading was increased to 30% or surfactant was added in the dissolution media, tailored drug release was obtained. Fig. 3-(B) shows biphasic drug release behaviors for all formulations. It appears that hydrophilic TP on or near the surface in the extrudates leached out quickly owing to the affinity with water, whereas the remainder of the TP in the extrudate, which was well entrapped with hydrophobic polymer, was controlled by the mechanism of diffusion. Thus, an increase the ratio of Eudragit® RL PO (high-permeability polymer) increased the in vitro drug release, whereas an increase in the ratio of Eudragit® RS PO (low-permeability polymer) sustained the drug release for up to 12 h.
Figure 3.
Drug release profiles; (A) 10% TP extrudates in water, (B) 30% TP extrudates in water, (C) 10% CBZ extrudates in 1% SLS, and (D) 30% CBZ extrudates in 1% SLS.
In contrast, when 1% SLS was added to the dissolution media, drug release behavior was similar regardless of the drug loading amounts in the range of 10–30% (Fig. 3-(C) and (D)). However, the drug release was well controlled owing to the presence of Eudragit® RL PO and RS PO. In particular, Fig. 3-(D) shows the ideal drug release profile. The desired drug release profiles can be achieved easily through control of the amounts of each polymer.
Content uniformity study
Content uniformity is required to ensure good quality of the finished products. The HME process involves intense mixing and agitation, which results in a more uniform dispersion of the drug particles and good content uniformity in the post-processing of the drug content of the extruded product [11, 22, 23].
A content uniformity test of a dosage unit should be conducted to ensure the proper distribution and homogeneity of the APIs. Therefore, various pharmacopoeias, including the US Pharmacopoeia (USP), the European Pharmacopoeia (EP), and the Japanese Pharmacopoeia (JP), have designed and provided such a test. The new criteria from the USP <905> “Uniformity of Dosage Units” complemented the corresponding texts in the EP and JP. To ensure the consistency of dosage units, each unit in a batch should have drug content within a narrow range of the label claim. Dosage units are defined as dosage forms containing a single, or partial dose, of the drug substance in each entity [24]. The test for content uniformity of preparations presented in dosage units is based on the assay of the individual content of the drug substance(s) in a number of dosage units to determine whether the individual content is within the set limits. According to <905> “Uniformity of Dosage Units”, a content uniformity study should be conducted when the dose is below 25 mg or 25% of dose and ratio of drug substance. The acceptance value for the dosage units should be less than or equal to 15% [25, 26] and the relative standard deviation (RSD) value should be less than or equal to 6% [27].
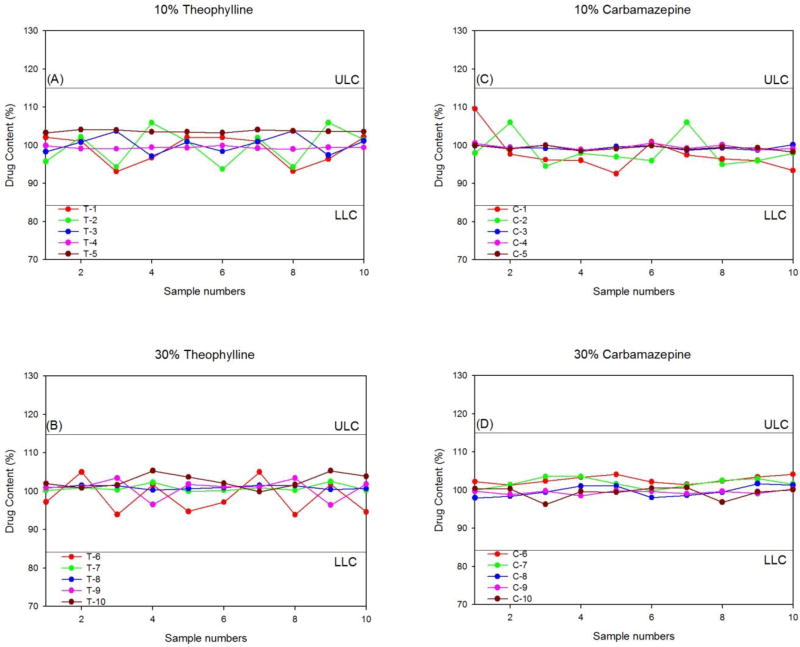
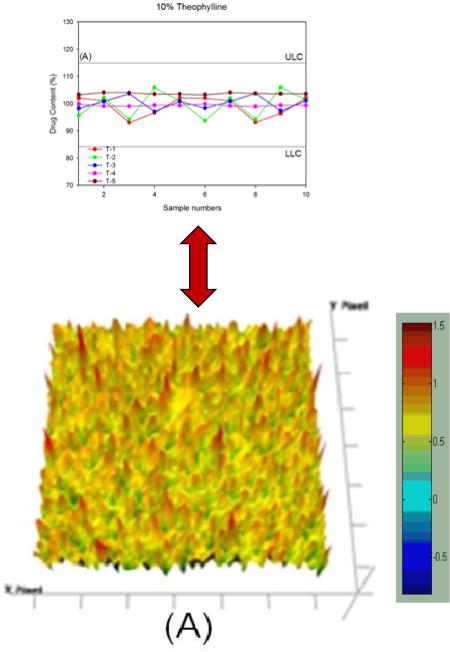
Fig. 4 shows the individual distribution of the API content. In accordance with the USP criteria, the upper limit concentration (ULC) was set at 115% and the lower limit concentration (LLC) was set at 85%. All extrudates were within the specifications of the content uniformity study. Particularly, the 30% drug-loaded extrudates showed a very narrow distribution of APIs (97–103%). The results obtained in this study showed that the HME process with Eudragit® RS PO and RL PO provided very high homogeneity regardless of the API water solubility and the drug loading amount. A correlation between the content uniformity and therapeutic efficacy has been reported [28, 29].
Figure 4.
Content uniformity of hot-melt extrudates; (A) 10% TP, (B) 30% TP, (C) 10% CBZ, and (D) 30% CBZ.
PAT and QbD by FT-IR imaging
The use of FT-IR imaging has increased in biomedical spectroscopy [21, 30]. However, the FT-IR imaging technique can also be used for QbD and PAT. FT-IR imaging provides a practical chemical imaging technique and a visual distribution, as well as the concentration of the chemical components according to their unique spectroscopic signature. In 2004, the FDA published guidance on PAT, which included information about the in-process control and blend uniformity analysis [31, 32]. FT-IR is one of the leading PAT tools for monitoring the powder blend uniformity [33–35]. A major advantage of using PAT tools, especially spectroscopy-based process analyzers, is that the results can be directly predicted by the establishment of a statistical relationship between the measured signals and the reference analysis. Furthermore, since FT-IR micro-spectroscopy is a computer-based digital technique, the procedure of tissue evaluation can be automated. Based on validated databases of the tissue spectra, we can achieve an objective diagnosis of the pathological states of tissues. However, many factors influence the final product and quality parameters [36]. Before analysis using FT-IR imaging, the selection of a unique spectroscopic wavelength in FT-IR is very important to distinguish the exact image.
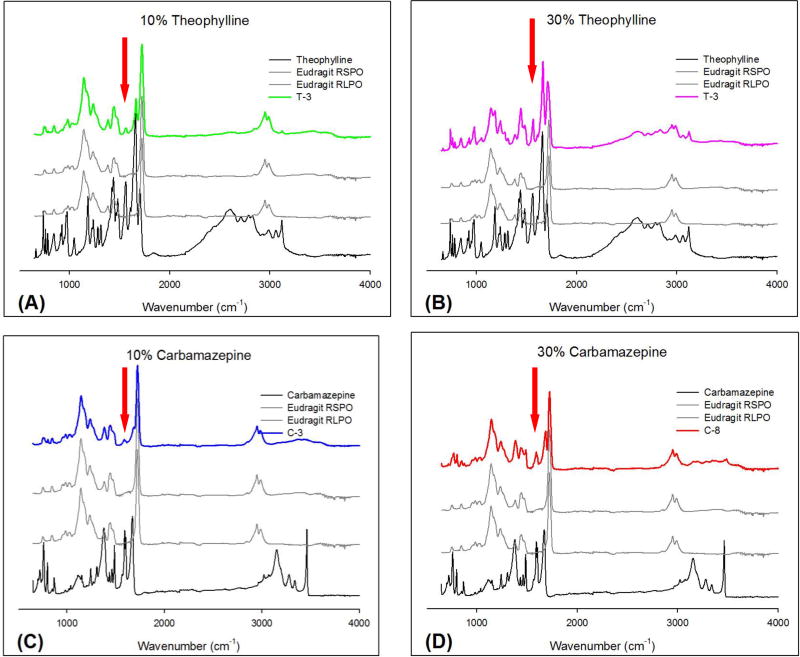
Fig. 5 demonstrates a typical formulation, which contains 1:1 RS PO and RL PO extrudates. Regardless of the drug loading amount and different API properties, the FT-IR spectrum was similar. The specific wavelength should be selected such that it corresponds to the API but not to the polymers. Accordingly, the bands at 1568 and 1667 cm−1 were selected as specific bands for TP, and the bands at 1605 and 1677 cm−1 were used for CBZ. However, the bands at 1667 cm−1 for TP and 1677 cm−1 for CBZ were too close to the band for Eudragit® RS PO and RL PO. Therefore, the wavelengths of 1568 and 1605 cm−1 were chosen as representative bands for TP and CBZ, respectively. If the chosen band appeared in the extrudates, it was indicative of the presence of the API. The band at 1568 cm−1 corresponded to a C=O vibration [37] and the band at 1605 cm−1 corresponded to a CO vibration and a –NH deformation [38].
Figure 5.
FT-IR spectra and peaks used for the imaging of pure APIs, Eudragit® RS PO and RL PO, and hot-melt extrudates; (A) T3 formulations (10% TP), (B) T8 formulations (30% TP), (C) C3 formulations (10% CBZ), and (D) C8 formulations (30% CBZ).
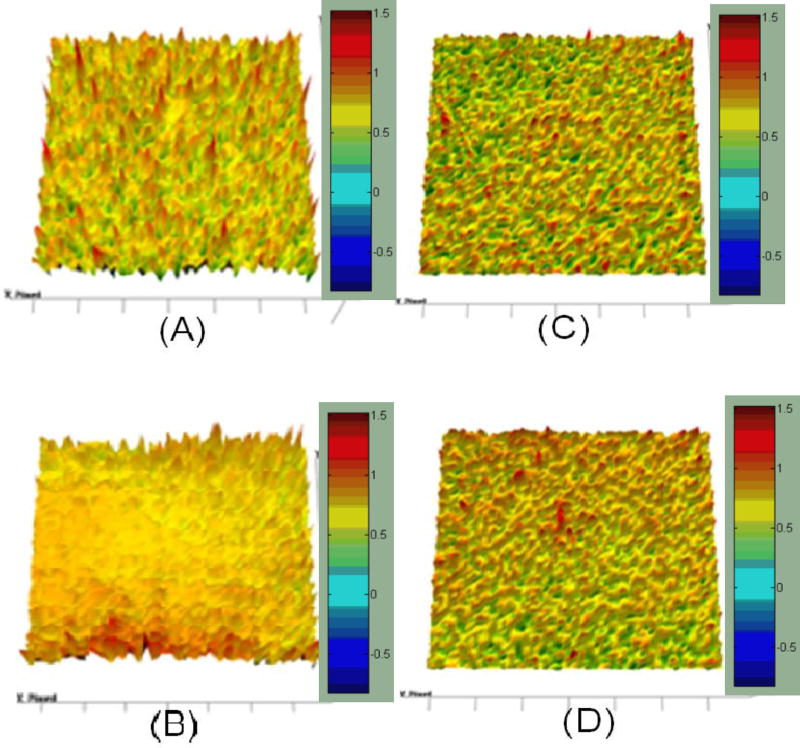
At the selected wavelength, the chemical image was captured and integrated (Fig. 6). The results of the imaging were represented using colors. Red color specified a greater amount of the API and light-blue area represented a lack of the API. In this study, it is obvious that good homogeneity of TP and CBZ in the polymeric carrier was achieved, as indicated by the relatively modest intensity of C=O vibration at 1568 cm−1 and CO vibration and –NH deformation at 1605 cm−1 in the captured images. Chemical imaging clearly demonstrated the drug content uniformity and distribution for both APIs within the extrudates (Fig. 4 and 6), which seemed to correspond well with the content uniformity data obtained by HPLC. Thus, FT-IR imaging can potentially be used for PAT, as demonstrated in this study.
Figure 6.
FT-IR imaging of hot-melt extrudates; (A) T3 formulations (10% TP), (B) T8 formulations (30% TP), (C) C3 formulations (10% CBZ), and (D) C8 formulations (30% CBZ).
CONCLUSIONS
Melt-extruded formulations of TP and CBZ with varying ratios of Eudragit® RS PO and RL PO can be employed to tailor the drug release profiles. The content uniformity and distribution of the API within the extrudates were analyzed by FT-IR chemical imaging and correlated well with the results of the HPLC analysis. Furthermore, by utilizing QbD or PAT, drug release from Eudragit® RS PO and RL PO combinations can be optimized for inline processing, not only for these polymer/API combinations, but also potentially for many other pharmaceutical formulations in the development pipeline, for the study of the release profile and content uniformity and distribution of the API.
Acknowledgments
The authors thank the Pii Center for Pharmaceutical Technology for their contribution to this project. This work was funded by the National Institute of General Medical Sciences (NIGMS), a component of NIH (Grant Number: P20GM104932).
References
- 1.Pritchard EM, Szybala C, Boison D, Kaplan DL. Silk fibroin encapsulated powder reservoirs for sustained release of adenosine. Journal of controlled release. 2010;144(2):159–167. doi: 10.1016/j.jconrel.2010.01.035. [DOI] [PMC free article] [PubMed] [Google Scholar]
- 2.Ochoa L, Igartua M, Hernández RM, Solinís MÁ, Gascón AR, Pedraz JL. In vivo evaluation of two new sustained release formulations elaborated by one-step melt granulation: Level A in vitro–in vivo correlation. European Journal of Pharmaceutics and Biopharmaceutics. 2010;75(2):232–237. doi: 10.1016/j.ejpb.2010.02.008. [DOI] [PubMed] [Google Scholar]
- 3.Tran HTT, Park JB, Hong K-H, Choi H-G, Han H-K, Lee J, Oh KT, Lee B-J. Preparation and characterization of pH-independent sustained release tablet containing solid dispersion granules of a poorly water-soluble drug. International journal of pharmaceutics. 2011;415(1):83–88. doi: 10.1016/j.ijpharm.2011.05.052. [DOI] [PubMed] [Google Scholar]
- 4.Wadher KJ, Kakde RB, Umekar J. Formulation and Evaluation of Sustained Release Matrix Tablets of Metformin Hydrochloride Using pH Dependent and pH Independent Methacrylate Polymers. British Journal of Pharmaceutical Research. 2011;1(2):29–45. [Google Scholar]
- 5.Park J, Lim J, Kang C, Lee B. Drug Release-Modulating Mechanism of Hydrophilic Hydroxypropylmethylcellulose Matrix Tablets: Distribution of Atoms and Carrier and Texture Analysis. Current drug delivery. 2013;10(6):732–741. doi: 10.2174/156720181006131125155652. [DOI] [PubMed] [Google Scholar]
- 6.Park J-B, C-Y Kang, Kang W-S, H-G Choi, H-K Han, B-J Lee. New investigation of distribution imaging and content uniformity of very low dose drugs using hot-melt extrusion method. International journal of pharmaceutics. 2013 doi: 10.1016/j.ijpharm.2013.10.027. [DOI] [PubMed] [Google Scholar]
- 7.Patil H, Tiwari RV, Repka MA. Hot-Melt Extrusion: from Theory to Application in Pharmaceutical Formulation. AAPS PharmSciTech. 2016;17(1):20–42. doi: 10.1208/s12249-015-0360-7. [DOI] [PMC free article] [PubMed] [Google Scholar]
- 8.Tiwari RV, Patil H, Repka MA. Contribution of hot-melt extrusion technology to advance drug delivery in the 21st century. Expert Opin Drug Deliv. 2016;13(3):451–64. doi: 10.1517/17425247.2016.1126246. [DOI] [PubMed] [Google Scholar]
- 9.Repka MA. HOT MELT EXTRUSION-Hot-Melt Extrusion. American Pharmaceutical Review. 2009;12(6):18. [Google Scholar]
- 10.Repka MA, Battu SK, Upadhye SB, Thumma S, Crowley MM, Zhang F, Martin C, McGinity JW. Pharmaceutical applications of hot-melt extrusion: Part II. Drug development and industrial pharmacy. 2007;33(10):1043–1057. doi: 10.1080/03639040701525627. [DOI] [PubMed] [Google Scholar]
- 11.Repka MA, Majumdar S, Kumar Battu S, Srirangam R, Upadhye SB. Applications of hot-melt extrusion for drug delivery. Expert Opin. Drug Deliv. 2008;5(12):1357–1376. doi: 10.1517/17425240802583421. [DOI] [PMC free article] [PubMed] [Google Scholar]
- 12.Crowley MM, Schroeder B, Fredersdorf A, Obara S, Talarico M, Kucera S, McGinity JW. Physicochemical properties and mechanism of drug release from ethyl cellulose matrix tablets prepared by direct compression and hot-melt extrusion. Int J Pharm. 2004;269(2):509–22. doi: 10.1016/j.ijpharm.2003.09.037. [DOI] [PubMed] [Google Scholar]
- 13.Young CR, Koleng JJ, McGinity JW. Production of spherical pellets by a hot-melt extrusion and spheronization process. International journal of pharmaceutics. 2002;242(1):87–92. doi: 10.1016/s0378-5173(02)00152-7. [DOI] [PubMed] [Google Scholar]
- 14.Alshehri SM, Park JB, Alsulays BB, Tiwari RV, Almutairy B, Alshetaili AS, Morott J, Shah S, Kulkarni V, Majumdar S, et al. Mefenamic acid taste-masked oral disintegrating tablets with enhanced solubility via molecular interaction produced by hot melt extrusion technology. J Drug Deliv Sci Technol. 2015;27:18–27. doi: 10.1016/j.jddst.2015.03.003. [DOI] [PMC free article] [PubMed] [Google Scholar]
- 15.Alsulays BB, Park JB, Alshehri SM, Morott JT, Alshahrani SM, Tiwari RV, Alshetaili AS, Majumdar S, Langley N, Kolter K, et al. Influence of Molecular Weight of Carriers and Processing Parameters on the Extrudability, Drug Release, and Stability of Fenofibrate Formulations Processed by Hot-Melt Extrusion. J Drug Deliv Sci Technol. 2015;29:189–198. doi: 10.1016/j.jddst.2015.07.011. [DOI] [PMC free article] [PubMed] [Google Scholar]
- 16.Ceballos AM, Cirri F, Maestrelli G, Corti P, Mura Influence of formulation and process variables on in vitro release of theophylline from directly-compressed Eudragit matrix tablets. Il Farmaco. 2005;60(11):913–918. doi: 10.1016/j.farmac.2005.07.002. [DOI] [PubMed] [Google Scholar]
- 17.Yu LX, Lionberger RA, Raw AS, D'Costa R, Wu H, Hussain AS. Applications of process analytical technology to crystallization processes. Advanced Drug Delivery Reviews. 2004;56(3):349–369. doi: 10.1016/j.addr.2003.10.012. [DOI] [PubMed] [Google Scholar]
- 18.Puchert T, Holzhauer C-V, Menezes J, Lochmann D, Reich G. A new PAT/QbD approach for the determination of blend homogeneity: Combination of on-line NIRS analysis with PC Scores Distance Analysis (< i>PC-SDA</i>) European Journal of Pharmaceutics and Biopharmaceutics. 2011;78(1):173–182. doi: 10.1016/j.ejpb.2010.12.015. [DOI] [PubMed] [Google Scholar]
- 19.Boskey A, Pleshko Camacho N. FT-IR imaging of native and tissue-engineered bone and cartilage. Biomaterials. 2007;28(15):2465–2478. doi: 10.1016/j.biomaterials.2006.11.043. [DOI] [PMC free article] [PubMed] [Google Scholar]
- 20.van der Weerd J, Andrew Chan K, Kazarian SG. An innovative design of compaction cell for in situ FT-IR imaging of tablet dissolution. Vibrational spectroscopy. 2004;35(1):9–13. [Google Scholar]
- 21.Lasch P, Haensch W, Naumann D, Diem M. Imaging of colorectal adenocarcinoma using FT-IR microspectroscopy and cluster analysis. Biochimica et Biophysica Acta (BBA)-Molecular Basis of Disease. 2004;1688(2):176–186. doi: 10.1016/j.bbadis.2003.12.006. [DOI] [PubMed] [Google Scholar]
- 22.Aitken-Nichol C, Zhang F, McGinity JW. Hot melt extrusion of acrylic films. Pharmaceutical research. 1996;13(5):804–808. doi: 10.1023/a:1016076306279. [DOI] [PubMed] [Google Scholar]
- 23.Repka MA, Gerding TG, Repka SL, McGinity JW. Influence of plasticizers and drugs on the physical-mechanical properties of hydroxypropylcellulose films prepared by hot melt extrusion. Drug development and industrial pharmacy. 1999;25(5):625–633. doi: 10.1081/ddc-100102218. [DOI] [PubMed] [Google Scholar]
- 24.USP36-NF31. General Chapters: <905>Uniformity of Dosage Units. 2013:431–433. [Google Scholar]
- 25.Bergum JS, Li H. Acceptance limits for the new ICH USP 29 content-uniformity test. 2007 [Google Scholar]
- 26.Cholayudth P. Using Bergum's New Method and MS Excel to Determine the Probability of Passing the New ICH USP 29 Content Uniformity Test. Journal of validation technology. 2008;14(2):62–72. [Google Scholar]
- 27.Kornchankul W, Hamed E, Parikh N, Sakr A. Effect of drug proportion and mixing time on the content uniformity of a low dose drug in a high shear mixer. Die Pharmazie. 2002;57(1):49–53. [PubMed] [Google Scholar]
- 28.Dalby R, Spallek M, Voshaar T. A review of the development of Respimat® Soft Mist™ Inhaler. International journal of pharmaceutics. 2004;283(1):1–9. doi: 10.1016/j.ijpharm.2004.06.018. [DOI] [PubMed] [Google Scholar]
- 29.Ramirez-Mendiola B, Rivera-Espinosa L, Chavez-Pacheco JL, Alemon-Medina R, Bobadilla-Chavez J, Osnaya-Martinez H, Flores-Perez C, Juarez-Olguin H, Flores-Perez J, Garcia-Alvarez R. Stability, content uniformity and therapeutic efficacy of sildenafil extemporaneous capsules. African Journal of Pharmacy and Pharmacology. 2012;6(3):162–168. [Google Scholar]
- 30.Travo A, Piot O, Wolthuis R, Gobinet C, Manfait M, Bara J, Forgue-Lafitte ME, Jeannesson P. IR spectral imaging of secreted mucus: a promising new tool for the histopathological recognition of human colonic adenocarcinomas. Histopathology. 2010;56(7):921–931. doi: 10.1111/j.1365-2559.2010.03563.x. [DOI] [PubMed] [Google Scholar]
- 31.Bakri B, Weimer M, Hauck G, Reich G. Assessment of powder blend uniformity: Comparison of real-time NIR blend monitoring with stratified sampling in combination with HPLC and at-line NIR Chemical Imaging. European Journal of Pharmaceutics and Biopharmaceutics. 2015;97:78–89. doi: 10.1016/j.ejpb.2015.10.002. [DOI] [PubMed] [Google Scholar]
- 32.Barresi AA, Fissore D, Marchisio DL. 20 Process Analytical Technology in Industrial Freeze-Drying. Freeze Drying/Lyophilization of Pharmaceutical and Biological Products. 2016:460. [Google Scholar]
- 33.Ewing AV, Wray PS, Clarke GS, Kazarian SG. Evaluating drug delivery with salt formation: Drug disproportionation studied in situ by ATR-FTIR imaging and Raman mapping. Journal of pharmaceutical and biomedical analysis. 2015;111:248–256. doi: 10.1016/j.jpba.2015.03.040. [DOI] [PubMed] [Google Scholar]
- 34.Severino P, da Silva CF, da Silva MA, Santana MH, Souto EB. Chitosan Cross-Linked Pentasodium Tripolyphosphate Micro/Nanoparticles Produced by Ionotropic Gelation. Sugar Tech. 2016;18(1):49–54. [Google Scholar]
- 35.Witting M, Boreham A, Brodwolf R, Vávrová Ki, Alexiev U, Friess W, Hedtrich S. Interactions of hyaluronic acid with the skin and implications for the dermal delivery of biomacromolecules. Molecular pharmaceutics. 2015;12(5):1391–1401. doi: 10.1021/mp500676e. [DOI] [PubMed] [Google Scholar]
- 36.An FP, Balantekin AB, Band HR, Beriguete W, Bishai M, Blyth S, Brown RL, Butorov I, Cao GF, Cao J, et al. Spectral measurement of electron antineutrino oscillation amplitude and frequency at Daya Bay. Phys Rev Lett. 2014;112(6):061801. doi: 10.1103/PhysRevLett.112.061801. [DOI] [PubMed] [Google Scholar]
- 37.Marian E, Jurca T, Kacso I, Borodi G, Bratu I. Structure investigations of some complexes of theophylline with transitional metals. Revista de Chimie (Bucharest, Romania) 2009;60(6):599–608. [Google Scholar]
- 38.Sethia S, Squillante E. Solid dispersion of carbamazepine in PVP K30 by conventional solvent evaporation and supercritical methods. International journal of pharmaceutics. 2004;272(1):1–10. doi: 10.1016/j.ijpharm.2003.11.025. [DOI] [PubMed] [Google Scholar]


