

Abstract
Stable, high-resolution intravital imaging of the lung has become possible through the utilization of vacuum-stabilized imaging windows. However, this technique is extremely invasive and limited to only hours in duration. Here we describe a minimally invasive, permanently implantable window for high-resolution intravital imaging of the murine lung that allows the mouse to survive surgery, recover from anesthesia, and breathe independently. Compared to vacuum-stabilized windows, this window produces the same high-quality images without vacuum-induced artifacts; it is also less invasive, which allows imaging of the same lung tissue over a period of weeks. We further adapt the technique of microcartography for reliable relocalization of the same cells longitudinally. using commonly employed experimental, as well as more clinically relevant, spontaneous metastasis models, we visualize all stages of metastatic seeding, including: tumor cell arrival; extravasation; growth and progression to micrometastases; as well as tumor microenvironment of metastasis function, the hallmark of hematogenous dissemination of tumor cells.
Imaging in both medicine and research has proven to be crucial to understanding the structure and function of many tissues in health and disease. Clinical imaging modalities (PET, MRI, CT, etc.) allow a view of whole organs noninvasively. However, the low spatial resolution of these modalities prevents visualization of the earliest stages of disease onset and determination of cause-and-effect relationships among cells during tumor progression. Understanding these earliest stages and cause-and-effect relationships may provide new opportunities for therapeutic intervention.
Optical imaging modalities (e.g., confocal and multiphoton imaging) can detect and image tissues with single-cell resolution. However, imaging of internal organs, particularly those of the thoracic cavity, presents several challenges that arise from both the inaccessibility and constant motion of these organs. One organ of particular interest is the lung, the site of many pathologies, including acute sickle cell crisis, lung cancer, asthma, and metastatic disease.
Recent technological advancements have enabled subcellular-resolution optical imaging of the murine lung over periods of up to 12 h1,2. These techniques have provided the first high-resolution images of the living, breathing lung. They accomplish this by mechanically ventilating the animal, resecting the ribcage, and immobilizing the lung tissue using vacuum.
As such, they are extremely invasive, terminal surgeries which are limited in duration and do not allow more than one imaging session. This prevents their application to processes such as spontaneous metastatic progression that take longer than 12 h to manifest. In addition, there may be artifacts associated with vacuum immobilization of the lung such as compression of blood vessels, which affects vascular flow1,2. Having the ability to perform high-resolution optical imaging in metastatic sites such as the lung (the most common site of metastasis in breast cancer) over days to weeks would enable the study and identification of commonalities between metastases and the primary tumors from which they derive, identification of the mechanism by which premetastatic niche formation affects the fate of tumor cells in the lung, and the observation of differences between experimental and spontaneous lung metastatic seeding and progression.
Here we present a minimally invasive3 window for high-resolution imaging of the lung (WHRIL), which allows repeated optical imaging over a period of days to weeks without the need for mechanical ventilation1, high-speed gated imaging4, or complex image processing postacquisition5. The technique creates a ‘transparent ribcage’ that seals the thoracic cavity and protects the lung tissue and so allows the mouse to completely recover and return to normal activity after surgery and between each imaging session. To easily and reliably relocalize the same microvasculature day after day, we adapt a technique known as microcartography6 to this window.
We demonstrate the utility of the WHRIL by looking at multiple stages of metastatic progression of breast cancer. We do this in both the commonly employed experimental (tail-vein injection) intravital imaging because of researcher’s inability to determine when tumor cells arrive at the lung vasculature with previous techniques. Using these models, we have captured images of cells arriving at the vasculature; and for the first time (to our knowledge), we have captured images of cells crossing the endothelium into the parenchyma. Additionally, we follow these locations as the cells grow into micrometastases and, further, we look in these micrometastases at the presence and function in the lung of the tripartite microanatomical structure, tumor microenvironment of metastasis (TMEM), which was discovered to be responsible for hematogenous dissemination of tumor cells within the primary site7,8.
Results
Design of the window for high-resolution imaging of the lung
The design of the implantable WHRIL is shown in Figure 1a,b. This window is composed of a stainless steel frame with a central aperture that accepts a 5-mm coverslip. A 1.75-mm groove around the circumference allows the window to be inserted snugly between the ribs. A bevel on the thoracic side conforms to the curvature of the lung, and its overall thickness is chosen to be smaller than the working distance of the objective lens (2 mm).
Figure 1.
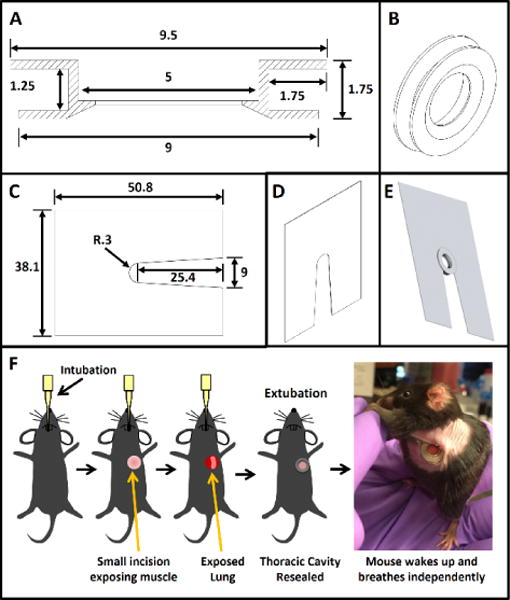
Design of WHRIL and overview of surgical protocol. (a) Computer-aided design of the window frame. All dimensions are listed in millimeters. (b) 3D view of the window frame that shows the beveled, lung-facing side. (c) Computer-aided design of the window-fixturing plate. All dimensions are listed in millimeters. Plate is made of 0.008 in stainless steel shim stock. (d) 3D view of the window-fixturing plate. (e) 3D rendering of the window inserted into the fixturing plate. (f) Overview of the surgical protocol.
Passivation of the steel (see Online Methods) ensures that the window is sterile at the time of implantation and that it remains inert over the duration of use. Passivation is a crucial finishing step that transforms the stainless steel into an inert material that can be safely implanted into the animal, and this prevents corrosion and subsequent inflammatory responses.
Design of the fixturing plate
As described in the surgery section below, the lung tissue itself is isolated from motion caused by breathing and the heartbeat. However, because the WHRIL is part of the ribcage, the window and frame are susceptible to motion of the entire thorax created by the mouse’s inspiration. Minimizing this movement is essential for acquiring high-resolution images, as motion artifacts of even a few microns can blur and distort images. Part of this immobilization is accomplished by securing the window to the stage via a thin fixturing plate (Fig. 1c,d) that is slid between the window’s outer edge and the mouse’s skin. Figure 1e demonstrates how the window is captured by the fixturing plate. Use of an inverted microscope enables the window to be affixed to the xy stage while the thorax and lung tissue are allowed to expand and contract naturally and without any impediment to respiration. This keeps the imaged tissue completely immobilized relative to the microscope objective, allows the use of relatively slow image-acquisition speeds (~1 frame per second (fps)), and obviates the need for gated acquisition or postprocessing.
Minimally invasive surgery
To create a permanent, implantable optical-imaging window that would allow the mouse to breathe independently during imaging, we developed the protocol summarized in Figure 1f and described in detail in the Online Methods section. Briefly, before surgery, mice are anesthetized, and the hair over the left thorax is depilated. Intubation and mechanical ventilation allow the mouse to survive during the brief time the seal of the thoracic cavity is broken. Skin and muscle over the chest wall is excised, and ribs 6 and 7 are partially removed. The window is inserted into the gap in the chest wall and secured with a combination of sutures and adhesive, and this reseals the thoracic cavity and allows the mouse to breathe independently after extubation. Mice over 3 months old are best suited for surgery, as the trachea and ribs are thicker and more durable than in younger mice. If the procedure is performed correctly, the window will become an integral part of the chest wall, and the thoracic cavity will be well sealed with the lung tissue fully adhered to the cover glass. This allows the mouse to live comfortably and to be imaged daily up to the protocol allowance (2 weeks).
Physiological impact of the window for high-resolution imaging of the lung
To determine the effect of the surgery and long-term use of the WHRIL on the physiology of the mouse, we performed a series of experiments looking at reactivity to handling, appearance, behavior, weight, and counts of white and red blood cells9 (Fig. 2a), metrics that were previously used to validate an abdominal imaging window10. As can be seen in Supplementary Video 1, mice are able continue their normal feeding, grooming, and nesting behavior without impediment to their movement.
Figure 2.
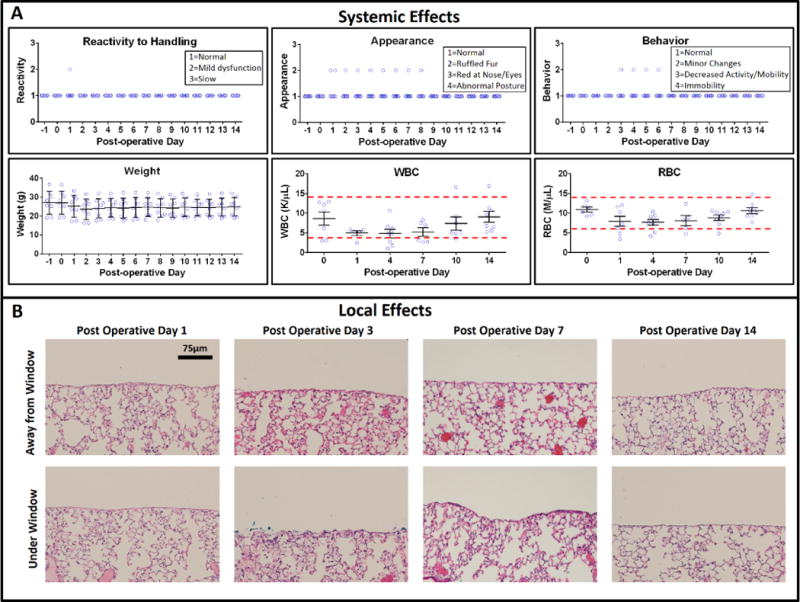
Validation of local and systemic effects of the WHRIL. (a) Systemic effects: six metrics of health were measured over 2 weeks for WHRIL-bearing animals (n = 8). These metrics include measures of the reactivity to handling, physical appearance of the mouse (ruffled fur, posture, etc.), weight, behavior (activity level), and counts of white and red blood cells. Center line and whiskers mark the mean ± s.e.m. (b) Local effects: histological sections stained with H&E, both under and far away from the window.
Overall, we observed only mild alterations in behavior such as ruffled fur (in one out of eight mice) and a slightly elevated white blood cell count (in one other of the eight mice). Across the cohort, there was a slight drop, and partial recovery, in weight and red blood cell count; this drop was less than an s.d.
To test whether the WHRIL causes any tissue damage (e.g., necrotic zones or abnormal lung architecture), we analyzed hematoxylin- and eosin-stained sections of lung tissue located both under the window and away from the window at several different timepoints (Fig. 2b). Independent evaluation by two pathologists identified no regions of necrosis and mild ventilator-induced alveolar distention regardless of association with the window. Focal collections of proteinaceous fluid and occasional reactive pneumocytes were noted in some of the alveoli at postoperative day (POD) 3. These changes were not apparent on POD 7 or 14.
To further evaluate whether any inflammation was induced, we analyzed sections of lung tissue stained with ionized calcium-binding adaptor molecule 1 (IBA1), which is “highly and specifically expressed in a monocytic lineage including microglia and macrophages”11. Macrophages are the best marker for inflammation since they “become the dominant population in prolonged inflammatory reactions”12, peaking in their numbers by 3 d after injury. As shown in Supplementary Figure 1a, no statistically significant increase in macrophages is observed over the 2 weeks of implantation. Example images are shown in Supplementary Figure 1b.
Image quality and comparison to vacuum window
Just as with our previously published vacuum window2, the WHRIL allows the continuous acquisition of stable, high-resolution, time-lapse images of the lung vasculature over multiple time scales extending from minutes to hours. As an example, we have used the WHRIL to capture images of single cells in the healthy lung. Shown in Supplementary Figure 2a are two frames from the raw time-lapse video (see Online Methods) that show macrophages (yellow arrows) resident in the parenchyma and monocytes (yellow arrow heads) circulating through the lung vasculature, which itself has been labeled with a fluorescent high-molecular-weight dextran (red). The high spatial stability of the imaged field allows the application of our previously published blood-averaging technique2, which eliminates the transient disruption of vascular signal that occurs when unlabeled erythrocytes and leukocytes pass through the lumen of the vessels and occlude the fluorescent dextran (Supplementary Fig. 2b). Supplementary Video 2 shows the blood-averaged and raw, unaveraged videos side by side for comparison.
In order to determine the positioning of cells relative to the vasculature (luminal versus abluminal), we used mice in which the endothelial cells were transgenically labeled with fluorescently tagged VE-cadherin (B6.FVB-Tg(Cdh5-cre)7Mlia/J × B6. Cg-Gt(ROSA)26Sortm14(CAG-tdTomato)Hze) (Supplementary Fig. 3). This gives a clear dividing line between the intravascular and the extravascular space that persists even when the blood serum (and hence the fluorescent dextran) is occluded by the presence of a cell in the lumen of the vessel.
Impact on blood flow
To determine the impact of the window on the blood flow right beneath the coverslip, we set out to measure the vascular flow rate by injecting 2.5-μm fluorescent microspheres into the blood stream (see Online Methods) and directly visualizing them using a high-speed confocal microscope (see Supplementary Fig. 4).
The observed values can be directly compared to those presented in Looney et al.1, where they measured the rate of blood flow in the mouse lg vasculature using a vacuum-stabilized imaging window and reported a mean flow rate for small (0.109 ± 0.012 mm/s) and medium-sized (0.11 ± 0.01 mm/s) vessels. Using the formula described in ref.13, these values combine to an average speed of 0.18 ± 0.03 mm/s. A similar comparison can be made to the values provided by Presson et al.5, which, after repeated application of Baker’s formula, yields a mean flow rate of 0.3 ± 0.1 mm/s. The value measured by Looney et al.1 is much lower than our measured mean of 0.34 ± 0.02 mm/s, but it is consistent with that of Presson et al.5 We are able to observe several events of much higher speeds (~1.5–1.6 mm/s) than those reported by either Looney et al.1 or Presson et al.5, which suggests that high flow rates may have been hampered in these reports. Our numbers are consistent, however, with those reported by Hanna et al.14, who observed flow rates as high as ~2 mm/s using insufflation, and not vacuum, for stabilization. However, as these observations were made in the rat, direct comparisons are problematic.
Relocalization of regions of interest within the window
Unlike the previously published lung-imaging windows, the WHRIL offers multiple views into the lung vasculature over days and even weeks. Given that the surface of the lung is a fairly uniform meshwork of nearly identical capillaries and alveoli, relocalization of the same microvasculature day after day is extremely challenging. This is especially so when the mouse is removed from and returned to the microscope stage on consecutive imaging sessions, since arbitrary rotations and translations of the tissue relative to the objective lens occur. To overcome this challenge, we adapted a previously published technique we developed: in vivo microcartography6.
In our prior study, microspheres placed within a dorsal skin fold chamber acted as fiducial marks whose position could be easily located and recorded at the beginning of each imaging session. These marks were then used to create a set of basis vectors and construct a coordinate transformation that allowed relocalization of any point that was previously recorded. The scheme is diagrammatically demonstrated in Figure 3a, where basis vectors (black arrows) formed by the xy stage’s origin (blue dot) and the fiducial marks (black dots) can be defined on sequential imaging sessions (Session 1 and Session 2). In our current implementation, the microspheres are substituted with grooves etched onto the window frame before implantation (Fig. 3b). These grooves serve as the fiducial marks and remain fixed relative to the tissue within the window. Using this technique, we are able to relocate the same microvasculature daily (Fig. 3c). The procedure works reliably and reproducibly, consistently relocating structures. The left-hand plot of Figure 3d demonstrates the x and y repositioning accuracy; 100% of the time, structures are relocated within a single 512 × 512 μm imaging field of view (red box). This same data can be redrawn as a dot plot showing the overall precision of microcartography’s ability to relocate a region of interest (right plot, purple dots). These data can then be directly compared to the relocalization ability in mice bearing lung metastases (right plot, green dots).
Figure 3.
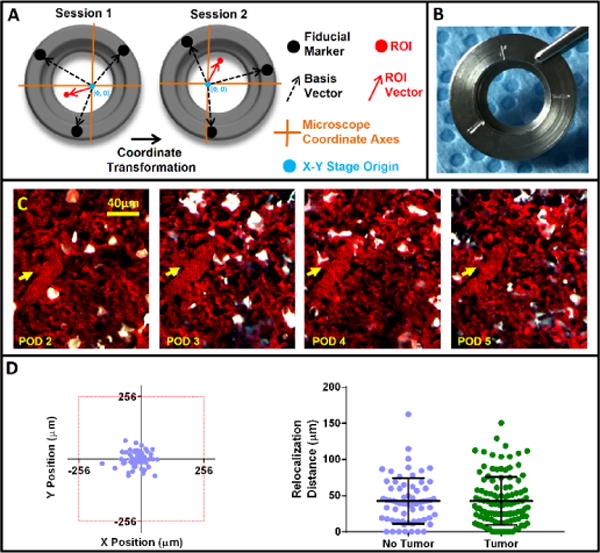
Microcartography enables relocalization of positions within the window day after day. (a) Easily identifiable fiducial marks etched on the window frame (black dots) serve as navigational reference points and, along with the xy stage origin (blue dots), form a set of basis vectors (dashed black arrows) from which a coordinate transformation connecting each imaging session can be derived. This transformation takes into account both rotation and translation of xy stage coordinate axes (orange lines) relative to the mouse from session to session. The derived transformation can then be used to predict the coordinates of any previously measured location (red dot). (b) Picture of the window with etched fiducial marks. (c) Multiphoton images of a single optical section in the lung that show the same microvasculature relocated using microcartography over 4 d (consecutive days). Yellow arrows indicate the location of same microvessel branch point each day. (d) Reproducibility of microcartography. Left: scatter plot (n = 65 fields of view) showing the ability of microcartography to relocalize a region of interest to within a single 512 × 512 μm field of view (red box). Right, graph showing the precision of microcartography’s ability to relocate a region of interest in both healthy (purple, n = 65 fields of view; mean = 42.7 ± 31.4 μm s.e.m) and tumor-bearing lung tissue (green, n = 113 fields of view; mean = 42.8 ± 33.3 μm s.e.m).
Imaging of metastatic cancer cells in the lung
In order to demonstrate the utility of the WHRIL, we imaged multiple stages of metastatic progression of breast cancer in the lung in both experimental and spontaneous metastasis models.
Using the WHRIL, we captured high-resolution, real-time images of single cells as they arrive at the vascular bed of the lung (Fig. 4a and Supplementary Video 3) and cross the endothelium (Fig. 4b,c; Supplementary Fig. 5; and Supplementary Videos 4 and 5). The high resolution of this technique is sufficient to capture motion of subcellular organelles. For instance, Figure 5a and Supplementary Video 6 show unlabeled organelles, potentially condensed DNA, moving in a pattern characteristic of chromosomal separation during cell division.
Figure 4.
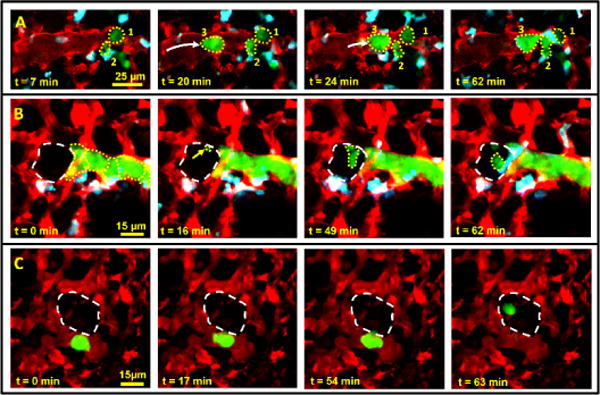
The WHRIL allows visualization of tumor cell arrival (a) and extravasation in both experimental (b) and spontaneous (c) metastasis models. (a) Stills from a time-lapse video that show individual tumor cells (numbers 1, 2 and 3; dotted yellow outlines) arriving in the lung vasculature after intravenous injection. The frame at t = 7 min shows two tumor cells residing in the vasculature. At 20 min, a third tumor cell arrives. By 62 min, the three cells form a cluster in the vasculature. (b) Stills from a time-lapse intravital imaging video of experimentally metastasized (tail-vein injected) tumor cells (dotted yellow outlines) lodged in the vasculature ~60 min after tail-vein injection. 16 min after the start of imaging, an invasive protrusion (yellow arrow and small dotted outline) can be seen crossing the endothelium into the alveolus (large dashed white outline). Extravasation of the tumor cell has completed by t = 62 min. Images are a z projection of three optical sections taken 3 μm apart and processed with the blood-averaging algorithm so as to better determine the boundaries of the vasculature. Raw image data from a single optical section are shown in supplementary Figure 5a and supplementary Video 5. (c) Stills from a time-lapse intravital imaging video of a spontaneously metastasizing tumor cell in the vasculature 1 d after window implantation. The cell crosses the endothelium into the alveolar space (dashed white outline) by t = 63 min. Images are a z projection of two optical sections taken 3 μm apart and processed with the blood-averaging algorithm so as to better determine the boundaries of the vasculature. Image data without blood averaging from a single optical section are shown in supplementary Figure 5c.
Figure 5.
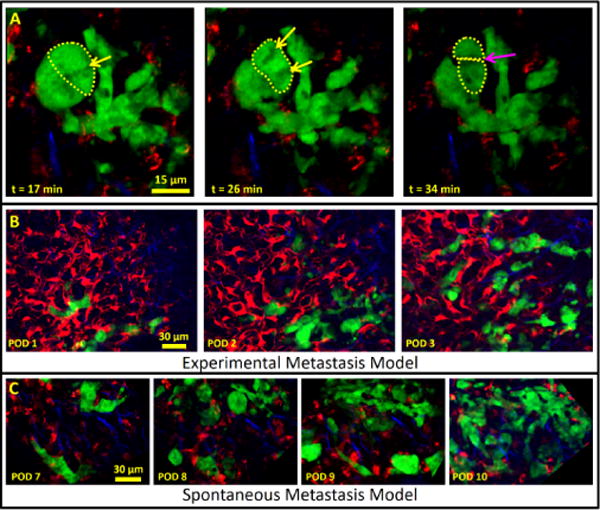
The WHRIL allows visualization of subcellular structures and tumor cell growth over several days in either experimental or spontaneous metastasis models. (a) Visualization of apparent tumor cell division in a spontaneous metastasis model. Stills from a time-lapse video show a cluster of tumor cells 2 d after arrival into the lung vasculature and 8 d after implantation of the WHRIL. In one cell (dashed yellow line in t = 17 min and t = 26 min), subcellular organelles can be seen undergoing movement characteristic of chromosomal alignment (yellow arrow at t = 17 min) and separation (yellow arrows at t = 28 min) followed by apparent cytokinesis (dashed yellow lines and magenta arrow at t = 34 min). (b) Visualization of growth in an experimental metastasis model: E0771–GFP tumor cells intravenously injected 1 d after implantation of the WHRIL are visualized over 3 d (consecutive days) as they grow from small collections of single cells to micrometastases. Green, GFP; red, Ve-Cad labeled endothelia and 155 kD TMR dextran; blue, SHG from collagen I fibers. Verification that the same field of view is visualized each day can be accomplished by examination of the vascular morphology in this image or just the collagen I morphology, which is shown in supplementary Figure 7a. (c) Visualization of growth in a spontaneous metastasis model. Tumor cells that have disseminated spontaneously from an orthotopic primary mammary tumor are also followed over multiple consecutive days. Images showing the growth of a newly arrived group of tumor cells taken on 3 d (consecutive days) showing the progression to a micrometastasis. Verification that the same field of view is visualized each day can be accomplished by examination of the vascular morphology in this image or just the collagen I morphology, which is shown in supplementary Figure 7b. Green, GFP; red, Ve-Cad labeled endothelia and 155-kD TMR dextran; blue, SHG from collagen I fibers.
We have also been able to image the growth of a small number of disseminated tumor cells into micrometastases. We accomplish this using the commonly employed experimental metastasis model, where tumor cells are directly injected into the vasculature (Fig. 5b), as well as a model where the tumor cells disseminate spontaneously from an orthotopically growing primary tumor (Fig. 5c). Our observations of tumor cell arrival, endothelial crossing, and growth into micrometastases represent, to our knowledge, the first reported instances in the literature.
As the WHRIL enables return to the same vasculature day after day, we can determine the fate of tumor cells without having to continuously image them. For example, when a disseminating tumor cell first arrives to the lung, we can identify it by visualizing and recording its position. Thus, even when we are unable to record events that occur during a relatively brief time interval (such as tumor cell transendothelial migration or disappearance through apoptosis or recirculation), we can still determine a cell’s fate by using microcartography to return to the same exact field of view on subsequent imaging sessions. Coregistration of the two images clearly shows disappearance of the cell (Supplementary Fig. 6a) or its transendothelial migration (Supplementary Fig. 6b and Supplementary Video 7), which can be verified by the juxtaposition of the tumor cell relative to the vasculature. Finally, we have looked at the dynamics of the interaction between tumor cells, macrophages, and endothelial cells within micrometastases. In the primary tumor, the juxtaposition of these three cell types forms the microanatomical structure known as TMEM, which has been shown to be the sole mechanism for hematogenous dissemination. In the primary tumor, TMEM function is visualized and identified by the transient permeability of vascular contents into the interstitum7,8.
Looking in formalin-fixed, paraffin-embedded tissues from patients, we have found TMEM structures in breast cancer metastases in the lung, one example of which is shown in Figure 6a. This led us to speculate that we would be able to observe TMEM function in the live lung with intravital imaging. Using the WHRIL, we time-lapse imaged TMEM structures in lung metastases and, as shown in Figure 6b and Supplementary Video 8, we observed TMEM-associated transient vascular leakage in the lung exhibiting a temporal permeability profile identical to that seen in the primary tumor7.
Figure 6.
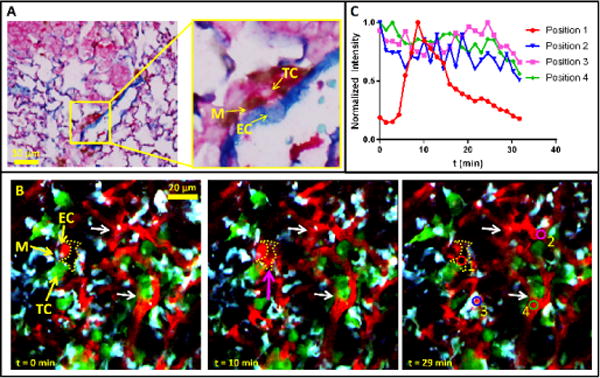
Visualization of TMEM in the lung. (a) TMEM structures can be observed in histological sections of breast cancer metastases in the lung. The yellow box indicates one TMEM, which is magnified in the right panel to show the three constituent cells of TMEM. M, macrophage (brown); TC, tumor cell (pink); EC, endothelial cell (blue). (b) The WHRIL allows visualization of TMEM function in vivo. Stills from a time-lapse video in a lung metastasis 2.4 weeks after tail-vein injection of tumor cells and 2 d post-WHRIL implantation show TMEM, consisting of a TC, M and EC in direct contact. In mammary tumors, functional TMEM are the sites of transient vascular permeability and location of intravasation and hematogenous dissemination of tumor cells. Direct visualization of transient vascular leakage of TMR-labeled 155 kD dextran (red) from the serum into the interstitium at t = 10 min (magenta arrow, dotted yellow area) indicates the adjacent TMEM is functional. Red, TMR-labeled 155 kD dextran; green, E0771–GFP tumor cells; cyan, CFP-labeled macrophages. Colored circles in time t = 29-min panel show spatial locations used for quantification of dextran signal in panel c. (c) Quantification of leaked extravascular dextran signal and comparison to vascular dextran signal. 40-μm2 colored circles in panel b at t = 29 min indicate the locations of quantification of dextran signal. The red circle measures the transient extravascular dextran signal that comes from the TMEM, while the other three circles measure the vascular signal over time at different locations across the tissue. All signals were normalized to their peak values.
To discern the TMEM-associated permeability from other systemic changes in blood flow, we quantified the extravascular dextran located adjacent to the TMEM (Fig. 6b, position 1, red circle in t = 29 min panel) and directly compared it to the vascular signal at three other distant locations (Fig. 6b, positions 2–4, blue, magenta, and green circles in t = 29 min panel) within the imaged field of view. Not only does the temporal profile (Fig. 6c) of the TMEM-associated signal (position 1) drastically differ from the vascular measurements (positions 2–4), it also does not display the random fluctuations observed within the vasculature that are caused by passing unlabeled erythrocytes and leukocytes, as mentioned in the above section on blood averaging. These data, along with the steady vascular morphology observed over time (Fig. 6b, white arrows), eliminates the possibility that the TMEM-associated extravascular dextran signal is due to systemic blood flow changes or a change in optical focus.
Discussion
We have developed and validated an implantable, permanent window for repeated visualization of the murine lung with high-resolution multiphoton microscopy over weeks. This window, and its accompanying minimally invasive surgical protocol, reproduce the capability of existing murine lung-imaging windows2 to produce stable, high-resolution images of the lung vasculature in many imaging sessions over several weeks.
However, unlike any other murine lung-imaging window, the WHRIL dramatically reduces the invasiveness of the surgery and reseals the thoracic cavity. This makes it possible for the mouse to recover from anesthesia, breathe independently (both between and during imaging sessions), and live with this ‘transparent ribcage’ for weeks. Immobilization of the lung tissue, accomplished with a thin (<10 μm) layer of adhesive, obviates the need for high-speed gated imaging4 or other specialized ventilation14 or image-processing techniques5,15. This results in a simplified experimental setup during imaging and makes the WHRIL accessible for use in a wide range of applications by any laboratory with a multiphoton microscope.
This window, combined with our previously published channel-subtraction techniques16,17, allows the capture of multiple fluorescence signals simultaneously and demonstrates that the capture of five or more different fluorescence signals with only four detectors is possible. Custom-developed multiphoton microscopes can also expand upon this capability through an increase in number of detectors and an expanded wavelength range by use of an optical parametric oscillator16.
Only two groups have been successful in developing permanent implantable windows. In 1963, Alva and Ranier18 developed a 2-in diameter window for use in dogs and rabbits; and in 1994, Fingar and Wieman19 developed a 1-in diameter window for use in rats. While both of these windows allowed survival of the animal after surgery, neither was capable of stabilizing the lung tissue for high-resolution imaging, and both were limited to use in large animals. Only the work of Kimura and Hoffman20 was able to attain a view of the murine lung over multiple days, albeit at low resolution. This was accomplished, however, by a protocol that involved multiple surgeries, cutting open the chest wall as well as surgically exposing the trachea (to verify correct intubation) for each imaging session. The lung tissue was also immobilized using sustained positive end expiratory pressure (PEEP) during imaging. This protocol is extremely invasive, prevents healing of the chest wall, potentially causes damage to the alveoli from overexpansion of the lung tissue, and runs a high risk of infection. These techniques fall in line with the conclusions presented in Fiole and Tournier’s recent review of the field, in which they observe that “strategies developed in order to overcome movements of the thorax caused by breathing and heartbeats remain the chief drawback of the technique and a major source of invasiveness”15. This leads them to the conclusion that, “In broad terms, greater invasiveness leads to better resolution”15. The WHRIL addresses these concerns, is (to our knowledge) the first permanent window to be developed for mice, and provides a solution that is both high resolution and minimally invasive.
Clearly, all surgical interventions to an animal to implant an optical window may cause minor inflammation. However, using several complementary assays, we have shown that this inflammation is minimal, even with the use of an adhesive for immobilizing the lung tissue. While we cannot completely rule out the possibility that the CSF1+ cells we observe in the lung are not recruited bone marrow macrophages, the fact that we do not see a significant (P > 0.29) increase in total macrophage numbers compared with numbers in control (no implant) tissues indicates that these are most likely resident, and not inflammatory, macrophages. However, for those wishing to eliminate the adhesive from this protocol altogether, imaging may be performed with high-speed gated acquisition as described in ref.4, or the tissue can be stabilized with the PEEP protocol described by Kimura et al.20. In these cases, fiducial marks for microcartography may be added directly to the tissue using the photo-tattooing method described by Ritsma et al.21. In all cases, it is crucial to include appropriate controls so as to isolate the impact of the surgical protocol from the biology being studied.
Using the WHRIL, we have provided (to our knowledge) the first direct visualization, with single-cell resolution, of all of the steps of metastasis, including arrival, extravasation, growth, and progression to micrometastases. We have done this using both the experimental and, importantly, the more clinically relevant, spontaneously metastasizing cancer models. Furthermore, we have observed, the activity of the tripartite structure TMEM in metastatic lung lesions, and this finding suggests that the same mechanism of hematogenous dissemination seen in the primary tumor is present and functional in metastatic lesions.
The major limitation of this technology, as with optical-imaging techniques of all tissues, is its relatively limited depth of penetration. This limitation means that pathologies which occur in the larger bronchioles and vessels deep within the lung are inaccessible for high-resolution optical imaging. Despite this limitation, the technique can still yield clinically relevant information, particularly information relevant to the field of cancer, since it has been documented that lung metastases are found at the periphery of the lung, as is large-cell carcinoma and a portion of squamous cell carcinoma metastasis22–25—well within the imaging depth of multiphoton microscopy. Further, this technology provides a considerable advantage over standard ex vivo assays26,27, which disconnect the tissue from the physiological gas and cell exchange5, as well as the newly developed in vivo imaging methods, which are limited in duration and do not extend beyond 12 h2,28.
The ability to view the same lung tissue with subcellular resolution over multiple days may address many unanswered questions in lung pathology. As one example (of many), the role and importance of circulating tumor cell clusters in metastasis has recently garnered renewed interest. Originally published as part of a series of investigations into the functional dependence of experimental metastasis (intravenous injection of tumor cells) on tumor cell number, size, and viability, Fidler29 reported that clusters of tumor cells injected directly into the vasculature resulted in an increased number of metastases when compared with an equivalent injection of single cells. These results were recapitulated in experiments by Liotta et al.30 and, most recently, Aceto et al.31.
All of these studies, however, have relied upon the intravenous injection of tumor cells and endpoint evaluations of gross metastases in the lung, with all steps in between remaining hidden. In addition to being rather aphysiological (tumor cells do not metastasize naturally as a huge bolus of cells injected into the vasculature), interpretation of these data relies upon the assumption that the metastases that develop weeks after injection are directly derived from the injected clusters. While it is possible, there is no direct evidence for this assumption. What would be required to address this question directly is the ability to repeatedly visualize the lungs of these mice with single-cell resolution and follow the sites where tumor cells arrive and seed over the period of weeks it takes them to grow into macrometastases.
Only the WHRIL gives researchers this ability to directly visualize tumor cell arrival and ultimate fate during spontaneous metastatic progression over weeks, and this enables investigations into the mechanisms underlying tumor cell seeding, survival, dormancy, and growth.
Supplementary Material
Acknowledgments
This technology was developed in the Gruss-Lipper Biophotonics Center and the Integrated Imaging Program at Albert Einstein College of Medicine. We acknowledge the support of these Centers in this work: Einstein’s Integrated Imaging Program, Montefiore’s Ruth L. Kirschstein T32 Training Grant of Surgeons for the Study of the Tumor Microenvironment (CA200561), NIH grants CA100324, CA216248, P30CA013330, and SIG #1S10OD019961-01. We thank M. Rottenkolber, R. Ibagon and A. Leggiadro of the Einstein Machine Shop for their skilled craftsmanship and design insight; and we thank C. Rodriguez-Tirado, B. Canella and U. Steidl’s lab for help with evaluating blood counts.
Footnotes
Author contributions
D.E. and J.C. conceived of the technique; J.C. conceived of the biological goals for performance; D.E. designed the window and stage plate; D.E., S.V. and F.B. developed the surgical protocol; S.V., D.E., G.S.K., M.O. and J.C. designed the validation experiments; D.E. and S.V. performed the imaging; S.V. and L.B. performed the validation experiments; Y.W. bred the mice; P.G. performed 3D reconstructions; D.E., L.B. and P.G. performed the blood-flow measurements; S.V., D.E., G.S.K., M.O. and J.J. evaluated the validation results; D.E. and G.S.K. performed statistical analyses; M.O. and J.J. evaluated HE, IBA1 IHC and TMEM IHC in fixed lung sections; and D.E., S.V. and J.C. wrote the paper.
Competing Financial Interests
The authors declare competing financial interests: details are available in the online version of the paper.
References
- 1.Looney MR, et al. Stabilized imaging of immune surveillance in the mouse lung. Nat Methods. 2011;8:91–96. doi: 10.1038/nmeth.1543. [DOI] [PMC free article] [PubMed] [Google Scholar]
- 2.Entenberg D, et al. In vivo subcellular resolution optical imaging in the lung reveals early metastatic proliferation and motility. Intravital. 2015;4:1–11. doi: 10.1080/21659087.2015.1086613. [DOI] [PMC free article] [PubMed] [Google Scholar]
- 3.Martin EA. Concise Medical Dictionary. Oxford University Press; 2010. [Google Scholar]
- 4.Vinegoni C, Lee S, Feruglio PF, Weissleder R. Advanced motion compensation methods for intravital optical microscopy. IEEE J Sel Top Quantum Electron. 2014;20:115–121. doi: 10.1109/JSTQE.2013.2279314. [DOI] [PMC free article] [PubMed] [Google Scholar]
- 5.Presson RG, Jr, et al. Two-photon imaging within the murine thorax without respiratory and cardiac motion artifact. Am J Pathol. 2011;179:75–82. doi: 10.1016/j.ajpath.2011.03.048. [DOI] [PMC free article] [PubMed] [Google Scholar]
- 6.Dunphy MP, Entenberg D, Toledo-Crow R, Larson SM. In vivo microcartography and subcellular imaging of tumor angiogenesis: a novel platform for translational angiogenesis research. Microvasc Res. 2009;78:51–56. doi: 10.1016/j.mvr.2009.03.008. [DOI] [PMC free article] [PubMed] [Google Scholar]
- 7.Harney AS, et al. Real-time imaging reveals local, transient vascular permeability, and tumor cell intravasation stimulated by TIE2hi macrophage-derived VEGFA. Cancer Discov. 2015;5:932–943. doi: 10.1158/2159-8290.CD-15-0012. [DOI] [PMC free article] [PubMed] [Google Scholar]
- 8.Karagiannis GS, et al. Neoadjuvant chemotherapy induces breast cancer metastasis through a TMEM-mediated mechanism. Sci Transl Med. 2017;9:eaan0026. doi: 10.1126/scitranslmed.aan0026. [DOI] [PMC free article] [PubMed] [Google Scholar]
- 9.te Velde EA, et al. Impaired healing of cutaneous wounds and colonic anastomoses in mice lacking thrombin-activatable fibrinolysis inhibitor. J Thromb Haemost. 2003;1:2087–2096. doi: 10.1046/j.1538-7836.2003.00404.x. [DOI] [PubMed] [Google Scholar]
- 10.Ritsma L, et al. Intravital microscopy through an abdominal imaging window reveals a pre-micrometastasis stage during liver metastasis. Sci Transl Med. 2012;4:158ra145. doi: 10.1126/scitranslmed.3004394. [DOI] [PubMed] [Google Scholar]
- 11.Ohsawa K, Imai Y, Kanazawa H, Sasaki Y, Kohsaka S. Involvement of Iba1 in membrane ruffling and phagocytosis of macrophages/microglia. J Cell Sci. 2000;113:3073–3084. doi: 10.1242/jcs.113.17.3073. [DOI] [PubMed] [Google Scholar]
- 12.Kumar V, Abbas AK, Aster JC. Robbins Basic Pathology E-Book. Elsevier Health Sciences; 2017. [Google Scholar]
- 13.Baker R, Nissim J. Expressions for combining standard errors of two groups and for sequential standard error. Nature. 1963;198:1020. [Google Scholar]
- 14.Hanna G, et al. Automated measurement of blood flow velocity and direction and hemoglobin oxygen saturation in the rat lung using intravital microscopy. Am J Physiol Lung Cell Mol Physiol. 2013;304:L86–L91. doi: 10.1152/ajplung.00178.2012. [DOI] [PMC free article] [PubMed] [Google Scholar]
- 15.Fiole D, Tournier JN. Intravital microscopy of the lung: minimizing invasiveness. J Biophotonics. 2016;9:868–878. doi: 10.1002/jbio.201500246. [DOI] [PubMed] [Google Scholar]
- 16.Entenberg D, et al. Setup and use of a two-laser multiphoton microscope for multichannel intravital fluorescence imaging. Nat Protoc. 2011;6:1500–1520. doi: 10.1038/nprot.2011.376. [DOI] [PMC free article] [PubMed] [Google Scholar]
- 17.Entenberg D, et al. In: Current Protocols in Cell Biology. Bonifacino JS, et al., editors. John Wiley & Sons, Inc; 2013. Chapter 19. [Google Scholar]
- 18.De Alva WE, Rainer WG. A method of high speed in vivo pulmonary microcinematography under physiologic conditions. Angiology. 1963;14:160–164. doi: 10.1177/000331976301400402. [DOI] [PubMed] [Google Scholar]
- 19.Fingar VH, Taber SW, Wieman TJ. A new model for the study of pulmonary microcirculation: determination of pulmonary edema in rats. J Surg Res. 1994;57:385–393. doi: 10.1006/jsre.1994.1159. [DOI] [PubMed] [Google Scholar]
- 20.Kimura H, et al. Real-time imaging of single cancer-cell dynamics of lung metastasis. J Cell Biochem. 2010;109:58–64. doi: 10.1002/jcb.22379. [DOI] [PubMed] [Google Scholar]
- 21.Ritsma L, Vrisekoop N, van Rheenen J. In vivo imaging and histochemistry are combined in the cryosection labelling and intravital microscopy technique. Nat Commun. 2013;4:2366. doi: 10.1038/ncomms3366. [DOI] [PubMed] [Google Scholar]
- 22.Travis WD. Classification of lung cancer. Semin Roentgenol. 2011;46:178–186. doi: 10.1053/j.ro.2011.02.003. [DOI] [PubMed] [Google Scholar]
- 23.Scholten ET, Kreel L. Distribution of lung metastases in the axial plane. A combined radiological-pathological study. Radiol Clin (Basel) 1977;46:248–265. [PubMed] [Google Scholar]
- 24.Braman SS, Whitcomb ME. Endobronchial metastasis. Arch Intern Med. 1975;135:543–547. [PubMed] [Google Scholar]
- 25.Herold CJ, Bankier AA, Fleischmann D. Lung metastases. Eur Radiol. 1996;6:596–606. doi: 10.1007/BF00187656. [DOI] [PubMed] [Google Scholar]
- 26.Bernal PJ, et al. Nitric-oxide-mediated zinc release contributes to hypoxic regulation of pulmonary vascular tone. Circ Res. 2008;102:1575–1583. doi: 10.1161/CIRCRESAHA.108.171264. [DOI] [PMC free article] [PubMed] [Google Scholar]
- 27.Miyao N, et al. Various adhesion molecules impair microvascular leukocyte kinetics in ventilator-induced lung injury. Am J Physiol Lung Cell Mol Physiol. 2006;290:L1059–L1068. doi: 10.1152/ajplung.00365.2005. [DOI] [PubMed] [Google Scholar]
- 28.Rodriguez-Tirado C, et al. Long-term high-resolution intravital microscopy in the lung with a vacuum stabilized imaging window. J Vis Exp. 2016 doi: 10.3791/54603. http://dx.doi.org/10.3791/54603. [DOI] [PMC free article] [PubMed]
- 29.Fidler IJ. The relationship of embolic homogeneity, number, size and viability to the incidence of experimental metastasis. Eur J Cancer. 1973;9:223–227. doi: 10.1016/s0014-2964(73)80022-2. [DOI] [PubMed] [Google Scholar]
- 30.Liotta LA, Saidel MG, Kleinerman J. The significance of hematogenous tumor cell clumps in the metastatic process. Cancer Res. 1976;36:889–894. [PubMed] [Google Scholar]
- 31.Aceto N, et al. Circulating tumor cell clusters are oligoclonal precursors of breast cancer metastasis. Cell. 2014;158:1110–1122. doi: 10.1016/j.cell.2014.07.013. [DOI] [PMC free article] [PubMed] [Google Scholar]
Associated Data
This section collects any data citations, data availability statements, or supplementary materials included in this article.