

Abstract
The Paris Agreement on climate change, in which many nations have agreed to limit greenhouse gas emissions, has spurred interest in developing working fluids with low global warming potential (GWP) that can satisfy environmental concerns and have thermophysical properties that can meet engineering performance requirements. One such fluid is 1,1,1,2,2,4,5,5,5-nonafluoro-4-(trifluoromethyl)-3-pentanone (also known as Novec-649 and Novec-1230), which has potential applications in organic Rankine cycles (ORC), electronics cooling, computer/data center cooling and fire extinguishing. In this work, viscosity measurements of 1,1,1,2,2,4,5,5,5-nonafluoro-4-(trifluoromethyl)-3-pentanone were reported. The measurements were performed over the temperature range of (243 to 373) K and at pressures up to 40 MPa using a vibrating-wire viscometer. The combined expanded uncertainty of the reported viscosity was 2 % with a confidence level of 0.95 (k = 2). These experimental data were used to develop a viscosity correlation that covers a wide temperature and pressure range, with an estimated uncertainty at a 95% confidence level of 2% for the liquid phase from (240 to 400) K at pressures up to 40 MPa.
Keywords: 1,1,1,2,2,4,5,5,5-Nonafluoro-4-(trifluoromethyl)-3-pentanone; Correlation; Novec-1230; Novec-649; Viscosity
Graphical Abstract

1. Introduction
In 1974, it was demonstrated by Molina and Rowland1 that chlorofluorocarbons (CFCs) and various other halogenated compounds, were contributing to the Earth’s stratospheric ozone depletion. This led to worldwide activity in the development of a new generation of compounds to replace CFCs, such as hydrochlorofluorocarbons (HCFCs) and hydrofluorocarbons (HFCs). Unfortunately, the widespread use of HCFCs and HFCs was found to contribute to another environmental challenge–global warming. Recently, a broader consensus, the Paris Agreement, was reached within the United Nations Framework Convention on Climate Change (UNFCCC) that deals with mitigation of greenhouse gas emissions. According to the agreement, many of the compounds currently used in the refrigeration sector are scheduled for phase out due to ozone depletion concerns and/or contributions to global warming. There is current interest in developing working fluids with low global warming potential (GWP) that that can satisfy environmental concerns and have thermophysical properties that can meet engineering performance requirements. One such fluid is the compound 1,1,1,2,2,4,5,5,5- nonafluoro-4-(trifluoromethyl)-3-pentanone (also known as FK-5-1-12, and by trade names Novec-649 and Novec-1230#). It is a potential replacement fluid in organic Rankine cycles, electronics cooling, and computer/data center cooling. An additional application of the fluid is as a fire extinguishing agent; it has been approved by the U.S. Environmental Protection Agency as a total flooding agent for fire suppression.2 The fluid has a zero ozone-depletion potential (ODP), a global warming potential of 0.6 to 1.8 relative to CO2 for a 100 year time horizon, and an atmospheric lifetime of up to 2 weeks.3,4
Knowledge of accurate thermophysical properties is essential to the optimum design of energy-conversion systems and the selection of alternative environmentally friendly working fluids. The thermodynamic properties of Novec-649 have already been reported, including vapor pressure, density, speed of sound, ideal gas heat capacity and surface tension.5,6 With regard to viscosity, to the best of our knowledge, there are no reported data in the public literature. For a more comprehensive knowledge of the fluid, in this work, the compressed liquid viscosities of Novec-649 were reported, measured by using a vibrating wire viscometer over a temperature range from (243 to 373) K and at pressures up to 40 MPa. Based on these experimental data, a viscosity correlation of Novec-649 was developed.
2. Experimental Section
2.1. Chemicals
1,1,1,2,2,4,5,5,5-Nonafluoro-4-(trifluoromethyl)-3-pentanone (Novec-649) was obtained from a commercial supplier in China, with a stated mass purity of 0.995, and was used as it was supplied. Our analysis by gas chromatography equipped with a thermal conductivity detector and a capillary column (60 m × 0.32 mm) indicated a GC area fraction of 0.998, which could be used to infer an approximate chemical purity. Table 1 lists the specification of the samples used in this work.
TABLE 1.
Specification of Samples.
| chemical name | CAS No. | formula | initial mass fraction puritya | GC area fraction |
|---|---|---|---|---|
| Novec-649b | 756-13-8 | C6F12O | 0.995 | 0.998 |
All the stated purities of the sample listed above were obtained by the certificate of the supplier.
1,1,1,2,2,4,5,5,5-Nonafluoro-4-(trifluoromethyl)-3-pentanone; also known as Novec-1230.
2.2. Apparatus
The viscometer, used here in a steady-state mode, has been described previously7,8. A custom-made stainless steel vessel with a maximum design pressure of 70 MPa was used, containing about 50 ml samples. The key component was a tungsten wire, which was clamped at both ends while keeping a tension applied to the wire. A pair of 40 mm-length samarium-cobalt magnets was arranged inside the vessel, driving the wire to vibrate. The nominal radius of the wire was (50.00 ± 0.32) μm and the nominal length was 58 mm. A function generator supplied a sinusoidal voltage on the wire immersed in the testing fluid. The wire’s transverse oscillation motion was caused by the Lorentz force, subject to a permanent magnetic field, which was affected by the viscosity and density of the fluid. The oscillation motion then affected the electromotive force in the wire, conversely. A lock-in amplifier detected the in-phase and quadrature voltages across the wire over the frequency range to calculate the viscosity. For each measuring point, the working equations were fitted by the measured complex voltages, which included the parameters of the fluid, including the known density and the unknown viscosity. The calibration and validation of the present apparatus was discussed previously,8 and was unchanged. The system was evacuated before the measurement, avoiding the impurities (such as air) in the cell. After the measurement, the fluid was collected into the wasting vessel and the system was cleaned by solvents such as ethanol and acetone. A diagram of the experimental system was shown in Figure 1.
FIGURE 1.

Schematic diagram of experimental system: (A) manual piston pump; (B) vacuum pump; (C) sample container; (D) pressure transducer; (E) vibrating wire viscometer; (F) thermostatic bath; (G) wasting vessel; (V1 – V5) valves.
A manual piston pump was used to provide the pressure, measured by a high-pressure transducer with a pressure range up to 100 MPa. The pressure transducer measurement signal was measured by a nanovolt meter with 7 1/2 digits resolution. The combined expanded uncertainty of pressure was Uc(p) = 0.12 MPa (k = 2). The constant temperature of the viscometer was provided by a thermostatic bath, and the temperature was measured with a calibrated 100 Ω platinum resistance thermometer connected to a digital multimeter. The combined expanded uncertainty of temperature was Uc(T) = 12 mK, with a level of confidence of 0.95 (k=2). The combined expanded uncertainty of viscosity with a level of confidence of 0.95 (k = 2) was better than 2%, considering the uncertainties of temperature, pressure, repeatability of measurement, and the density of the fluid calculated from the equation of state.5
3. Results and Discussion
The compressed liquid densities for 1,1,1,2,2,4,5,5,5-nonafluoro-4-(trifluoromethyl)-3-pentanone (Novec-649) between (243 to 373) K and at pressures up to 40 MPa were obtained from the correlation proposed by McLinden et al.5 The uncertainty in the equation of state is 0.067 % in density in the liquid phase. The viscosities of compressed liquid Novec-649 were measured at pressures from (0.1 to 40) MPa, along fourteen isotherms from (243 to 373) K, and are listed in Table 2, with a total number of 90 points. The viscosity data as a function of pressure at different temperatures are shown in Figure 2.
Table 2.
Viscosities η of Novec-649 at temperature range of (243 to 373) K from (0.1 to 40) MPa measured using a vibrating wire viscometer.a
| T/K | p/MPa | ρb/kg·m−3 | η/mPa·s |
|---|---|---|---|
| 243.16 | 0.1 | 1758.79 | 1.5971 |
| 243.16 | 1.0 | 1761.19 | 1.6282 |
| 243.16 | 5.0 | 1771.44 | 1.7491 |
| 243.15 | 10.0 | 1783.47 | 1.9234 |
| 243.15 | 20.0 | 1805.33 | 2.3292 |
| 243.16 | 30.0 | 1824.92 | 2.7614 |
| 243.15 | 40.0 | 1842.83 | 3.2473 |
| 253.15 | 0.1 | 1731.46 | 1.3066 |
| 253.15 | 1.0 | 1734.10 | 1.3394 |
| 253.15 | 5.0 | 1745.34 | 1.4513 |
| 253.15 | 10.0 | 1758.41 | 1.5801 |
| 253.15 | 20.0 | 1781.93 | 1.9130 |
| 253.15 | 30.0 | 1802.83 | 2.2601 |
| 253.16 | 40.0 | 1821.73 | 2.6591 |
| 263.15 | 0.1 | 1703.76 | 1.0822 |
| 263.15 | 1.0 | 1706.68 | 1.1070 |
| 263.14 | 5.0 | 1719.07 | 1.1970 |
| 263.14 | 10.0 | 1733.31 | 1.3270 |
| 263.14 | 20.0 | 1758.66 | 1.5728 |
| 263.14 | 30.0 | 1780.94 | 1.8603 |
| 263.14 | 40.0 | 1800.94 | 2.1693 |
| 273.14 | 0.1 | 1675.63 | 0.9209 |
| 273.15 | 1.0 | 1678.86 | 0.9395 |
| 273.15 | 5.0 | 1692.51 | 1.0141 |
| 273.15 | 10.0 | 1708.06 | 1.1172 |
| 273.14 | 20.0 | 1735.44 | 1.3321 |
| 273.15 | 30.0 | 1759.17 | 1.5657 |
| 273.15 | 40.0 | 1780.33 | 1.8175 |
| 283.15 | 0.1 | 1646.90 | 0.7823 |
| 283.15 | 1.0 | 1650.53 | 0.7955 |
| 283.15 | 5.0 | 1665.67 | 0.8641 |
| 283.15 | 10.0 | 1682.70 | 0.9569 |
| 283.15 | 20.0 | 1712.25 | 1.1419 |
| 283.15 | 30.0 | 1737.58 | 1.3450 |
| 283.15 | 40.0 | 1759.94 | 1.5668 |
| 293.15 | 0.1 | 1617.52 | 0.6693 |
| 293.15 | 1.0 | 1621.60 | 0.6851 |
| 293.15 | 5.0 | 1638.45 | 0.7466 |
| 293.14 | 10.0 | 1657.18 | 0.8262 |
| 293.16 | 20.0 | 1689.08 | 0.9881 |
| 293.16 | 30.0 | 1716.09 | 1.1558 |
| 293.15 | 40.0 | 1739.75 | 1.3499 |
| 303.15 | 0.1 | 1587.33 | 0.5776 |
| 303.16 | 1.0 | 1591.92 | 0.5906 |
| 303.14 | 5.0 | 1610.81 | 0.6463 |
| 303.15 | 10.0 | 1631.37 | 0.7173 |
| 303.15 | 20.0 | 1665.95 | 0.8610 |
| 303.16 | 30.0 | 1694.75 | 1.0126 |
| 303.15 | 40.0 | 1719.75 | 1.1765 |
| 313.15 | 0.1 | 1556.17 | 0.5006 |
| 313.13 | 1.0 | 1561.49 | 0.5123 |
| 313.14 | 5.0 | 1582.63 | 0.5621 |
| 313.15 | 10.0 | 1605.32 | 0.6263 |
| 313.14 | 20.0 | 1642.81 | 0.7566 |
| 313.14 | 30.0 | 1673.54 | 0.8908 |
| 313.15 | 40.0 | 1699.91 | 1.0335 |
| 323.16 | 1.0 | 1529.85 | 0.4465 |
| 323.17 | 5.0 | 1553.76 | 0.4933 |
| 323.17 | 10.0 | 1578.91 | 0.5514 |
| 323.16 | 20.0 | 1619.57 | 0.6680 |
| 323.16 | 30.0 | 1652.35 | 0.7894 |
| 323.16 | 40.1 | 1680.46 | 0.9178 |
| 333.16 | 1.0 | 1497.08 | 0.3918 |
| 333.16 | 5.0 | 1524.32 | 0.4349 |
| 333.16 | 10.0 | 1552.24 | 0.4891 |
| 333.16 | 20.0 | 1596.33 | 0.5966 |
| 333.16 | 30.0 | 1631.28 | 0.7059 |
| 333.16 | 40.0 | 1660.68 | 0.8211 |
| 343.16 | 1.0 | 1462.85 | 0.3420 |
| 343.15 | 5.0 | 1494.10 | 0.3849 |
| 343.15 | 10.0 | 1525.19 | 0.4348 |
| 343.15 | 20.0 | 1573.07 | 0.5345 |
| 343.15 | 30.0 | 1610.32 | 0.6351 |
| 343.15 | 40.0 | 1641.31 | 0.7373 |
| 353.15 | 1.0 | 1426.89 | 0.3011 |
| 353.16 | 5.0 | 1462.94 | 0.3426 |
| 353.16 | 10.0 | 1497.67 | 0.3892 |
| 353.16 | 20.0 | 1549.70 | 0.4822 |
| 353.15 | 30.0 | 1589.42 | 0.5739 |
| 353.15 | 40.0 | 1622.08 | 0.6681 |
| 363.15 | 5.0 | 1430.83 | 0.3044 |
| 363.15 | 10.0 | 1469.75 | 0.3496 |
| 363.15 | 20.0 | 1526.32 | 0.4360 |
| 363.15 | 30.0 | 1568.59 | 0.5213 |
| 363.15 | 40.0 | 1602.98 | 0.6080 |
| 373.15 | 5.0 | 1397.55 | 0.2711 |
| 373.15 | 10.0 | 1441.33 | 0.3155 |
| 373.15 | 20.0 | 1502.87 | 0.3970 |
| 373.15 | 30.0 | 1547.85 | 0.4778 |
| 373.15 | 40.0 | 1584.03 | 0.5583 |
The combined expanded uncertainties Uc(k = 2) are Uc(T) = 12 mK, Uc(p) = 0.12 MPa and Uc(η) = 2 % with confidence level of 0.95.
Density ρ listed above was calculated from McLinden et al.5
FIGURE 2.
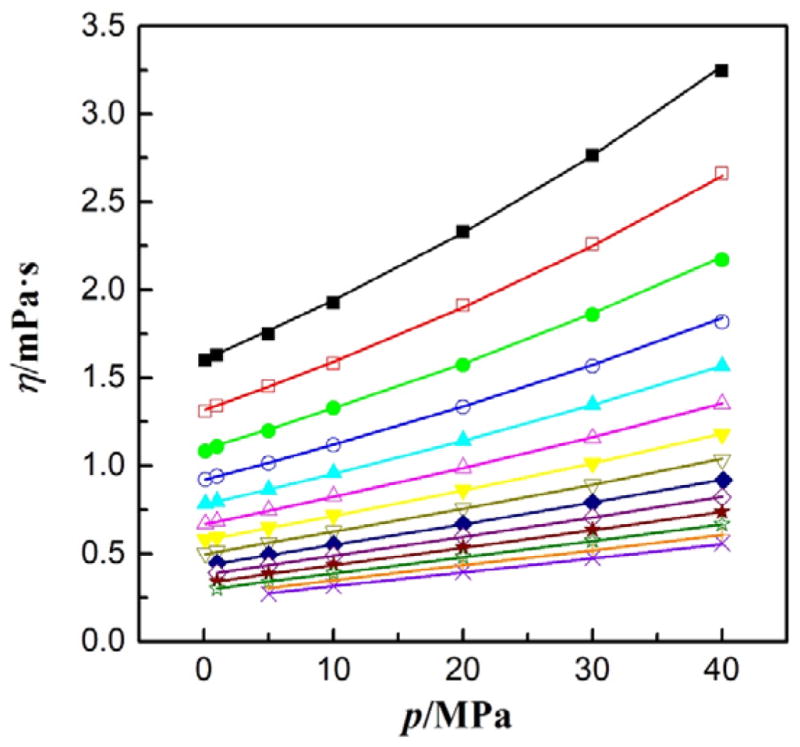
Viscosity of Novec-649, η, as a function of pressure at different isotherms. (■) 243 K, (□) 253 K, (●) 263 K, (○) 273 K, (▲) 283 K, (△) 293 K, (▼) 303 K, (▽) 313 K, (◆) 323 K, (✚) 333 K, (★) 343 K, (☆) 353 K, (+) 363 K, (×) 373 K.
4. Viscosity Correlation
The viscosity η can be written as a sum of four contributions9
| (1) |
where T is the temperature in K, ρ is the density in kg·m−3. The first term η0(T) is the dilute-gas limit viscosity, and the second term η1(T) is the first-density coefficient. These two terms were obtained theoretically in this work, which would be discussed later. Δηc is the enhancement of the viscosity in the critical region, which is significant only in a relatively narrow window in temperature and density near the critical point.9,10 The maximum contribution of the critical enhancement, in general, is less 10% of the background contribution. In this work, Δηc is taken as zero because we have no experimental viscosity data existence near the critical point. Δη is the residual viscosity, which has to be empirically fitted from the experimental data. An equation of state for each experimental temperature and pressure was used to calculate the density, ρ. In this work, the equation of state of McLinden et al.5 was used to calculate the density for Novec-649, which was available in the NIST REFPROP database program.11 The critical parameters for Novec-649 are Tc= 441.81 K, Pc= 1.869 MPa, and ρc= 1.92 mol·L−1.5 These parameters are listed in Table 3. The range of state points covered by the present measurements is shown in Figure 3 relative to the vapor-pressure curve of Novec-649.
TABLE 3.
| The critical parameters | |
| Tc/K | 441.81 |
| Pc/MPa | 1.869 |
| ρc/mol·L−1 | 1.92 |
| Coefficients for eq 2 to 7 | |
| Mw/g·mol−1 | 316.0444 |
| σ/nm | 0.6509 |
| ε/kB/K | 350.84 |
| ω | 0.471 |
| μ/Debye | 0.43 |
| The coefficients bi for eq 10 | |
| b0=−19.572881 | b1=219.73999 |
| b2=−1015.3226 | b3=2471.0125 |
| b4=−3375.1717 | b5=2491.6597 |
| b6=−787.26086 | b7=14.085455 |
| b8=−0.34664158 | |
| The coefficients ci for eq 12 | |
| c0= 22.0057 | c1= 231.063 |
| c2= 0.423359 | c3= −0.122057 |
| c4= 18.4610 | c5= −11.1393 |
| c6= 1.67777 | |
FIGURE 3.

Distribution of the data for the viscosity of Novec-649. △, experimental points measured in this work. The solid line shows the vapor-liquid saturation boundary.
4.1. The dilute-gas limit and the initial-density dependence terms
The dilute-gas limit viscosity, η0(T), is only affected by the temperature. It can be expressed as12
| (2) |
where η0 is in μPa·s, Mw is the molar mass in g mol−1. σ is the Lennard-Jones collision diameter in nm12
| (3) |
where Vc is the critical volume in cm3·mol−1. Ω* is the dimenssionless Lennard-Jones collision integral that can be obtained from the expirical correlation developed by Neufeld et al.13
| (4) |
where T*=kBT/ε, ε is the Lennard-Jones energy parameter in K, and kB is the Boltzmann constant. ε/kB is expressed as13
| (5) |
In eq 2, Fc is a correction parameter considering the dynamics theory of non-smooth molecular spheres, which is given by13
| (6) |
where ω is the acentric factor, κ is the correction factor for hydrogen-bonding effect of associating substances. κ equals to zero in this case. μr is a dimensionless dipole moment12
| (7) |
where μ is the dipole moment, Tc is the critical temperature in K. μ was estimated from B3LYP/aug-cc-pVTZ calculations using Gaussian 09,14 ω was obtained from the NIST REFPROP database program,11 where it was calculated from its definition using the equation of state of McLinden et al.5 Values are given in Table 3. With all the parameters known, eqs 2 to 7 can be used to calculate η0(T).
To represent the temperature dependence of the term η1(T) in eq 1, we use a model presented by Vogel et al.,15 which is expressed by means of the second viscosity virial coefficient Bη(T) as
| (8) |
Bη(T) can be obtained according to the theory of Rainwater and Friend16,17 as a function of a reduced second viscosity virial coefficient, Bη*(T*), as:
| (9) |
where18
| (10) |
In eq 9, NA is the Avogadro’s constant,19 6.022140857×10²³ mol−1, while σ is the Lennard-Jones collision diameter in m, and Mw is the molar mass in kg mol−1. The coefficients bi from Vogel et al.18 and the Lennard-Jones coefficients are also given in Table 3. We note that we were unable to locate any viscosity data in the gas phase, and the model above is totally predictive. It is difficult to assess an uncertainty estimate; however the author’s of this method12 claim that comparisons with gas-phase data at low-pressure typically had an average absolute deviation of 1.5%. The method did not include fluorinated ketone compounds such as Novec-649 in its development, and we estimate the uncertainty in the gas phase to be on the order of 10%.
4.2. The residual term
The residual viscosity term Δη(ρ, T) is based entirely on experimental data, due to the lack of a theoretical model. In this work, we used a symbolic regression software20 to fit the experimental data, determining the function and coefficients of the residual viscosity. A form suggestted by the hard-sphere model employed by Assael et al.21 was used here:
| (11) |
where the functional form for F(ρr, Tr) was determined by the symbolic regression. The dilute-gas limit η0(T) and the initial dependence terms η1(T)ρ were calculated for each experimental point using eqs 2 to 10. The residual term can be obtained by subtracting the η0(T) and η1(T)ρ from the experimental viscosity. A simple expression was found:
| (12) |
Coefficients ci are given in Table 3. Tr is the reduced temperature Tr=T/Tc and ρr is the reduced density ρr=ρ/ρc, with Δη in μPa·s.
4.3. Comparisons with experimental data and verification
The present data, comprising 90 points in the compressed liquid regions from T= (243 to 373) K at pressures to 40 MPa, were used to develop a correlation for the viscosity of Novec-649. Figure 4 shows deviations between the data and the correlation as a function of temperature. The average absolute percentage deviation, AAD, the maximum percentage deviation, MD, the average percentage deviation, Bias, and the relative standard deviation, RSD, were used to evaluate the correlation. ηexp is the experimental value of the viscosity, ηcorr is the value calculated from the correlation, and the summation is over all 90 points. The AAD of the correlation is 0.46 %, the Bias is −0.008 %, and the MD is −1.94 %. Unpublished data by Bi and Cui22 using a surface light scattering method at temperatures of 303 to 373 K were available for comparison. They used the same experimental system as described previously23, and the kinematic viscosity uncertainty is about 2 % with a confidence level of 0.95 (k = 2) according to the author’s judgment. Figure 5 shows the deviations, as a function of density, of the experimental data of this work and Bi and Cui22 from our correlation (eqs 1 to 12). The maximum deviation of the values from Bi and Cui22 is 2.43 %, which we considered to be good agreement. We estimated that the uncertainty of the correlation in the liquid phase over the temperature range 240 K to 400 K at pressures up to 40 MPa was the same as the experimental data it was based upon, namely 2%. The correlation may be used in an extrapolation mode over the full range of the equation of state of McLinden et al.,5 from (165 to 500) K at pressures up to 50 MPa, although the uncertainty may be greater than 2%. The smooth behavior of the correlation when extrapolated is demonstrated in Figure 6, which shows the viscosity of Novec-649 as a function of temperature at different pressures, with the temperature range from (200 to 1000) K and at pressures up to 50 MPa. Table 4 provides values for computer-program verification of the viscosity equation, giving viscosity results calculated from the equation at different temperatures and densities.
FIGURE 4.

Relative deviations between the present experimental data and the correlation for the viscosity of Novec-649 as a function of temperature for the liquid phase at pressures up to 40 MPa. (■) 243 K, (□) 253 K, (●) 263 K, (○) 273 K, (▲) 283 K, (△) 293 K, (▼) 303 K, (▽) 313 K, (◆) 323 K, (✚) 333 K, (★) 343 K, (☆) 353 K, (+) 363 K, (×) 373 K.
FIGURE 5.

Relative deviation between the present experimental data and the correlation for the viscosity of Novec-649 as a function of density for the liquid phase at pressures up to 40 MPa. (■) This work, (○) Bi and Cui22.
FIGURE 6.

Viscosity of Novec-649 as a function of temperature at different pressures.
TABLE 4.
Sample points for computer verification of the correlating equation.
| T/K | ρ/kg·m−3 | η/μPa·s |
|---|---|---|
| 250 | 0 | 8.09 |
| 250 | 0.41 | 8.33 |
| 250 | 1809.77 | 2377.5 |
| 300 | 0 | 9.77 |
| 300 | 3.89 | 10.85 |
| 300 | 1701.48 | 1059.7 |
| 350 | 0 | 11.43 |
| 350 | 4.42 | 12.65 |
| 350 | 1595.99 | 587.87 |
5. CONCLUSION
New viscosity data for 1,1,1,2,2,4,5,5,5-nonafluoro-4-(trifluoromethyl)-3-pentanone have been presented in this work. The viscosity data were measured using a vibrating-wire viscometer at pressures up to 40 MPa and temperatures from (243 to 373) K. The combined expanded uncertainty of the results with a level of confidence of 0.95 (k = 2) is estimated to be about 2 %. These experimental data were used to develop a viscosity correlation of Novec-649. The correlation may be used over the range of validity of the equation of state of McLinden et al., from the temperatures of (165 to 500) K at pressures up to 50 MPa. The estimated uncertainty of the correlation at a 95% confidence level is 2% for the liquid phase over the temperature range (240 to 400) K at pressures to 40 MPa.
Acknowledgments
Funding
This work was supported by the National Natural Science Foundation of China (No.51676159) and the Natural Science Basic Research Plan in Shaanxi Province of China (No.2015JM5214).
We thank Dr. Andrei Kazakov of NIST for dipole moment calculations.
Footnotes
Commercial equipment, instruments, or materials are identified only in order to adequately specify certain procedures. In no case does such identification imply recommendation or endorsement by the National Institute of Standards and Technology, no does it imply that the products identified are necessarily the best available for the purpose.
Notes
The authors declare no competing financial interest.
Partial contribution of the National Institute of Standards and Technology, not subject to copyright in the USA.
References
- 1.Molina MJ, Rowland FS. Stratospheric sink for chlorofluoromethanes: chlorine atom-catalyzed destruction of ozone. Nature. 1974;249:810–812. [Google Scholar]
- 2.EPA. [accessed 4/19/2017];Halon Substitutes under SNAP as of October 21, 2014. http://www.epa.gov/snap.
- 3.E.P.A. [accessed 4/19/2017];Acceptable Substitutes in Non-Mechanical Heat Transfer Systems. https://www.epa.gov/snap/acceptable-substitutes-non-mechanical-heat-transfer-systems.
- 4.G.P.O. [accessed 4/19/2017];Federal Register. https://www.gpo.gov/fdsys/pkg/FR-2009-09-30/pdf/FR-2009-09-30.pdf.
- 5.McLinden MO, Perkins RA, Lemmon EW, Fortin TJ. Thermodynamic Properties of 1,1,1,2,2,4,5,5,5-Nonafluoro-4-(trifluoromethyl)-3-pentanone: Vapor Pressure, (p, ρ, T) Behavior, and Speed of Sound Measurements, and an Equation of State. J Chem Eng Data. 2015;60:3646–3659. [Google Scholar]
- 6.Tanaka K. Measurement of pρT Properties of 1,1,1,2,2,4,5,5,5-Nonafluoro-4-(trifluoromethyl)-3-pentanone in the Near-Critical and Supercritical Regions. J Chem Eng Data. 2016;61:3958–3961. [Google Scholar]
- 7.Meng XY, Zhang JB, Wu JT. Compressed Liquid Viscosity of 1,1,1,3,3-Pentafluoropropane (R245fa) and 1,1,1,3,3,3-Hexafluoropropane (R236fa) J Chem Eng Data. 2011;56:4956–4964. [Google Scholar]
- 8.Meng XY, Qiu GS, Wu JT, Abdulagatov IM. Viscosity measurements for 2,3,3,3-tetrafluoroprop-1-ene (R1234yf) and trans-1,3,3,3-tetrafluoropropene (R1234ze(E)) J Chem Thermodyn. 2013;63:24–30. [Google Scholar]
- 9.Dymond JH, Bich E, Vogel E, Wakeham WA, Vesovic V, Assael MJ. Transport Properties of Fluids: Their Correlation, Prediction and Estimation. Cambridge: Cambridge University Press; 1996. [Google Scholar]
- 10.Huber ML, Perkins RA, Laesecke A, Friend DG, Sengers JV, Assael MJ, Metaxa IN, Vogel E, Mareš R, Miyagawa K. New International Formulation for the Viscosity of H2O. J Phys Chem Ref Data. 2009;38:101–125. [Google Scholar]
- 11.Lemmon EW, Huber ML, McLinden MO. Stand Reference Data Program. National Institute of Standards and Technology; Gaithersburg, MD: 2013. NIST Standard Reference Database 23, NIST Reference Fluid Thermodynamic and Transport Properties Database (REFPROP): Version 9.1. [Google Scholar]
- 12.Chung TH, Ajlan M, Lee LL, Starling KE. Generalized multiparameter correlation for nonpolar and polar fluid transport properties. Ind Eng Chem Res. 1988;27:671–679. [Google Scholar]
- 13.Neufeld PD, Janzen AR, Aziz RA. Empirical Equations to Calculate 16 of the Transport Collision Integrals Ω(l, s)* for the Lennard-Jones (12-6) Potential. J Chem Phys. 1972;57:1100–1102. [Google Scholar]
- 14.Frisch MJ, Trucks GW, Schlegel HB, Scuseria GE, Robb MA, Cheeseman JR, Scalmani G, Barone V, Mennucci B, Petersson GA, et al. Gaussian 09 Revision D.01. Gaussian Inc; Wallingford, Connecticut: 2013. [Google Scholar]
- 15.Vogel E, Bich E, Nimz R. The initial density dependence of the viscosity of organic vapours: Benzene and methanol. Physica A. 1986;139:188–207. [Google Scholar]
- 16.Friend DG, Rainwater JC. Transport properties of a moderately dense gas. Chem Phys Lett. 1984;107:590–594. [Google Scholar]
- 17.Rainwater JC, Friend DG. Second viscosity and thermal-conductivity virial coefficients of gases: Extension to low reduced temperature. Phys Rev A Gen Phys. 1987;36:4062–4066. doi: 10.1103/physreva.36.4062. [DOI] [PubMed] [Google Scholar]
- 18.Vogel E, Küchenmeister C, Bich E, Laesecke A. Reference Correlation of the Viscosity of Propane. J Phys Chem Ref Data. 1998;27:947–970. [Google Scholar]
- 19.Mohr PJ, Newell DB, Taylor BN. CODATA Recommended Values of the Fundamental Physical Constants: 2014. J Phys Chem Ref Data. 2016;45:043102. doi: 10.1063/5.0064853. [DOI] [PMC free article] [PubMed] [Google Scholar]
- 20.Nutonian I. EUREQA Formulize M. Nutonian Inc; Cambridge, MA, USA: 2016. [Google Scholar]
- 21.Assael MJ, Dymond JH, Papadaki M, Patterson PM. Correlation and prediction of dense fluid transport coefficients. I. n-alkanes. Int J Thermophys. 1992;13:269–281. [Google Scholar]
- 22.Cui JW, Yan SM, Bi SS, Wu JT. Surface tension and kinematic viscosity of 2-methyl-3-pentanone and trans-1-chloro-3,3,3-trifluoropropene. 21th European Conference on Thermophysical Properties; Graz, Austria. September 3–8, 2017. [Google Scholar]
- 23.Zhao GJ, Bi SS, Fröba AP, Wu JT. Liquid viscosity and surface tension of R1234yf and R1234ze under saturation conditions by surface light scattering. J Chem Eng Data. 2014;59:1366–1371. [Google Scholar]