

SUMMARY
Loss-of-function mutations in TET2 occur frequently in patients with clonal hematopoiesis, myelodysplastic syndrome (MDS), and acute myeloid leukemia (AML) and are associated with a DNA hypermethylation phenotype. To determine the role of TET2 deficiency in leukemia stem cell maintenance, we generated a reversible transgenic RNAi mouse to model restoration of endogenous Tet2 expression. Tet2 restoration reverses aberrant hematopoietic stem and progenitor cell (HSPC) self-renewal in vitro and in vivo. Treatment with vitamin C, a cofactor of Fe2+ and α-KG-dependent dioxygenases, mimics TET2 restoration by enhancing 5-hydroxymethylcytosine formation in Tet2-deficient mouse HSPCs and suppresses human leukemic colony formation and leukemia progression of primary human leukemia PDXs. Vitamin C also drives DNA hypomethylation and expression of a TET2-dependent gene signature in human leukemia cell lines. Furthermore, TET-mediated DNA oxidation induced by vitamin C treatment in leukemia cells enhances their sensitivity to PARP inhibition and could provide a safe and effective combination strategy to selectively target TET deficiency in cancer.
In Brief
Vitamin C treatment mimics the effect of TET2 restoration on leukemic stem cells and enhances the efficacy of PARP inhibition in suppressing leukemia progression.
INTRODUCTION
TET2 is one of the most frequently mutated genes in hematopoietic malignancies. Somatic deletions and loss of function mutations in TET2 are seen in ~10% of de novo acute myeloid leukemia (AML), ~30% of myelodysplastic syndrome (MDS), and almost 50% of chronic myelomonocytic leukemia (CMML) patients (Delhommeau et al., 2009; Kosmider et al., 2009). TET2 mutations are associated with DNA hypermethylation, increased risk of MDS progression, and poor prognosis in AML (reviewed in Guillamot et al., 2016).
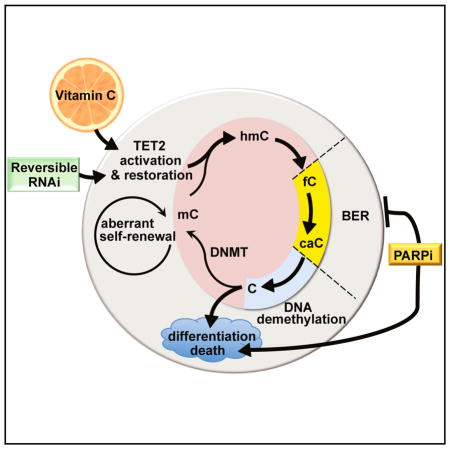
The ten-eleven-translocation (TET1-3) proteins are α-ketoglutarate- and Fe2+-dependent dioxygenases (α-KGDDs) that catalyze the iterative oxidation of 5-methylcytosine (5mC) to 5-hydroxymethylcytosine (5hmC), 5-formylcytosine (5fC), and 5-carboxylcytosine (5caC). These oxidized mCs are key intermediates in DNA demethylation via replication-dependent dilution or base excision repair (BER). Truncations or catalytic domain mutants of TET2, as found in leukemia patients, affect Fe2+ and/or α-KG binding, leading to impaired 5mC oxidation and DNA hypermethylation (Pastor et al., 2013; Shen et al., 2014). These findings highlight the importance of targeting aberrant DNA methylation for the treatment of TET2 mutant diseases.
Several studies have modeled TET2 loss of function in mice (Guillamot et al., 2016). Tet2 deletion causes progressive defects in hematopoiesis, including increased hematopoietic stem cell (HSC) self-renewal and myeloid lineage expansion. These phenotypes correlate with loss of 5hmC in hematopoietic stem and progenitor cells (HSPCs), DNA hypermethylation, and altered gene expression consistent with a myeloid lineage bias in self-renewing progenitors. A significant proportion of Tet2-deficient mice develop a CMML-like disease, characterized by increased circulating white blood cells (WBCs), monocytosis, and splenomegaly (Moran-Crusio et al., 2011; Quivoron et al., 2011).
TET2 mutations are seen at high allele frequency in CD34+ HSPCs (Delhommeau et al., 2009; Papaemmanuil et al., 2016) and in a wide variety of hematopoietic malignancies (Guillamot et al., 2016), suggesting such mutations are early drivers of transformation in cells with multi-lineage potential. TET2 mutations are also found in the WBCs of otherwise healthy adults with clonal hematopoiesis, a condition of aging associated with myeloid lineage bias and increased risk of progression to MDS and AML (Sperling et al., 2017). Hence, TET2 mutation represents a pre-leukemic lesion that can enable disease progression, either by altering the epigenetic landscape or by promoting acquisition of additional oncogenic lesions in aberrantly self-renewing stem cells.
Conceivably, restoring TET2 function could provide therapeutic benefit to patients with clonal hematopoiesis or MDS, but it remains unclear if TET2 deficiency is necessary for disease maintenance. To test this possibility, we generated reversible RNAi transgenic mice to model knockdown and restoration of endogenous Tet2 in hematopoietic cells. We found that Tet2 knockdown recapitulates the effects of Tet2 deletion, leading to aberrant HSC self-renewal and disease. Furthermore, reversing Tet2 silencing promotes DNA demethylation, cellular differentiation, and cell death, leading to a block in aberrant HSPC self-renewal.
To achieve pharmacological restoration of TET2 activity, we used vitamin C, a co-factor for α-KGDDs. Notably, exogenous vitamin C promotes DNA demethylation in embryonic stem cells (ESCs) and induced pluripotent stem cells (iPSCs) (Chung et al., 2010; Esteban et al., 2010) and dramatically enhances 5hmC levels in a TET-dependent manner (Blaschke et al., 2013; Chen et al., 2013; Yin et al., 2013). Although vitamin C administration has been tested in solid tumors, with some reports of efficacy (Fritz et al., 2014), the possibility that it might act as a targeted therapy to “correct” TET deficiency has not been explored.
Indeed, vitamin C treatment mimics Tet2 restoration by promoting DNA demethylation and reversing aberrant HSPC self-renewal. Vitamin C administration also impedes CMML progression, myeloid skewing of Tet2-deficient hematopoietic cells, and the expansion of primary human AML blasts. Treatment of human AML cell lines with vitamin C increases 5mC oxidation and promotes active demethylation. These events trigger a transient DNA damage response, which, combined with PARP inhibition, increases cell death. Our studies implicate vitamin C, through its ability to enhance TET function, as a potentially non-toxic therapy for TET-associated malignancies.
RESULTS
Generation of Reversible Tet2 Knockdown Mice
To model reversible Tet2 knockdown, we generated miR30-based transgenic small hairpin RNA (shRNA) mice that express a doxycycline (Dox)-regulated, fluorescence-linked Tet2-specific shRNA (shTet2) from the Col1a1 locus (Premsrirut et al., 2011). The shRNA mice were bred to two transactivator mouse strains: (1) Vav-tTA (VTA) transgenic mice, which express a pan-hematopoietic, tetracycline-off (Dox-off) tTA transactivator (Kim et al., 2007) (Figure 1A), and (2) ROSA26-M2rtTA (RTA) tetracycline-on (Dox-on) inducible mice, in which M2rtTA expression is driven ubiquitously from the endogenous ROSA26 promoter (Hochedlinger et al., 2005) (Figure 1B). Compound transgenic shRNA progeny harboring VTA or RTA exhibit Dox-regulated target gene restoration or knockdown, respectively. Transgenic shRNA mice expressing Renilla luciferase-specific shRNA (shRen) were used as negative controls for knockdown and restoration studies (Dow et al., 2014).
Figure 1. Generation of Inducible and Reversible Tet2 Knockdown Mice.

(A) Schematic representation of Vav-tTA-driven (VTA) reversible Tet2 knockdown mice.
(B) Schematic representation of Rosa-rtTA-driven (RTA) inducible Tet2 knockdown mice.
(C) Tet2 mRNA levels (normalized to Hprt) in bone marrow, thymus, and spleen cells from VTA shTet2 mice, compared with cognate cells from VTA shRen control mice.
(D) Schematic representation of Tet2 restoration (RS) versus knockdown (KD) in mice treated with doxycycline (Dox) food for 28 days (D0–D28).
(E and F) Representative flow cytometric analysis of GFP in peripheral blood cells of Dox-regulated RTA shTet2 inducible knockdown (E) mice and following Tet2 restoration in VTA shTet2 mice (F).
(G and H) Tet2 mRNA expression (normalized to Hprt, relative to RTA shTet2 at day 0) in cells isolated from RTA shTet2 and VTA shTet2 mice treated with Dox food to compare knockdown (KD) or restoration (RS), respectively, in cKit+ bone marrow cells (G) and CD11b+ immature myeloid cells (H) (n = 4–5 mice per group).
See also Figure S1.
Bone marrow (BM), thymus, and spleen RNA from VTA-shTet2 mice (6- to 8-week-old) showed 50%–70% Tet2 knockdown by qRT-PCR, compared with VTA-shRen controls (Figure 1C). Mice with Tet2 knockdown developed sustained myeloid lineage bias in peripheral blood (PB) by 6 months of age, and compared with controls, had markedly decreased survival, splenomegaly, and expansion and infiltration of GFP+ cells in spleen and liver (Figures S1A–S1F). At sacrifice, diseased VTA-shTet2 mice displayed an increased frequency of cKit+ cells in the spleen (Figure S1G) and a predominance of myeloid and erythroid cells. BM Lineage Sca1+Kit+ (LSK) cells, Lineage-Sca1− cKit+ (cKit+ progenitors), and CD34+ FcR-expressing granulocyte and myeloid progenitors also were increased (Figure S1H). These data are consistent with mouse models of Tet2 deficiency.
The kinetics of Tet2 knockdown and restoration were assessed in cohorts of VTA and RTA-shTet2 mice fed Dox food for 28 days (Figure 1D). After 3–7 days of Dox, GFP expression was induced and sustained in the PB of RTA-shTet2 mice (Figure 1E), whereas complete loss of GFP was detectable after 7–14 days in VTA-shTet2 mice (Figure 1F). By 3 days of Dox treatment, depletion of Tet2 mRNA was observed in cKit+ HSPCs (Figure 1G) and immature CD11b+ myeloid lineage cells (Figure 1H) purified from RTA-shTet2 BM, whereas complete restoration of endogenous Tet2 levels inVTA-shTet2 mice was achieved by 28 days.
Tet2 Restoration Reverses Aberrant Self-Renewal
Tet2-deficient HSPCs exhibit increased re-plating capacity in colony-forming assays and a competitive advantage in BM reconstitution studies (Moran-Crusio et al., 2011; Quivoron et al., 2011). To ask if sustained loss of Tet2 function is required for aberrant stem cell self-renewal, we first performed serial re-plating assays of VTA-shTet2 colony-forming cells in methylcellulose medium (Figure 2A). Colonies from VTA-shTet2 (Tet2-knockdown) BM were re-plated successively until aberrant self-renewal was observed and then placed in methylcellulose media with or without Dox. Consistent with previous studies comparing wild-type and Tet2-deficient BM cells, control VTA-shRen colonies did not re-plate beyond three passages (P3), while Tet2 knockdown (VTA-shTet2) colonies replated for up to four passages (P4) (Figure 2B). Re-plating for a fifth passage (P5), in the presence of Dox to turn off the expression of shTet2, caused a block in colony-forming capacity, loss of GFP expression (Figures 2C and 2D), and a 2-fold increase in Tet2 mRNA levels (Figure 2E).
Figure 2. Tet2 Restoration Blocks Aberrant Hematopoietic Stem Cell Self-Renewal In Vitro and In Vivo.

(A) Schematic of colony-forming assays performed with Tet2 knockdown cells. After re-plating for four successive passages (P1–P4), VTA shTet2-expressing cells are treated with Dox to determine the effects of Tet2 restoration on re-plating.
(B) Total number of colony-forming units (CFU) generated by VTA shRen control or VTA shTet2 knockdown cells. Data are representative of three experiments (mean + SD), **p < 0.005.
(C) Representative appearance of colonies generated after 4 passages (P4) with Tet2 knockdown re-plated ± Dox from P4–P5.
(D) Number of CFUs from passage 5 (P5) Tet2 knockdown (KD) and Tet2-restored (RS) cells.
(E) Tet2 mRNA levels normalized to Hprt in RS cells relative to KD from (D). Mean + SEM from 3 experiments is shown, **p < 0.005 and ***p < 0.005.
(F and G) Donor peripheral blood cell (PBC) percentage in mice subjected to competitive bone marrow reconstitution and given Dox food from 6 weeks post-transplant of VTA shRen control (F) or VTA shTet2 donor bone marrow cells (G).
(H) Representative flow cytometric analysis of donor chimerism and GFP expression in VTA shTet2-transplanted mice ± Dox treatment at 28 weeks post-transplant.
(I and J) Representation of donor PBCs in the indicated hematopoietic lineages 28 weeks post-transplant in mice with VTA shRen (I) or VTA shTet2 (J) bone marrow cells ± Dox treatment.
(K) Tet2 mRNA levels, normalized to Hprt expression, in Tet2 KD or Tet2 RS cells isolated from VTA shTet2-reconstituted mice at 28 weeks post-transplant. Mean + SEM is shown (n = 4–5 mice per group). *p < 0.05, **p < 0.005.
See also Figure S2.
We next assessed the effect of Tet2 restoration in the context of oncogenes that cooperate with Tet2 deficiency and accelerate leukemia onset, such as AML-ETO9a and FLT3-ITD (Rasmussen et al., 2015; Shih et al., 2015). RTA-shTet2 cKit+ cells transduced with an AML-ET09a-IRES-mCherry (AE9aC)-expressing retrovirus or total BM cells from Flt3-ITD; RTA-shTet2 mice were serially re-plated in methylcellulose. Tet2 knockdown increased the re-plating capacity of AE9aC-expressing (Figure S2A) and Flt3-ITD-expressing (Figure S2B) cells, whereas Tet2 restoration impaired re-plating (Figures S2C–S2F) and promoted myeloid differentiation (Figures S2G and S2H).
To determine the effect of Tet2 restoration on HSC self-renewal in vivo, we performed competitive bone marrow transplantation (BMT) assays. As reported previously for Tet2+/− and Tet2− /− BM, Tet2 knockdown cells displayed a competitive advantage (Figure S2I) and a myeloid lineage bias in donor PB (Figure S2J). Beginning at 6 weeks post-transplant, Dox food was administered to half of the cohort, and treated and untreated mice were monitored for donor chimerism for up to 28 weeks. VTA-shRen donor frequency in PB remained unchanged upon Dox treatment (Figure 2F), whereas Dox-treated VTA-shTet2 recipients showed a significant loss of competitiveness from 20 weeks post-transplant (Figure 2G), which correlated with loss of fluorescence-coupled shRNA expression (Figure 2H). Dox treatment also reversed the myeloid lineage bias caused by Tet2 knockdown in VTA shTet2 donor PB (Figures 2I–2J). Administering Dox from the day of transplant (0 weeks), or pre-treating donor mice with Dox for 4 weeks prior to BMT (−4 weeks), was even more effective at blocking the competitive advantage of VTA-shTet2 knockdown cells upon restoration than treatment beginning at 6 weeks or 12 weeks post-transplant (Figures S2K and S2L). Significant loss of donor chimerism upon Tet2 restoration was observed in all stem and progenitor cell compartments and in myeloid lineage cells of the BM and spleen (Figure S2M). These effects correlated with an ~2-fold increase in Tet2 expression in sorted populations of donor LSK, cKit+ progenitors, and immature CD11b+ cells (Figure 2K). Therefore, sustained Tet2 deficiency is required to maintain aberrant HSC self-renewal, and its effects are reversed upon Tet2 restoration.
Tet2 Restoration Promotes Myeloid Differentiation and Cell Death in HSPCs
To study how Tet2 restoration influences HSC function, we generated inducible cKit+ Tet2 knockdown cell lines in cytokine-containing media. Inducing Tet2 knockdown in RTA-shTet2 cKit+ cells over a 2-week period led to reduced Tet2 mRNA levels (2- to 2.5-fold), compared with those in control RTA-shRen cells (Figures S3A and S3B). Tet2 expression was restored completely 10–14 days following Dox-withdrawal (Figures 3A, S3C, and S3D). Similar kinetics of Tet2 restoration were observed in Dox-treated VTA-shTet2 cells (Figures S3E and S3F). Restoring Tet2 caused a block in cell proliferation (Figures 3B, S3G, and S3H), due to an increase in annexinV+ apoptotic cells (Figure 3C) and a delay in cell-cycle progression (Figures S3I and S3J).
Figure 3. Tet2 Restoration Promotes DNA Demethylation, Differentiation, and Cell Death.

(A–E) Effects of Tet2 restoration on Tet2 mRNA levels, proliferation, survival, and differentiation of cKit+ cells. Tet2 mRNA levels (normalized to Hprt) in cKit+ cells grown in liquid culture for 28 days with sustained Tet2 knockdown (KD) or inducible restoration (RS) upon Dox administration (A). Proliferation (B) and apoptosis, as assessed by Annexin V staining (C), of Tet2 RS versus sustained Tet2 KD cells. Representative flow cytometry histograms of stem and progenitor (cKit and CD34) or differentiation (CD11b) marker expression upon Tet2 KD or Tet2 RS after 21 days in culture (D). Quantification of GFP by relative mean fluorescence intensity (MFI) is shown (E).
(F and G) Global changes in methylation were measured in genomic DNA isolated from cKit+ cells during inducible Tet2 RS, and compared to cells with sustained Tet2 KD. Quantification was performed using ELISAs for 5mC (F) and 5hmC (G). Mean ± SEM is shown for 2 biological replicates, performed in triplicate. *p < 0.05, **p < 0.005, and ***p < 0.005.
See also Figure S3.
Tet2 knockdown cells in culture expressed cKit, Sca1, and CD34 on their surface in addition to low expression of the SLAM markers CD150 and CD48, but were negative for FcR and the myeloid lineage markers Gr1 and CD11b (Figure S3K). Upon prolonged Tet2 restoration (Days 18 and 21), a slight decrease in cKit+ surface expression was detected, while CD11b and CD34 expression increased modestly (Figures 3D and 3E). Increased CD34 expression is associated with loss of long-term self-renewal potential in mouse HSCs (Wilson et al., 2008), and Tet2 has been shown to facilitate the expression of myeloid-specific genes such as Mac1/CD11b in B cells undergoing CEBPα-induced trans-differentiation (Kallin et al., 2012). Hence, these data suggest that loss of aberrant self-renewal capacity in Tet2-restored cells is associated with impaired proliferation, increased cell death, and priming toward myeloid differentiation.
Differential Methylation Correlates with Global Transcriptional Changes upon Tet2 Restoration
Steady-state Tet deficiency, modeled in mouse ESCs and HSCs, is associated with genomic loss of hydroxymethylation and DNA hypermethylation (Pastor et al., 2013). Similarly, significant DNA hypermethylation (gain of 5mC) and decreased hydroxymethylation (loss of 5hmC) was induced upon Tet2 knockdown in HSPCs (Figure S3L). Conversely, DNA demethylation (~30% loss of total 5mC) was observed after 7–10 days of Tet2 restoration in cKit+ Tet2-knockdown cells (Figure 3F); concomitantly, 5hmC levels increased 10–14 days after restoration to almost 2-fold those of knockdown levels (Figure 3G). These findings are consistent with a role for TET2 in promoting DNA demethylation. Interestingly, global methylation levels were restored after 14 days despite peak Tet2 restoration; these regions of the genome could represent newly methylated loci in combination with higher levels of 5hmC.
TET family members can promote gene activation or repression (Pastor et al., 2013; Shen et al., 2014), and these transcriptional alterations are coupled to altered DNA methylation across gene bodies, enhancers, and at the boundaries of DNA methylation canyons (Rasmussen et al., 2015; Wiehle et al., 2015). To identify the locus-specific changes in DNA methylation upon Tet2 restoration, we performed single base resolution reduced representative bisulfite sequencing (RRBS) (Gu et al., 2011). Differentially methylated cytosines (DMCs) either gained or lost methylation and were most abundant after 10 days of Tet2 restoration (Figures 4A and S4A). Differentially methylated regions (DMRs) exhibited greater losses than gains in methylation at CpG shores (>2 kb distance from CpG islands) and across exons and introns, suggesting loss of DNA methylation specifically within gene bodies (Figure 4B). Determining which genomic regions are direct targets of TET2 in primary hematopoietic cells by chromatin-binding studies has been hindered by the lack of antibodies that recognize endogenous TET2. However, by using a TET2 chromatin immunoprecipitation sequencing (ChIP-seq) signature generated by overexpressed, flag-tagged TET2 in mouse erythroid leukemia cells (Pan et al., 2017), we found that at day 10 of restoration, TET2-bound DMRs were highest at promoters, exons, and CpG shores, with CpG island DMRs enriched for TET2 binding from days 7–14 of restoration (Figures S4B and S4C).
Figure 4. Differential Methylation and Global Transcriptional Changes upon Tet2 Restoration.

(A and B) Reduced representation bisulfite sequencing (RRBS) of DNA from cKit+ cells in vitro, showing the number of differentially methylated cytosines (DMCs) (q < 0.05, DiffMeth >10%) (A) and the distribution of differentially methylated regions (DMRs) according to CpG context and genomic location (B) at 10 days of Tet2 restoration (q < 0.05, DiffMeth >10%, 500 bp window).
(C–F) Distribution of differentially expressed genes (DEGS, p < 0.05) in cKit+ cells subjected to Tet2 restoration for the indicated times. The average log2 fold-changes in all upregulated genes (C) with >2-fold change in expression (D) and in all downregulated genes (E) with >2-fold change in expression (F) are shown.
(G–I) Gene-expression analysis and gene set enrichment analysis (GSEA). Heatmap shows a subset of differentially expressed genes in cKit+ cells subjected to Tet2 restoration for the indicated times (G). GSEA plots of genes hypermethylated in AML patients that are upregulated in Tet2 restored cells (H) or hypo-methylated genes in AML patients that are downregulated upon Tet2 restoration (I) (related to Table S1). Decreased gene expression is indicated by shades of blue; increased expression is indicated by shades of red. RRBS and RNA-seq were performed on 2 replicates per time point. *p < 0.05, **p < 0.005, and ***p < 0.005.
See also Figure S4.
Transcriptomic analysis revealed a strong bias toward upregulation of genes (n = 173) as opposed to gene down-regulation (n = 15), with >2-fold changes (p < 0.05) after 10 days of Tet2 restoration (Figures 4C and 4D). This bias correlated with the peak in differential methylation observed at day 10 of Tet2 restoration (Figures 3G and 4A). The tendency toward greater downregulation of gene expression by 14 days of restoration might reflect a slowing of cell proliferation or activation of cell death in response to a threshold level of Tet2 achieved by 10 days of restoration (Figures 4E and 4F).
Tet2 Restoration Drives Loss of Aberrant DNA Methylation and Expression of Myeloid Differentiation Genes
Gene set enrichment analysis (GSEA) revealed that genes up-regulated upon 14 days of restoration included cytoskeletal regulators that are highly expressed in differentiated myeloid lineage cells, including Ras homolog gene family, member C (RhoC) and Ras and Rab interactor 2 (Rin2), the epigenetic regulator DNA-methyltransferase 3b (Dnmt3b), and the transcription factor early B cell factor-1 (Ebf1). Conversely, genes important for cytokine signaling, such as the Map kinase family member Map3k14, were downregulated (Figure 4G). Ingenuity Pathway Analysis revealed apoptosis, death receptor signaling, and DNA damage response pathways (p53 signaling) to be specifically upregulated at 10 days of restoration (Figure S4D). These pathways might reflect active DNA de-methylation as the primary response to Tet2 restoration in these cells, despite a peak in 5hmC levels by 14 days of restoration.
TET2 mutant leukemia patients exhibit DNA hypermethylation, and distinct AML subtypes can be identified by their unique methylation signatures (Figueroa et al., 2010). By 14 days of Tet2 restoration, the mouse orthologs of genes hypermethylated in AML patients tended to be upregulated; conversely, genes hypomethylated in AML were downregulated. Specifically, 5/7 unique gene clusters that are aberrantly hypermethylated in subtypes of AML compared with normal human CD34+ cells were significantly upregulated (false discovery rate [FDR] <0.25) following Tet2 restoration (Figures 4H and 4I; Table S1). Upregulated genes included those hyper-methylated in patients with AML1-ETO (t(8;21)) or PML-RAR translocations or bearing CEBPA mutations (Table S1).
Vitamin C Treatment Mimics Effects of Tet2 Restoration
Our findings suggested that TET2 restoration could provide a novel therapeutic strategy to target TET2 mutant cells in patients with clonal hematopoiesis, MDS, or AML. As genetic restoration is not an option in patients, we sought to pharmacologically augment TET activity. Vitamin C is a co-factor of α-KGDDs and can increase 5hmC and promote TET-dependent DNA demethylation (Young et al., 2015). Biochemical studies suggest that vitamin C binds TET2 and acts as a targeted electron donor to restore iron to the Fe2+ state in the TET catalytic cycle, thereby increasing the rate of 5mC oxidation by up to 8-fold (Yin et al., 2013). We hypothesized that vitamin C treatment, by increasing TET catalytic activity, might pharmacologically mimic Tet2 restoration in Tet2-deficient HSCs.
Treatment of wild-type Lin− cKit+ cell cultures with vitamin C (L-ascorbic acid [L-AA]) led to a 2-fold increase in 5hmC and a 2-fold loss in 5mC in genomic DNA, as measured by dot blot analysis (Figure 5A). Moreover, whereas Tet2+/− or Tet2− /− cells showed aberrant re-plating capacity (>4 passages) when treated with PBS, vitamin C-treated cells showed a severe block in re-plating capacity (Figure 5B). Importantly, vitamin C did not affect colony formation by wild-type cells. High levels of vitamin C can lead to reactive oxygen species (ROS) production via the Fenton reaction (Du et al., 2012). However, serial re-plating capacity was still blocked when catalase, an enzyme that can decompose hydrogen peroxide (H2O2) to water and oxygen, was included with vitamin C in the media (Figure 5C).
Figure 5. Vitamin C Treatment Mimics Tet2 Restoration in Hematopoietic Stem Cells and Blocks Myeloid Disease Progression.

(A) DNA dot blots for 5hmC and 5mC in genomic DNA from primary mouse cKit+ cells treated with 250 μM vitamin C (L-ascorbic acid, L-AA) for 6 days. Data are representative of 2 experiments.
(B–D) Colony-formation assays with Tet2+/+, Tet2+/−, and Tet2−/− bone marrow cells treated with L-AA. Cells were re-plated for four passages (P1–P4) (B), Tet2−/− CFUs re-plated from passage 4 to 5 (P4–P5) ± catalase (C), and Tet2+/−, Tet2−/−, and Tet2/3 double-deficient colonies re-plated from P4 to P5. Data shown are the means + SEM of 4 experiments for each genotype, assayed in triplicate.
(E and F) DNA dot-blot for 5hmC in primary mouse cKit+ cells cultured for 6 days ± L-ascorbic acid (L-AA) (E), and relative Tet1, Tet2, and Tet3 mRNA levels in cKit+ cells, quantified by RT-PCR and normalized to Hprt (F). Data are representative of 2 experiments.
(G) Time course showing increase in 5hmC levels (quantified by flow cytometry) in peripheral blood cells of mice treated with a single i.p. injection of sodium ascorbate.
(H–J) Vitamin C treatment of mice reconstituted with Tet2+/+ and Tet2−/− bone marrow. Mice were injected i.p. with PBS (control) or ascorbate (ASC, 4 g/kg), and white blood cell (WBC) counts were monitored for 24 weeks post-transplant (PT) (H). Frequency (I) and number (J) of donor B and T lymphocytes and myeloid cells (M) in peripheral blood of recipients at 24 weeks PT treated with ASC or control (PBS). *p < 0.05, **p < 0.005, and ***p < 0.005 in all experiments.
See also Figure S5.
There are multiple members of the α-KGDD family, and most, if not all of these, use vitamin C as a co-factor (Young et al., 2015). Although the ability of vitamin C to suppress re-plating correlated with increased 5hmC and decreased 5mC levels in DNA, these findings alone do not establish that vitamin C affects self-renewal via TET family members. Notably, Tet2−/− cells were somewhat resistant to the effects of vitamin C, yet still showed decreased re-plating compared with untreated cells (Figure 5D). Conceivably, other TET family members compensate for the absence of Tet2 and mediate the effects of vitamin C on Tet2−/− cells; alternatively, vitamin C could act through other α-KGDDs. Tet2 and Tet3 are the most abundantly expressed Tet genes in HSPCs (An et al., 2015). We therefore performed colony-forming assays with BM cells from Tet2+/−, Tet2−/−, and Tet2−/− Tet3-knockdown, the latter generated by crossing Tet2−/− mice to RTA transgenic shTet3 mice (Tet2−/− Tet3KD). Tet2−/− Tet3KD cells exhibited increased re-plating capacity (Figure S5A), comparable to Tet2+/− and Tet2−/− cells. However, Tet2−/− Tet3KD cells were far more resistant than Tet2−/− cells to the inhibitory effect of vitamin C on serial re-plating (Figures 5D and S5A). Furthermore, vitamin C-evoked 5hmC generation was markedly impaired in Tet2−/− Tet3KD cKit+ cells (Figure 5E), consistent with the significantly decreased Tet2 and Tet3 mRNA levels in Tet2−/−Tet3KD cells (Figure 5F). Together, these data suggest that vitamin C blocks aberrant HSPC self-renewal primarily by increasing TET2 and TET3 activity.
Vitamin C is an essential dietary requirement in humans, due to mutation in the enzyme L-gulonolactone oxidase, which remains functional in mice (Young et al., 2015). Despite being able to generate vitamin C in the absence of dietary supplementation, mice deficient in Tet2 still develop myeloid malignancies that mimic human disease. This finding suggests that supra-physiological doses of vitamin C might be required in vivo to block TET2 mutant hematopoietic neoplasia. Previous pharmacokinetic studies showed that administration of vitamin C as sodium ascorbate (ASC) by intraperitoneal (i.p.) injection in mice can increase plasma levels from approximately 10 μM up to 30 mM for 10–30 min and remain >200 μM for up to 4 hr (Yun et al., 2015). To ask if high-dose vitamin C could induce 5hmC production in vivo, we injected a cohort of mice with a single dose of ASC (4 g/kg). Flow cytometric analysis of 5hmC in PB revealed an increase in 5hmC that remained ~2-fold above baseline levels for 2–6 hr post-injection (Figure 5G). We then tested the effect of daily injections of ASC for 3 successive days and again found 5hmC levels to be higher than baseline, with a 2-fold loss in 5mC in PB (Figure S5B).
As Tet2 restoration blocks myeloid disease progression following BMT, we treated mice reconstituted with Tet2+/+ or Tet2−/− BM with i.p. injections of PBS or ASC for 24 weeks (Figure S5C). As expected, compared with Tet2+/+ recipients, Tet2−/− mice developed CMML-like disease with elevated WBC counts from 12 weeks post-transplant in the PBS-injected group that increased progressively to 24 weeks. Remarkably, and consistent with its effects in vitro, ASC treatment significantly decreased WBC counts (Figure 5H) and CMML progression in Tet2−/− mice. Minor decreases in WBC counts were also observed in ASC-injected Tet2+/+ recipients. The decrease in Tet2−/− WBCs upon ASC treatment correlated with a diminished frequency of myeloid lineage donor cells (Figure 5I) and decreased numbers of circulating myeloid cells in PB (Figure 5J).
Next, we performed colony-forming and liquid differentiation assays with purified leukemic HSPCs and blasts from three TET2 mutant patients (Table S2). Similar to our observations on Tet2-deficient mouse cells, patient-derived HSPCs and blasts showed decreased clonogenicity in methylcellulose assays (Figure S5D) and increased surface expression of the myeloid marker CD14 in liquid culture upon treatment with vitamin C (Figure S5E).
We also evaluated the effects of ASC on two primary human AML PDX models (Table S2). Upon detection of >1% human CD45+ (hCD45+) cells in PB, mice were treated i.p. with PBS or ASC (Figure S5F). Circulating hCD45+ cells in PB, spleen weight, and blast frequency in BM and spleen were all reduced in ASC-treated PDXs, compared with PBS controls (Figures S5G–S5J). These data suggest that high-dose vitamin C treatment could be effective for preventing myeloid disease progression.
Vitamin C Increases TET Activity in Human AML Cells and Drives DNA Hypomethylation
The ability of vitamin C to block self-renewal and myeloid disease progression in mice prompted us to explore its effects on TET function and 5hmC generation in the HL60 and MOLM13 cell lines, representative of acute myeloblastic and acute monocytic leukemia, respectively (Table S3). These cell lines do not harbor TET mutations (Barretina et al., 2012) but were shown to be sensitive to vitamin C treatment in a previous study (Kawada et al., 2013); however, a mechanistic role for TET activity and 5hmC in the effects of vitamin C was not explored. Consistent with our observations using mouse HSPCs, vitamin C treatment for 72 hr caused increased 5hmC formation in both lines (Figure 6A), without altering TET1-3 expression (Figure S6A). We performed 5hmC DNA immunoprecipitation (5hmeDIP) with genomic DNA from untreated HL60 cells (0 hr) and cells treated for 72 hr with vitamin C. Nearly all differentially hydroxymethylated peaks (29,492; 97%) exhibited gain of 5hmC upon vitamin C treatment (Figure 6B). Increased 5hmC was enriched within gene bodies, compared with transcription start sites (TSS) or transcription end sites (TES) (Figure 6C), and in the center of CpG islands and at CpG shores (+/− 3 kb) (Figure S6B). Traditional bisulfite sequencing does not distinguish between 5mC and 5hmC. Therefore, we performed oxidative RRBS (oxRRBS), which first converts 5hmC to 5fC and, after bisulfite treatment and sequencing, allows comparative DNA methylation changes to be quantified specifically at 5mC sites (Booth et al., 2013). We observed a 2-fold loss in 5mC by 72 hr of vitamin C treatment in both leukemia cell lines (Figures 6D and S6C). DMRs were distributed almost identically in the two lines, with 50% located within CpG islands and shores and >70% associated with gene bodies and promoters (Figure 6E). Greater loss than gain in 5mC was observed across almost all chromosomes (Figure 6F) with 1.5- to 2-fold greater loss in 5mC in all CpG contexts and genomic loci (Figure 6G).
Figure 6. Vitamin C Treatment Increases TET Activity in Human AML and Drives DNA Hypomethylation.

(A) DNA dot blots for 5hmC in MOLM13 and HL60 cells treated for 72 hr with 250 μM L-ascorbic acid (L-AA). Data are representative of 2 experiments.
(B and C) Differentially hydroxymethylated peaks (Diff Peaks) with gain or loss of 5hmC (Diff Peaks, q < 0.05), assayed by 5hmeDIP-seq, in HL60 cells treated with 250 μM L-AA for 72 hr. Frequency and total number of significant Diff Peaks (B) and gene body distribution of the top 10,000 significant peaks following L-AA treatment (C), displayed as peak density ± 3 kb from the transcription start site (TSS) to the transcription termination site (TTS).
(D) Number of differentially methylated cytosines (DMCs), either hypermethylated (gain of 5mC) or hypomethylated (loss of 5mC), in HL60 and MOLM13 cells treated for 72 hr with 250 μM L-AA, assayed by bisulfite sequencing (q < 0.05, DiffMeth >25%).
(E–G) Differentially methylated regions (DMRs) in 72 hr L-AA-treated HL60 and MOLM13 cells (q < 0.05, DiffMeth >10%, 500 bp). Total DMR frequencies, according to CpG context and genomic location (E), are shown as the frequency of hypermethylated (gain of 5mC) or hypomethylated (loss of 5mC) DMRs across all chromosomes (F) and by the total number of DMRs with gain or loss of 5mC according to CpG context and genomic location (G).
(H) Gene-set enrichment analysis for up- and downregulated genes associated with 10 days of Tet2 restoration in cKit+ cells (497 upregulated and 136 downregulated, Log2FC, p < 0.05) in HL60 and MOLM13 cells treated with L-AA (250 μM) for 12 hr. Lowest gene expression (dark blue) to highest expression (red) is displayed for each plot.
(I) Heatmap showing expression of genes upregulated by Tet2 restoration in cKit+ cells in HL60 and MOLM13 cells treated with L-AA (250 μM) for 0, 12, or 72 hr. Scale represents log-transformed counts, normalized by library size, from lowest (dark blue) to highest expression (red). For all sequencing experiments, 3 replicates were analyzed per time point.
See also Figure S6.
Transcriptomic analysis revealed strong overlap in the vitamin C-regulated genes in HL60 and MOLM13 cells after 12 hr of treatment (Figure S6D), although there was less overlap at 72 hr (Figure S6E). Nevertheless, there was enrichment for Tet2-restored genes from mouse cKit+ cells following 12 hr of vitamin C treatment of both human leukemia lines (Figure S6F), which remained significant in MOLM13 cells at 72 hr (Figures 6H and S6G). Fourteen out of 50 (14/50) genes upregulated by Tet2 restoration in mouse cKit+ cells also were induced in both human leukemia lines after 12 hr of vitamin C treatment, including genes involved in apoptotic and death receptor signaling (BAX, GADD45a), phosphatidylcholine biosynthesis (CHKA and CHKB), and NOTCH signaling (PSENEN) (Figure 6I). Of the top genes downregulated by Tet2-restoration, 34/50 were downregulated in both leukemia lines after 12 hr of vitamin C (Figure S6H). Hence, vitamin C treatment can enhance TET2 function in human leukemia cells in a manner similar to the effects of Tet2 restoration in mouse HSPCs.
TET-Mediated Oxidation of DNA by Vitamin C in Combination with PARP Inhibition Enhances AML Cell Death
We observed significant decreases in cell viability of Tet2+/−, Tet2−/−, and Tet2−/− Tet3KD mouse cKit+ cells during liquid culture (2 weeks) in the presence of increasing concentrations of vitamin C (Figure S7A). As seen in colony-forming assays, vitamin C had less effect on the viability of Tet2−/− and Tet2−/− Tet3KD cells in liquid culture compared with Tet2+/− cells. Remarkably, Tet2 restoration or vitamin C treatment of AML-ETO9a-expressing or FLT3-ITD-expressing, Tet2 knockdown cells also impaired their proliferation in liquid culture (Figures S7B and S7C). We therefore extended our analysis of the effects of vitamin C on 5hmC formation and cell viability to a panel of human myeloid leukemia lines, including (in addition to HL60 and MOLM13) K562 (blast crisis chronic myeloid leukemia), THP1 (acute monocytic leukemia), and KG-1 and KASUMI-1 (acute myeloblastic leukemias) (Table S3). Vitamin C caused decreased viability after 72 hr of treatment in all cell lines (Figure 7A) without any change in TET1-3 expression (Figure S7D). The effects on proliferation increased at higher vitamin C concentrations (up to 1 mM), but there was a substantial decrease in viability even at lower doses (125 μM) when cells were treated for up to 2 weeks (Figure S7E).
Figure 7. TET-Mediated Oxidation of DNA in Vitamin C-Treated Leukemia Cells Increases Killing in Combination with PARP Inhibition.

(A) Relative viability of human leukemia lines grown for 3 days in increasing concentrations of L-ascorbic acid (L-AA). Shown are means ± SD. Data for 4 experiments.
(B and C) Dot blots of genomic DNA from human leukemia lines subjected to 0, 24, and 72 hr of L-AA treatment, probed for 5hmC (B), and from HL60 and MOLM13 probed for 5hmC, 5fC, 5caC, and 5mC (C). Data are representative of 3 experiments.
(D–F) Fold-changes in mRNA levels of genes associated with BER and active DNA demethylation in Tet2-restored mouse HSPCs and vitamin C-treated human leukemia cells. Fold-changes were calculated from normalized counts from RNA-sequencing in day 10-restored cKit+ cells, relative to knockdown (D), and in 12 hr L-AA-treated, relative to untreated, HL60 (E) and MOLM13 cells (F). *p < 0.05, **p < 0.00, and ***p < 0.005.
(G) Relative viability of AML lines treated with L-AA in combination with PARP inhibitor (Olaparib) at the indicated concentrations. Cells were assayed in triplicate at each concentration. Mean ± SEM are shown for 3 independent experiments.
See also Figure S7.
Levels of 5hmC increased in DNA from all human leukemia cells tested in response to vitamin C treatment for 72 hr (Figure 7B). Although 5hmC is a stable modification, its iterative oxidation products, 5fC and 5caC, recruit the BER machinery and are actively removed by thymidine DNA glycosylase (TDG) (Shen et al., 2014). Notably, vitamin C-treated human AML cells exhibited 5fC depletion, changes in 5caC levels and loss of 5mC (Figure 7C), suggestive of active DNA demethylation by BER. As noted above, vitamin C can generate increased H2O2, which could promote oxidative DNA damage and trigger DNA repair (Cadet and Wagner, 2013). However, 2-phospho-L-ascorbic acid (P-AA), which does not generate ROS (Du et al., 2012), also induced 5hmC formation and cell death in AML cells (Figures S7F and S7G). Moreover, vitamin C (at 250 μM or 1 mM) did not increase dichlorofluorescein (DCF) fluorescence, an indicator of intracellular ROS (Figure S7H).
Poly ADP ribose polymerase (PARP) is an essential mediator of BER that targets single-strand breaks (SSBs) induced by DNA damage and recruits BER complex proteins (Morales et al., 2014). The peak of DNA demethylation upon 10 days of Tet2 restoration to cKit+ cells correlated with increased expression of Parp and Gadd45 (Figure 7D), whose gene products function in DNA demethylation (Barreto et al., 2007; Ciccarone et al., 2012). As noted above, Tet2 restoration also evoked a p53 transcriptional signature, consistent with a DNA damage response (Figure S4D). We therefore compared the expression of PARP, GADD45, and additional genes involved in BER and active DNA demethylation, including DNA glycosylases (MBD4, UNG, TDG, SMUG1, MUTYH), ligases (NEIL1/2), endonucleases (APEX1/2, FEN1), and polymerases (POLDβ, POLD1/2) in vitamin C-treated human AML cells. Indeed, BER genes such as PARP and GADD45 were upregulated in HL60 (Figure 7E) and MOLM13 cells (Figure 7F), indicating that Tet2 restoration and vitamin C treatment induce the expression of genes whose products mediate active DNA demethylation.
PARP inhibition can increase tumor sensitivity to DNA damage induced by chemotherapy and results in synthetic lethality in cells lacking intact BER or harboring homologous recombination (HR) defects (Morales et al., 2014). We hypothesized that TET-mediated DNA oxidation induced by vitamin C could render AML cells hypersensitive to PARP inhibition by blocking DNA repair associated with DNA demethylation. To test this possibility, we treated AML cell lines with combinations of the PARP inhibitor olaparib and vitamin C (L-AA), at varying doses. Remarkably, combination olaparib/vitamin C treatment caused a greater loss in viability of HL60, MOLM13, THP1, and KG1 cells than either agent alone (Figures 7G and S7I).
DISCUSSION
We have found that targeted restoration of Tet2 is sufficient to block aberrant self-renewal of pre-leukemic stem cells. Similarly, vitamin C, by enhancing the activity of TET family dioxygenases, acts as a pharmacologic mimic of Tet2 restoration. Moreover, genetic or pharmacological restoration of TET activity confers an emergent vulnerability in leukemia cells, rendering them more sensitive to PARP inhibitors. Together, these results suggest new therapeutic strategies for clonal hematopoiesis, MDS and AML.
In the 1970s, Cameron et al. (1979) first administered high-dose intravenous (i.v.) vitamin C, in parallel with oral supplementation, to treat solid tumors, and saw some clinical responses. Subsequent clinical trials failed to show any therapeutic benefit of high-dose vitamin C, but these failures might have been due to the intrinsically limited bioavailability of orally administered vitamin C (Padayatty and Levine, 2016). Intracellular vitamin C levels in humans vary from 1 mM in WBCs to 10 mM in brain cells. Yet, following oral administration of very high doses of vitamin C (>500 mg/day), maximal plasma concentrations do not exceed 150 μM, due to homeostatic downregulation of the sodium-dependent vitamin C transporter that regulates intestinal absorption (Young et al., 2015). By contrast, i.v. administration of vitamin C can yield plasma levels up to 100-fold higher than normal levels with minimal toxicity (Padayatty and Levine, 2016).
Several recent clinical trials report some clinical benefit of high-dose i.v. vitamin C treatment of solid tumors (Fritz et al., 2014), yet the underlying therapeutic mechanism has remained largely undefined. One study suggested that vitamin C decreases viability of human leukemia cell lines by promoting downregulation of HIF1α and the anti-apoptotic genes, BCL2, BCL2L1, and MCL1 (Kawada et al., 2013). Others recently showed that vitamin C selectively kills KRAS and BRAF mutant colorectal cancer cells by targeting GAPDH (Yun et al., 2015). Vitamin C treatment of various cancer cell lines also enhances the viral mimicry response to DNA methyltransferase inhibitors such as 5-azacytidine (Liu et al., 2016). Given the diversity of α-KG and Fe2+-dependent enzymes that utilize vitamin C as a co-factor (including prolylhydroxylases, jumonji histone demethylases, and TET enzymes) (Young et al., 2015), the mechanistic basis for vitamin C action could well depend on the type of cancer and/or its dependence on specific dioxygenases.
Most leukemia patients with TET2 mutations or deletions exhibit mono-allelic TET2 loss (Abdel-Wahab et al., 2009; Delhommeau et al., 2009), and disease progression in Tet2+/− and Tet2−/− mice is almost indistinguishable (Moran-Crusio et al., 2011), indicating that even a 50% loss of TET2 function can initiate aberrant hematopoiesis. We have found that vitamin C impairs aberrant re-plating capacity and myeloid disease progression in HSPCs even in the complete absence of functional Tet2. Recent studies have shown that Tet2 and Tet3 exhibit overlapping tumor suppressive roles, as both are highly expressed in myeloid progenitors and their combined deletion leads to rapid and aggressive AML (An et al., 2015). TET3 activation might compensate sufficiently for lack of TET2 to diminish aberrant self-renewal upon vitamin C treatment. Indeed, we find that combined Tet2/Tet3 deficiency causes severe depletion of steady-state 5hmC in HSPC DNA, diminished capacity for 5hmC generation in response to vitamin C, and markedly decreased efficacy of vitamin C in suppressing aberrant self-renewal. These findings suggest that vitamin C acts predominantly through TETs, and accordingly, a minimal amount of TET activity is required for vitamin C action.
MDS and AML patients are typically elderly, with a median age of 65–70 years at disease onset. Intensive myeloablative treatment regimens are possible in only a minority of such patients and are associated with decreased efficacy and increased therapy-related mortality (Zeidan et al., 2014). DNA hypomethylating agents (HMAs) elicit higher overall response rates in MDS and AML patients with TET2 mutations and provide an alternative to aggressive chemotherapy (Bejar et al., 2014). Re-expression of tumor suppressors has been the main focus of HMAs; however, the DNA damage response is also an important regulator of active DNA demethylation. While 5mC and 5hmC are stable modifications in the genome, 5fC and 5caC are normally present at very low levels, and their accumulation would lead to an increased requirement for BER to remove these modifications. This requirement, in turn, confers an emergent vulnerability on these cells, rendering them more sensitive to inhibitors of BER, such as PARPi, that can be exploited for targeted therapy.
Decreased TET expression and loss of 5hmC are seen in a wide variety of solid tumors, as well as in many hematologic malignancies (Rasmussen and Helin, 2016). Our results suggest that future clinical trials should incorporate high-dose vitamin C as an adjuvant to standard chemotherapy/demethylating therapy, especially for TET2-deficient neoplasms, and also predict further improvement in efficacy with the addition of PARP inhibition.
STAR+METHODS
KEY RESOURCES TABLE
| REAGENT or RESOURCE | SOURCE | IDENTIFIER |
|---|---|---|
| Antibodies | ||
| Rabbit polyclonal anti-5hmC | Active Motif | Cat# 39791 |
| Rabbit polyclonal anti-5fC | Active Motif | Cat# 61223 |
| Rabbit polyclonal anti-5caC | Active Motif | Cat# 61229 |
| Mouse monoclonal anti-5mC | Zymo Research | Cat# ZRC180674 |
| Goat anti-rabbit IgG AlexaFluor594 | Life Technologies | Cat# A11012 |
| anti-mouse CD45.1 PercP-Cy5.5 conjugated (A20) | eBioscience | 45-0453-82 |
| anti-mouse CD45.2 Biotinylated (104) | BioLegend | 109804 |
| anti-mouse B220 PECy7 conjugated (RA3-6B2) | BD Biosciences | 552772 |
| anti-mouse CD3 APC conjugated (145-2C11) | BioLegend | 100312 |
| anti-mouse CD11b/Mac1 APCCy7-conjugated (M1/70) | BioLegend | 101226 |
| anti-mouse Gr1/Ly6G/C APCCy7 conjugated (RB6-8C5) | BioLegend | 108424 |
| anti-mouse CD71 PE conjugated (RI7217) | BioLegend | 113808 |
| anti-mouse Ter119 PerCP-Cy5.5 conjugated (TER-119) | BioLegend | 116228 |
| anti-mouse CD4 APCCy7 conjugated (RM4-5) | BioLegend | 100526 |
| anti-mouse CD8 APCCy7 conjugated (53-6.7) | BioLegend | 100714 |
| anti-mouse cKit APCCy7 conjugated (2B8) | BioLegend | 105826 |
| anti-mouse CD34 eFluor660 conjugated (RAM34) | eBioscience | 50-0341-82 |
| anti-mouse FcR eFluor450 conjugated (93) | eBioscience | 48-0161-82 |
| anti-mouse Sca1 PECy7 conjugated (D7) | BioLegend | 108114 |
| anti-mouse CD150 PE conjugated (TC15-12F12.2) | BioLegend | 115904 |
| anti-mouse CD48 Pacific blue conjugated (HM48-1) | BioLegend | 103418 |
| anti-human CD45 BV510 conjugated (2D1) | BD Biosciences | 659482 |
| anti-human CD99 FITC conjugated (TÜ 12) | BD Biosciences | 561986 |
| anti-human CD34 Pacific Blue conjugated (581) | BioLegend | 343511 |
| anti-human CD38 PECy7 conjugated (HIT2) | BD Biosciences | 560677 |
| anti-human CD14 BV421 conjugated (MPhiP9) | BD Biosciences | 659450 |
| Streptavidin conjugated Pacific Blue | Life Technologies | Cat#S11222 |
| Donkey anti-rabbit IgG HRP | GE Healthcare | NA934 |
| Sheep anti-mouse IgG HRP | GE Healthcare | NA931 |
| Rabbit polyclonal anti-GFP | ThermoFisher | A-11122 |
| Rabbit polyclonal anti-TurboGFP | ThermoFisher | PA5-22688 |
| Chemicals, Peptides, and Recombinant Proteins | ||
| Phospholipid-binding Protein, APC Annexin V | BD PharMingen | Cat# BDB550474 |
| DAPI (4′,6-Diamidino-2-Phenylindole, Dihydrochloride) | ThermoFisher | Cat# D1306 |
| L-ascorbic acid | Sigma Aldrich | Cat# A4544 |
| 2-Phospho-L-ascorbic acid | Sigma Aldrich | Cat# 49752 |
| Sodium ascorbate | Sigma Aldrich | Cat# A4034-500G |
| Catalase | Sigma Aldrich | Cat# 1345 |
| CM-H2DCFDA (chloromethyl derivative of H2 dichlorofluorescein diacetate) | ThermoFisher | Cat# C6827 |
| Recombinant mouse IL-3 | PeproTech | Cat# 213-13 |
| Recombinant mouse IL-6 | PeproTech | Cat# 216-16 |
| Recombinant mouse SCF | PeproTech | Cat# 250-03 |
| Recombinant human SCF | PeproTech | Cat# 300-07 |
| Recombinant human IL-3 | PeproTech | Cat# 200-03 |
| Recombinant human G-CSF | PeproTech | Cat# 300-23 |
| Recombinant human FLT3-L | PeproTech | Cat# 300-19 |
| Doxycycline Hyclate | MP Biomedicals | ICN19895501 |
| Polybrene | Millipore | Cat# TR-1003-G |
| Olaparib (AZD2281, Ku-0059436) | Selleckchem.com | Cat# S1060 |
| Doxycycline grain-based rodent diet (1g/kg) | Bio-Serv | Cat# 14-726-309 |
| Critical Commercial Assays | ||
| MethylFlash Methylated DNA Quantification Kit (Colorimetric) | Epigentek | Cat# P-1034 |
| MethylFlash Hydroxymethylated DNA Quantification Kit (Colorimetric) | Epigentek | Cat# P-1030 |
| NEXTflex RNA-Seq Kit | Bioo Scientific | Cat# 5129-02 |
| NEBNext Multiplex Oligos for Illumina (Index Primers Set 1) | New England Biolabs | Cat# E7335S |
| NEBNext Multiplex Oligos for Illumina (Index Primers Set 2) | New England Biolabs | Cat# E7500S |
| TrueMethyl Seq Kit | Cambridge Epigenetix | Cat# TM-03-001 |
| CellTiter-Glo luminescence viability assay | Promega | Cat# PAG7572 |
| AnnexinV APC apoptosis detection kit | BD bioscience | Cat# BDB559763 |
| Deposited Data | ||
| Raw and analyzed data | This paper | GEO: GSE97442 |
| TET2-ChIP-seq data | Pan et al., 2017 | GEO: GSE74390 |
| Human reference genome UCSC build hg19 (GRCh37) | Genome Reference Consortium | http://genome.ucsc.edu/cgi-bin/hgGateway?db=hg19 |
| Mouse reference genome UCSC build mm10 (GRCm38) | Genome Reference Consortium | http://genome.ucsc.edu/cgi-bin/hgGateway?db=mm10 |
| Human gene annotation | Ensembl | http://grch37.ensembl.org/Homo_sapiens/Info/Annotation |
| Mouse gene annotation | Ensembl | http://useast.ensembl.org/Mus_musculus/Info/Annotation |
| Experimental Models: Cell Lines | ||
| Human: HL-60 | ATCC | CCL-240 |
| Human: MOLM-13 | DSMZ | ACC 554 |
| Human: KG-1 | ATCC | CCL-246 |
| Human: KASUMI-1 | ATCC | CRL-2724 |
| Human: THP-1 | ATCC | TIB-202 |
| Human: K562 | ATCC | CCL-243 |
| Human: PlatinumE | CELL BIOLABS | RV-101 |
| Experimental Models: Organisms/Strains | ||
| Mouse: Vav-tTA | Kim et al., 2007 | N/A |
| Mouse: TRE-shRen | Dow et al., 2014 | N/A |
| Mouse: B6.Cg-Gt(ROSA)26Sortm1(rtTA*M2)Jae/J (Rosa26-M2rtTA) | The Jackson Laboratory | Stock No: 006965 |
| Mouse: B6.129-Flt3tm1Dgg/J (Flt3-ITD) | The Jackson Laboratory | Stock No: 011112 |
| Mouse: TRE-shTet2 | Mirimus / This paper | N/A |
| Mouse: TRE-shTet3 | Mirimus / This paper | N/A |
| Mouse: B6.SJL-Ptprca Pepcb/BoyJ (CD45.1) | The Jackson Laboratory | Stock No: 002014 |
| Mouse: NOD.Cg-Prkdcscid Il2rgtm1Wjl Tg(CMV-IL3,CSF2,KITLG)1Eav/MloySzJ (NSGS) | The Jackson Laboratory | Stock #013062 |
| Mouse: B6.FVB-Tg(EIIa-cre)C5379Lmgd/J (E2a-Cre) | The Jackson Laboratory | Stock No: 003724 |
| Mouse: B6;129S-Tet2tm1.1Iaai/J (Tet2 floxed) | The Jackson Laboratory | Stock No. 017573 |
| Oligonucleotides | ||
| shRNA targeting sequence: mTet2: ATAGGACTATAATGTATAGATA | Moran-Crusio et al., 2011 | N/A |
| shRNA targeting sequence: Renilla luciferase: CAGGAATTATAATGCTTATCTA | Dow et al., 2014 | N/A |
| shRNA targeting sequence: mTet3: CCCGGATTGAGAAGGTCATCTA | This paper | N/A |
| Genotyping primer: Rosa-M2rtTA mutant GCGAAGAGTTTGTCCTCAACC | Hochedlinger et al., 2005 | N/A |
| Genotyping primer: Rosa26 common AAAGTCGCTCTGAGTTGTTAT | Hochedlinger et al., 2005 | N/A |
| Genotyping primer: Rosa26 wild-type GGA GCGGGA GAA ATG GAT ATG | Hochedlinger et al., 2005 | N/A |
| Genotyping primer: Vav-tTA Forward: CCATACTCACTTTTGCCCTTTAG | Kim et al., 2007 | N/A |
| Genotyping primer: Vav-tTA Reverse: CAGCGCGCTGAGTGCATATAATGCA | Kim et al., 2007 | N/A |
| Genotyping primer: SADPA Reverse: ATCAAGGAAACCCTGGACTACTGCG | Premsrirut et al., 2011 | N/A |
| Genotyping primer: COLA1 Forward: AATCATCCCAGGTGCACAGCATTGCGG | Premsrirut et al., 2011 | N/A |
| Genotyping primer: COLA1 Reverse: CTTTGAGGGCTCATGAACCTCCCAGG | Premsrirut et al., 2011 | N/A |
| Genotyping primer: COLTGM Reverse: GAAAGAACAATCAAGGGTCC | Premsrirut et al., 2011 | N/A |
| Genotyping primer: TRE-shRen Forward: TAGATAAGCATTATAATTCCTATGCC | This paper | N/A |
| Genotyping primer: TRE-shTet2 Forward TATCTATACATTATAGTCCTAC | This paper | N/A |
| Genotyping primer: TRE-shTet3 Forward: TAGATGACCTTCTCAATCCGGATGCC | This paper | N/A |
| qRT-PCR Primer: mTet2 Forward: AGAGCCTCAAGCAACCAAAA | This paper | N/A |
| qRT-PCR Primer: mTet2 Reverse: ACATCCCTGAGAGCTCTTGC | This paper | N/A |
| qRT-PCR Primer: mTet1 Forward: AGCTGGATTGAAGGAACAGG | This paper | N/A |
| qRT-PCR Primer: mTet1 Reverse: GTCTCCATGAGCTCCCTGAC | This paper | N/A |
| qRT-PCR Primer: mTet3 Forward: AGAGCCTCAAGCA | This paper | N/A |
| qRT-PCR Primer: mTet3 Reverse | This paper | N/A |
| qRT-PCR Primer: mHprt Forward: CAGTACAGCCCCAAAATGGT | This paper | N/A |
| qRT-PCR Primer: mHprt Reverse: CAAGGGCATATCCAACAACA | This paper | N/A |
| qRT-PCR Primer: hTET2 Forward: CAGCACATTGGTATGCACTC | This paper | N/A |
| qRT-PCR Primer: hTET2 Reverse: TTTCCTTTGTCGGCAAGTCT | This paper | N/A |
| qRT-PCR Primer: hTET1 Forward: CAGCTGTCTTGATCGAGTTA | This paper | N/A |
| qRT-PCR Primer: hTET1 Reverse: AATTGGACACCCATGAGAGC | This paper | N/A |
| qRT-PCR Primer: hTET3 Forward: CGATTGCGTCGAACAAATAG | This paper | N/A |
| qRT-PCR Primer: hTET3Reverse: CTCCTTCCCCGTGTAGATGA | This paper | N/A |
| qRT-PCR Primer: hGAPDH Forward: CTCCTCCTGTTCGACAGTCAGC | This paper | N/A |
| qRT-PCR Primer: hGAPDH Reverse: CCATGGAATTTGCCATGGGTGG | This paper | N/A |
| Recombinant DNA | ||
| Plasmid: AML-ETO9a-IRES-mCherry | This paper | N/A |
| Software and Algorithms | ||
| STAR | N/A | https://github.com/alexdobin/STAR |
| featureCounts | N/A | http://subread.sourceforge.net/ |
| DESeq2 | N/A | https://bioconductor.org/packages/release/bioc/html/DESeq2.html |
| Trim Galore! | N/A | https://www.bioinformatics.babraham.ac.uk/projects/trim_galore/ |
| Bismark | N/A | https://www.bioinformatics.babraham.ac.uk/projects/bismark/ |
| Bowtie2 | N/A | http://bowtie-bio.sourceforge.net/bowtie2/ |
| methylKit | Akalin et al., 2012 | https://github.com/al2na/methylKit |
CONTACT FOR REAGENT AND RESOURCE SHARING
Further information and requests for resources and reagents should be directed to and will be fulfilled by the Lead Contact, Iannis Aifantis (Ioannis.aifantis@nyumc.org).
EXPERIMENTAL MODEL AND SUBJECT DETAILS
In vivo animal studies
TRE-TurboGFP-shTet2, and TRE-TurboGFP-shTet3 transgenic mice were generated by Mirimus by using previously described protocols (Premsrirut et al., 2011). Vav-tTA, Rosa-M2rtTA and TRE-GFP-Ren mice have been described previously (Dow et al., 2014; Hochedlinger et al., 2005; Kim et al., 2007). Doxycycline food (1g/kg) was administered to regulate shRNA expression in vivo. C57BL/6 (B6.SJL-Ptprca Pepcb/BoyJ (CD45.1) mice were purchased from Jackson Laboratory and bred in a mouse facility at NYU Medical Center. Germ-line Tet2-deficient mice have been described previously (Moran-Crusio et al., 2011). For bone marrow transplantation studies, sex-matched recipient mice of both sexes, aged 8–10 weeks, were transplanted with donor and support bone marrow cells isolated from mice aged 6–8 weeks.
Primary cell culture
Total bone marrow cells from Vav-tTA or Flt3ITD;Rosa-rtTA shRen/shTet2, Tet2+/+, Tet2+/− and Tet2−/− mice (6–8 weeks) or purified bone marrow cKit+ cells from Rosa-rtTA shRen/shTet2 mice transduced with AE9a-IRES-mCherry retrovirus were plated in methyl-cellulose medium (Methocult M3434 or M3534, Stem Cell Technologies). Cells were seeded at 20,000 total bone marrow cells or 2000 purified cKit+ cells per replicate. Colony forming units were enumerated using a Zeiss Axio Observer microscope and re-plated (2,000 cells/replicate) every 7–10 days. Primary mouse hematopoietic progenitor cells from Vav-tTA shTet2, Rosa-M2rtTA shRen/shTet2 mice in combination with Flt3ITD or AE9a were cultured in OpitMEM (GIBCO) with 10% FBS, 100 U/mL penicillin, 100 μg/ml streptomycin, 50 μM 2-mercaptoethanol and recombinant mouse SCF (50ng/ml), IL3 (10ng/ml) and IL6 (10ng/ml) at 37°C in 5% CO2. Doxycycline (Dox) was used at a final concentration of 1 μg/ml for all cell culture assays. For vitamin C treatment, L-ascorbic acid (L-AA) or ascorbate (ASC) was added directly to methylcellulose or liquid culture medium at a final concentration of 250 μM unless otherwise indicated. Catalase treatment was performed at a concentration of 1unit/ml of medium.
Cell lines
The human leukemia lines HL60, MOLM13, K562, KG1, THP1 and KASUMI1 were grown in RPMI (GIBCO). PlatinumE cells used for retroviral transfections were maintained in DMEM with 10%–20% FBS. Media were supplemented wtih 100 U/mL penicillin, 100 μg/ml streptomycin and cultures were incubated at 37°C, 5% CO2.
Patient samples
Diagnostic BM aspirates were obtained from AML patients treated at Memorial Sloan Kettering Cancer Center (MSKCC) or Princess Margaret Cancer Center (PMCC). All samples were collected after obtaining written informed consent. The use of human materials was approved by the Institutional Review Boards of MSKCC and Princess Margaret Cancer Center in accordance with the Helsinki Declaration.
Primary AML colony formation and liquid differentiation assays
Blasts (SSClow, CD45int, CD99high) and residual HSPC (SSClow, CD45int, CD34+, CD38-, CD99low) from primary AML specimens were double FACS–sorted to > 95% purity and seeded in methylcellulose (MethoCult H4435, Stem Cell Technologies). After 14 days, colonies were counted under an Olympus BX41 microscope. For liquid differentiation assays, sorted cells were plated at 1×10⁶/mL in Stem Span (Stem Cell Technologies) media, supplemented with human cytokines that support monocyte/macrophage differentiation: SCF (50 ng/mL), IL-3 (10 ng/mL), Fms-like tyrosine kinase-3–ligand (FLT3-L; 50 ng/mL), G-CSF (10 ng/mL) (Peprotech). After 7 days, immunophenotypic analysis was performed by flow cytometry for CD14 expression.
Xenotransplantation
Experiments were carried out in accordance with institutional guidelines approved by MSKCC. NSGS (6–10 weeks-old) mice were bred under pathogen-free conditions. For xenotransplantation, mice were sub-lethally irradiated (200–250 cGy) 3–24 hr before transplantation by direct intrafemoral injection. CD34+ cells purified by immunomagnetic selection from viably frozen patient bone marrow or peripheral blood mononuclear cells (Miltenyi Biotec) were used as the source of cells for xenografts. CBC analysis was performed on peripheral blood collected from submandibular bleeding using a Procyte Dx Hematology Analyzer (IDEXX Veterinary Diagnostics).
METHOD DETAILS
Immunohistochemistry and microscopy
Tissues were dissected from mice for fixation overnight in 10% formalin (Fisher). Fixed tissues were dehydrated and embedded in paraffin for sectioning. Paraffin sections (5 μm) were prepared and stained with hematoxylin and eosin (H&E) (Leica Autostainer XL). For immunohistochemistry, GFP or TurboGFP antibodies (ThermoFisher) were used and counterstained with hematoxylin. Fluorescence imaging and light microscopy were performed by using a Zeiss Axio Observer microscope.
Flow cytometry
Single cell suspensions were prepared from bone marrow, spleen or peripheral blood. Red blood cells were lysed with ammonium-chloride-potassium (ACK) buffer, and the remaining cells were resuspended in PBS with 3% FBS. Non-specific antibody binding was blocked by incubation with 20 μg/ml Rat IgG (Sigma-Aldrich) for 15 min, and cells were then incubated with primary antibodies for 30 min on ice. For 5hmC detection, cells were fixed at room temperature with 3% paraformaldehyde, permeabilized with 0.2% Triton X-100, denatured with 2N HCl, neutralized with 100 mM Tris-HCl, pH 8.0, and incubated with anti-5hmC (1:400) or isotype control antibodies for 30 min. Cells were then washed with PBS, incubated with secondary antibodies conjugated to AlexaFluor 594 (1:500) for 30 min, washed again and resuspended in PBS for flow cytometry. For detection of ROS activity, the cell permeable cloromethyl-2′,7′-dichlorofluorescin diacetate (CM-H2DCFDA) reagent was used (0.3 μM for Tet2-deficient cells or 1 μM for human AML cell lines). Upon oxidation, CM-H2DCFDA is converted to 2′, 7′-dichlorofluorescein (DCF), which is then detected by fluorescence spectroscopy (excitation/emission spectra of 495nm/529nm, respectively). Stained cells were quantified using a BD Fortessa analyzer or isolated with a MoFlo cell sorter (Beckman Coulter) or BD ARIA II. FlowJo software (TreeStar) was used to generate flow cytometry plots.
Bone marrow competitive transplantation
Freshly dissected femurs and tibiae were isolated from donor Vav-tTA, Tet2+/+ or Tet2−/− (CD45.2+), as well as Tet2+/+ (CD45.1+) mice. Bones were flushed with PBS using a 22.5 gauge needle, and the isolate was centrifuged (5 min, 0.5g, 4°C) and treated with red cell lysis buffer, as described above. Total nucleated bone marrow cells were re-suspended in PBS, passed through a 40 μM cell strainer and counted. Donor cells (0.5 × 10⁶ per genotype, per mouse) were mixed 1:1 with support bone marrow cells (CD 45.1+), and transplanted via retro-orbital injection into lethally irradiated (2 × 550 Rad) CD45.1+ recipient mice. Chimerism was monitored by flow cytometry (anti-CD45.1 and anti-CD45.2, BD Bioscience) of peripheral blood at 4-week intervals post-transplant for 20 weeks, at which time mice were sacrificed and chimerism was assessed in other hematopoietic compartments (bone marrow and spleen).
Retroviral transduction
Hematopoietic stem and progenitor cells were isolated by sorting Lin–cKit+Sca1+ cells, cultured in the presence of 50 ng/ml SCF, 50 ng/ml Flt3 ligand, 10 ng/ml IL-3, and 10 ng/ml IL-6, and infected with concentrated supernatants of AML-ETO9a-IRES-mCherry retrovirus after 24 and 48 hr. Transduction efficiency was determined by reporter fluorescence at 96 hr, and 2,000 sorted cKit+ cells were plated in methylcellulose media (M3434) for colony formation assays, as described above.
Cell viability and cell cycle
Apoptosis assays were performed by staining with Annexin V (BD PharMingen) according to the manufacturer’s instructions, in combination with DAPI. The CellTiter-Glo Luminescent Cell viability assay kit (Promega), which is based on luminescent quantification of ATP, was also used to assess relative viability of cell cultures. For cell cycle studies, cells were fixed in 4% paraformaldehyde, permeabilized in 0.2% saponin and stained with 2 μg/ml DAPI prior to flow cytometric analysis.
Quantitative RNA expression assays
Total RNA was extracted from cells using the RNeasy Plus Mini Kit (QIAGEN). RNA quantity and quality were determined by using an Agilent 2100 Bioanalyzer. RNA-seq libraries were prepared from total RNA by polyA selection using oligo-dT beads (Life Technologies), according to the manufacturer’s instructions. The resulting poly A+ RNA served as input for library construction using standard Illumina protocols. Sequencing was performed on an Illumina HiSeq 2500 sequencer using 50 bp single reads. For mRNA quantification, total RNA was used for cDNA synthesis using Superscript III first strand synthesis kit (Invitrogen). Real-time PCR reactions were carried out using SYBR Green Master Mix (Roche) and a Lightcycler 480 II (Roche).
RNA sequencing analysis
Sequencing results were demultiplexed and converted to FASTQ format by using Illumina bcl2fastq software. Sequencing reads were aligned to the human or mouse genomes, as appropriate (build hg19/GRCh37 and mm10/GRCm38, respectively), by using the splice-aware STAR aligner [https://www.ncbi.nlm.nih.gov/pubmed/23104886]. The featureCounts program [https://www.ncbi.nlm.nih.gov/pubmed/24227677] was utilized to generate counts for each gene based on how many aligned reads overlapped its exons. For sequencing depth and alignment results summary see Tables S4 and S5. Counts were then normalized and used to test for differential expression by using negative binomial generalized linear models, as implemented by the DESeq2 R package [https://www.ncbi.nlm.nih.gov/pubmed/25516281].
Gene set enrichment analysis
Gene set enrichment analysis was performed using gene set as permutation type, 1,000 permutations and log2 ratio of classes, or with gene set and Signal2Noise as metrics for ranking genes. Gene sets used in this study were identified from the Molecular Signatures Database (MSigDB Curated v4.0). Gene pathways and functions were assessed using Ingenuity Pathway Analysis (QIAGEN Bioinformatics).
Global DNA methylation quantitation
DNA samples were isolated by proteinase K digestion and phenol/chloroform extraction. DNA was denatured, and 2-fold serial dilutions were spotted on a nitrocellulose membrane in an assembled Bio-Dot apparatus (Bio-Rad). The blotted membrane was washed, air-dried, baked for 2hrs, blocked with 5% TBS-T, and incubated with rabbit polyclonal anti-5hmC, anti-5fC, or anti-5caC antibodies or mouse monoclonal anti-5mC antibody (1:1000) and HRP-conjugated anti-rabbit or anti-mouse IgG secondary antibodies (1:3000). ELISAs for 5hmC and 5mC were performed using MethylFlash hydroxymethylated and methylated DNA quantification kits (colorimetric, Epigentek), according to the manufacturer’s instructions.
Bisulfite sequencing
Genomic DNA (gDNA) was isolated from mouse HSPCs and human AML cells grown in vitro. DNA methylation sequencing was performed and analyzed using reduced representation bisulphite sequencing (RRBS) methodology, as described previously (Gu et al., 2011). Oxidative bisulfite treatment was performed by using a TruMethyl-Seq Kit (CEGX) to generate oxRRBS libraries. The amplified libraries were sequenced on an Illumina HiSeq2500 with 50 bp single-end reads, following standard Illumina sequencing protocols. Primary and downstream data analyses, including calculation of differential methylation, were performed using Methylkit (Akalin et al., 2012).
Bisulfite sequencing analysis
Sequencing results were demultiplexed and converted to FASTQ format using Illumina bcl2fastq software. The sequencing reads were quality- and adaptor-trimmed using Trim Galore [https://www.bioinformatics.babraham.ac.uk/projects/trim_galore/] in RRBS mode. The trimmed reads were aligned to the human or mouse genomes (build hg19/GRCh37 and mm10/GRCm38, respectively), as appropriate, by using Bismark [https://www.ncbi.nlm.nih.gov/pubmed/21493656] with Bowtie 2 aligner [https://www.ncbi.nlm.nih.gov/pubmed/22388286]. Bismark also was used for methylation calls. Differential methylation analysis and annotation was performed with the methylKit R package [https://www.ncbi.nlm.nih.gov/pubmed/23034086]. For tiling windows analysis, the genome was divided into 500 bp windows, and methylation information was summarized for each tile. Regions with low coverage (below 50X) or very high coverage (above 99.9th percentile) were discarded (for sequencing depth and alignment results summary see Tables S6 and S7).
5-hydroxymethylcytosine DNA immunoprecipitation (5hmeDIP), sequencing and analysis
Genomic DNA (0.5 μg) isolated from HL60 human AML cells was sonicated using a Covaris sonicator followed by end-repair, A-tailing and adaptor ligation using standard Illumina protocols. Ten percent (10%) of the input volume was retained prior to immunoprecipitation with anti-5hmC antibodies (1 μg/ml, Active Motif) at 4°C overnight. Immunoprecipitated DNA was recovered on protein G magnetic beads (Invitrogen), and DNA was purified from input and immunoprecipitated samples using Ampure beads, after proteinase K digestion followed by PCR amplification of libraries.
Libraries were sequenced on an Illumina HiSeq 2500 sequencer. Sequencing results were demultiplexed and converted to FASTQ format by using Illumina bcl2fastq. Reads were aligned to the human genome (build hg19/GRCh37) with Bowtie 2 [https://www.ncbi.nlm.nih.gov/pubmed/22388286] using local alignment. Only confidently mapped reads (mapping quality > 30) were retained. Duplicate reads were discarded using Picard [http://broadinstitute.github.io/picard/]. MACS [https://www.ncbi.nlm.nih.gov/pubmed/18798982] was utilized to perform peak calling with a q-value cutoff of 0.05. The R Bioconductor package DiffBind [https://bioconductor.org/packages/release/bioc/html/DiffBind.html] was used for identifying sites that are differentially bound between sample groups. The differential analysis method was set to use the DESeq2 package for more conservative full library size normalization and to avoid the assumption that most of the sites are not differentially bound. Profile plots of enrichment at genomic intervals were generated using deepTools [https://www.ncbi.nlm.nih.gov/pubmed/24799436]. Sequencing depth and alignment results are summarized in Table S8.
QUANTIFICATION AND STATISTICAL ANALYSIS
All p values were calculated using unpaired two-tailed Student’s t test with Graphpad Prism software, unless otherwise described in the methods or figure legends. No specific randomization or blinding protocol was used for these analyses. Statistically significant differences are indicated with asterisks in figures with the accompanying p value in the legend. Error bars in figures indicate standard deviation (SD) or standard error of the mean (SEM) for the number of replicates, as indicated in the figure legend.
DATA SOFTWARE AND AVAILABILITY
The accession number for the raw and analyzed data of RNA-sequencing, Bisulfite-sequencing and 5-hydroxymethylcytosine DNA immunoprecipitation experiments performed in mouse cells and human cell lines reported in this paper is GEO: GSE97442.
Supplementary Material
Highlights.
Tet2 restoration reverses aberrant self-renewal of Tet2-deficient cells
Tet2 restoration promotes DNA demethylation, differentiation, and cell death
Vitamin C treatment mimics Tet2 restoration to block leukemia progression
Vitamin C treatment in leukemia cells enhances their sensitivity to PARP inhibition
Acknowledgments
We thank Dr. Mark. D. Minden from the Princess Margaret Cancer Center (Toronto, Canada) for providing primary AML patient samples. We would like to thank Mirimus Inc for expertise in generation and analysis of the ShTet2 animals. We also thank the NYU School of Medicine core facilities including High Performance Computing, Flow Cytometry the Genome Technology Center, Experimental Pathology and Microscopy. The New York University Langone Medical Center Experimental Pathology Research Laboratory (New York, NY, USA) and Microscopy Laboratory (New York, NY, USA) are supported by Cancer Center Support Grant P30 CA016887. This research was supported by the US NIH (RO1 CA216421, R01 CA194923, R01 CA169784, R01 CA133379, R01CA149655, 5R01CA173636, and R01 CA49132), the Leukemia & Lymphoma Society (TRP#6340-11 and LLS#6373-13), Feinberg Lymphoma Pilot Grant (to L.C.), The Chemotherapy Foundation, The V Foundation for Cancer Research, Alex’s Lemonade Stand Foundation for Childhood Cancer, St. Baldrick’s Cancer Research Foundation (to L.C. and I.A.), and the Howard Hughes Medical Institute (to I.A.). The work was also supported by the New York State Department of Health (CO030132).
Footnotes
AUTHOR CONTRIBUTIONS
L.C. designed, performed, and analyzed experiments and wrote the manuscript. I.D. performed bioinformatic analysis. Y.W. and R.S.B. assisted with in vitro experiments. A.Y. performed PDX experiments under the supervision of O.A.-W. G.H.M. performed primary leukemia colony formation assays under the supervision of C.Y.P. J.W. assisted with mouse injections, bleeding, and tissue harvest. V.N. and B.X. assisted with ELISA and RNA-seq. M.T.W. assisted with colony formation assays. M.M.-F. and I.G. assisted with in vitro cell culture and dot blot analysis. S.B. and D.N.-L. assisted with mouse colony maintenance. M.T.M. and M.E.F. assisted with 5hmeDIP experiments. M.G. assisted with methylation analysis. R.S.B. contributed to the direction of the study. M.X. performed and provided data of TET2 ChIP-seq. R.A.D. assisted in the generation of shTet2 mice. A.T. contributed to bioinformatic analyses. B.G.N. and I.A. contributed to the design and interpretation of experiments, project management, and manuscript writing.
Supplemental Information includes seven figures and eight tables and can be found with this article online at http://dx.doi.org/10.1016/j.cell.2017.07.032.
An audio PaperClip is available at http://dx.doi.org/10.1016/j.cell.2017.07.032#mmc2.
References
- Abdel-Wahab O, Mullally A, Hedvat C, Garcia-Manero G, Patel J, Wadleigh M, Malinge S, Yao J, Kilpivaara O, Bhat R, et al. Genetic characterization of TET1, TET2, and TET3 alterations in myeloid malignancies. Blood. 2009;114:144–147. doi: 10.1182/blood-2009-03-210039. [DOI] [PMC free article] [PubMed] [Google Scholar]
- Akalin A, Kormaksson M, Li S, Garrett-Bakelman FE, Figueroa ME, Melnick A, Mason CE. methylKit: a comprehensive R package for the analysis of genome-wide DNA methylation profiles. Genome Biol. 2012;13:R87. doi: 10.1186/gb-2012-13-10-r87. [DOI] [PMC free article] [PubMed] [Google Scholar]
- An J, González-Avalos E, Chawla A, Jeong M, López-Moyado IF, Li W, Goodell MA, Chavez L, Ko M, Rao A. Acute loss of TET function results in aggressive myeloid cancer in mice. Nat Commun. 2015;6:10071. doi: 10.1038/ncomms10071. [DOI] [PMC free article] [PubMed] [Google Scholar]
- Barretina J, Caponigro G, Stransky N, Venkatesan K, Margolin AA, Kim S, Wilson CJ, Lehár J, Kryukov GV, Sonkin D, et al. The Cancer Cell Line Encyclopedia enables predictive modelling of anticancer drug sensitivity. Nature. 2012;483:603–607. doi: 10.1038/nature11003. [DOI] [PMC free article] [PubMed] [Google Scholar]
- Barreto G, Schäfer A, Marhold J, Stach D, Swaminathan SK, Handa V, Döderlein G, Maltry N, Wu W, Lyko F, Niehrs C. Gadd45a promotes epigenetic gene activation by repair-mediated DNA demethylation. Nature. 2007;445:671–675. doi: 10.1038/nature05515. [DOI] [PubMed] [Google Scholar]
- Bejar R, Lord A, Stevenson K, Bar-Natan M, Pérez-Ladaga A, Zaneveld J, Wang H, Caughey B, Stojanov P, Getz G, et al. TET2 mutations predict response to hypomethylating agents in myelodysplastic syndrome patients. Blood. 2014;124:2705–2712. doi: 10.1182/blood-2014-06-582809. [DOI] [PMC free article] [PubMed] [Google Scholar]
- Blaschke K, Ebata KT, Karimi MM, Zepeda-Martínez JA, Goyal P, Mahapatra S, Tam A, Laird DJ, Hirst M, Rao A, et al. Vitamin C induces Tet-dependent DNA demethylation and a blastocyst-like state in ES cells. Nature. 2013;500:222–226. doi: 10.1038/nature12362. [DOI] [PMC free article] [PubMed] [Google Scholar]
- Booth MJ, Ost TW, Beraldi D, Bell NM, Branco MR, Reik W, Balasubramanian S. Oxidative bisulfite sequencing of 5-methylcytosine and 5-hydroxymethylcytosine. Nat Protoc. 2013;8:1841–1851. doi: 10.1038/nprot.2013.115. [DOI] [PMC free article] [PubMed] [Google Scholar]
- Cadet J, Wagner JR. DNA base damage by reactive oxygen species, oxidizing agents, and UV radiation. Cold Spring Harb Perspect Biol. 2013:5. doi: 10.1101/cshperspect.a012559. http://dx.doi.org/10.1101/cshperspect.a012559. [DOI] [PMC free article] [PubMed]
- Cameron E, Pauling L, Leibovitz B. Ascorbic acid and cancer: a review. Cancer Res. 1979;39:663–681. [PubMed] [Google Scholar]
- Chen J, Guo L, Zhang L, Wu H, Yang J, Liu H, Wang X, Hu X, Gu T, Zhou Z, et al. Vitamin C modulates TET1 function during somatic cell reprogramming. Nat Genet. 2013;45:1504–1509. doi: 10.1038/ng.2807. [DOI] [PubMed] [Google Scholar]
- Chung TL, Brena RM, Kolle G, Grimmond SM, Berman BP, Laird PW, Pera MF, Wolvetang EJ. Vitamin C promotes widespread yet specific DNA demethylation of the epigenome in human embryonic stem cells. Stem Cells. 2010;28:1848–1855. doi: 10.1002/stem.493. [DOI] [PubMed] [Google Scholar]
- Ciccarone F, Klinger FG, Catizone A, Calabrese R, Zampieri M, Bacalini MG, De Felici M, Caiafa P. Poly(ADP-ribosyl)ation acts in the DNA demethylation of mouse primordial germ cells also with DNA damage-independent roles. PLoS ONE. 2012;7:e46927. doi: 10.1371/journal.pone.0046927. [DOI] [PMC free article] [PubMed] [Google Scholar]
- Delhommeau F, Dupont S, Della Valle V, James C, Trannoy S, Massé A, Kosmider O, Le Couedic JP, Robert F, Alberdi A, et al. Mutation in TET2 in myeloid cancers. N Engl J Med. 2009;360:2289–2301. doi: 10.1056/NEJMoa0810069. [DOI] [PubMed] [Google Scholar]
- Dow LE, Nasr Z, Saborowski M, Ebbesen SH, Manchado E, Tasdemir N, Lee T, Pelletier J, Lowe SW. Conditional reverse tet-trans-activator mouse strains for the efficient induction of TRE-regulated transgenes in mice. PLoS ONE. 2014;9:e95236. doi: 10.1371/journal.pone.0095236. [DOI] [PMC free article] [PubMed] [Google Scholar]
- Du J, Cullen JJ, Buettner GR. Ascorbic acid: chemistry, biology and the treatment of cancer. Biochim Biophys Acta. 2012;1826:443–457. doi: 10.1016/j.bbcan.2012.06.003. [DOI] [PMC free article] [PubMed] [Google Scholar]
- Esteban MA, Wang T, Qin B, Yang J, Qin D, Cai J, Li W, Weng Z, Chen J, Ni S, et al. Vitamin C enhances the generation of mouse and human induced pluripotent stem cells. Cell Stem Cell. 2010;6:71–79. doi: 10.1016/j.stem.2009.12.001. [DOI] [PubMed] [Google Scholar]
- Figueroa ME, Lugthart S, Li Y, Erpelinck-Verschueren C, Deng X, Christos PJ, Schifano E, Booth J, van Putten W, Skrabanek L, et al. DNA methylation signatures identify biologically distinct subtypes in acute myeloid leukemia. Cancer Cell. 2010;17:13–27. doi: 10.1016/j.ccr.2009.11.020. [DOI] [PMC free article] [PubMed] [Google Scholar]
- Fritz H, Flower G, Weeks L, Cooley K, Callachan M, McGowan J, Skidmore B, Kirchner L, Seely D. Intravenous vitamin C and cancer: a systematic review. Integr Cancer Ther. 2014;13:280–300. doi: 10.1177/1534735414534463. [DOI] [PubMed] [Google Scholar]
- Gu H, Smith ZD, Bock C, Boyle P, Gnirke A, Meissner A. Preparation of reduced representation bisulfite sequencing libraries for genome-scale DNA methylation profiling. Nat Protoc. 2011;6:468–481. doi: 10.1038/nprot.2010.190. [DOI] [PubMed] [Google Scholar]
- Guillamot M, Cimmino L, Aifantis I. The impact of DNA methylation in hematopoietic malignancies. Trends Cancer. 2016;2:70–83. doi: 10.1016/j.trecan.2015.12.006. [DOI] [PMC free article] [PubMed] [Google Scholar]
- Hochedlinger K, Yamada Y, Beard C, Jaenisch R. Ectopic expression of Oct-4 blocks progenitor-cell differentiation and causes dysplasia in epithelial tissues. Cell. 2005;121:465–477. doi: 10.1016/j.cell.2005.02.018. [DOI] [PubMed] [Google Scholar]
- Kallin EM, Rodríguez-Ubreva J, Christensen J, Cimmino L, Aifantis I, Helin K, Ballestar E, Graf T. Tet2 facilitates the derepression of myeloid target genes during CEBPα-induced transdifferentiation of pre-B cells. Mol Cell. 2012;48:266–276. doi: 10.1016/j.molcel.2012.08.007. [DOI] [PMC free article] [PubMed] [Google Scholar]
- Kawada H, Kaneko M, Sawanobori M, Uno T, Matsuzawa H, Nakamura Y, Matsushita H, Ando K. High concentrations of L-ascorbic acid specifically inhibit the growth of human leukemic cells via downregulation of HIF-1α transcription. PLoS ONE. 2013;8:e62717. doi: 10.1371/journal.pone.0062717. [DOI] [PMC free article] [PubMed] [Google Scholar]
- Kim WI, Wiesner SM, Largaespada DA. Vav promoter-tTA conditional transgene expression system for hematopoietic cells drives high level expression in developing B and T cells. Exp Hematol. 2007;35:1231–1239. doi: 10.1016/j.exphem.2007.04.012. [DOI] [PubMed] [Google Scholar]
- Kosmider O, Gelsi-Boyer V, Ciudad M, Racoeur C, Jooste V, Vey N, Quesnel B, Fenaux P, Bastie JN, Beyne-Rauzy O, et al. Groupe Franco-phone des Myélodysplasies. TET2 gene mutation is a frequent and adverse event in chronic myelomonocytic leukemia. Haematologica. 2009;94:1676–1681. doi: 10.3324/haematol.2009.011205. [DOI] [PMC free article] [PubMed] [Google Scholar]
- Liu M, Ohtani H, Zhou W, Ørskov AD, Charlet J, Zhang YW, Shen H, Baylin SB, Liang G, Grønbæk K, Jones PA. Vitamin C increases viral mimicry induced by 5-aza-2′-deoxycytidine. Proc Natl Acad Sci USA. 2016;113:10238–10244. doi: 10.1073/pnas.1612262113. [DOI] [PMC free article] [PubMed] [Google Scholar]
- Morales J, Li L, Fattah FJ, Dong Y, Bey EA, Patel M, Gao J, Boothman DA. Review of poly (ADP-ribose) polymerase (PARP) mechanisms of action and rationale for targeting in cancer and other diseases. Crit Rev Eukaryot Gene Expr. 2014;24:15–28. doi: 10.1615/critreveukaryotgeneexpr.2013006875. [DOI] [PMC free article] [PubMed] [Google Scholar]
- Moran-Crusio K, Reavie L, Shih A, Abdel-Wahab O, Ndiaye-Lobry D, Lobry C, Figueroa ME, Vasanthakumar A, Patel J, Zhao X, et al. Tet2 loss leads to increased hematopoietic stem cell self-renewal and myeloid transformation. Cancer Cell. 2011;20:11–24. doi: 10.1016/j.ccr.2011.06.001. [DOI] [PMC free article] [PubMed] [Google Scholar]
- Padayatty SJ, Levine M. Vitamin C: the known and the unknown and Goldilocks. Oral Dis. 2016;22:463–493. doi: 10.1111/odi.12446. [DOI] [PMC free article] [PubMed] [Google Scholar]
- Pan F, Wingo TS, Zhao Z, Gao R, Makishima H, Qu G, Lin L, Yu M, Ortega JR, Wang J, et al. Tet2 loss leads to hypermutagenicity in haematopoietic stem/progenitor cells. Nat Commun. 2017;8:15102. doi: 10.1038/ncomms15102. [DOI] [PMC free article] [PubMed] [Google Scholar]
- Papaemmanuil E, Gerstung M, Bullinger L, Gaidzik VI, Paschka P, Roberts ND, Potter NE, Heuser M, Thol F, Bolli N, et al. Genomic classification and prognosis in acute myeloid leukemia. N Engl J Med. 2016;374:2209–2221. doi: 10.1056/NEJMoa1516192. [DOI] [PMC free article] [PubMed] [Google Scholar]
- Pastor WA, Aravind L, Rao A. TETonic shift: biological roles of TET proteins in DNA demethylation and transcription. Nat Rev Mol Cell Biol. 2013;14:341–356. doi: 10.1038/nrm3589. [DOI] [PMC free article] [PubMed] [Google Scholar]
- Premsrirut PK, Dow LE, Kim SY, Camiolo M, Malone CD, Miething C, Scuoppo C, Zuber J, Dickins RA, Kogan SC, et al. A rapid and scalable system for studying gene function in mice using conditional RNA interference. Cell. 2011;145:145–158. doi: 10.1016/j.cell.2011.03.012. [DOI] [PMC free article] [PubMed] [Google Scholar]
- Quivoron C, Couronné L, Della Valle V, Lopez CK, Plo I, Wagner-Ballon O, Do Cruzeiro M, Delhommeau F, Arnulf B, Stern MH, et al. TET2 inactivation results in pleiotropic hematopoietic abnormalities in mouse and is a recurrent event during human lymphomagenesis. Cancer Cell. 2011;20:25–38. doi: 10.1016/j.ccr.2011.06.003. [DOI] [PubMed] [Google Scholar]
- Rasmussen KD, Helin K. Role of TET enzymes in DNA methylation, development, and cancer. Genes Dev. 2016;30:733–750. doi: 10.1101/gad.276568.115. [DOI] [PMC free article] [PubMed] [Google Scholar]
- Rasmussen KD, Jia G, Johansen JV, Pedersen MT, Rapin N, Bagger FO, Porse BT, Bernard OA, Christensen J, Helin K. Loss of TET2 in hematopoietic cells leads to DNA hypermethylation of active enhancers and induction of leukemogenesis. Genes Dev. 2015;29:910–922. doi: 10.1101/gad.260174.115. [DOI] [PMC free article] [PubMed] [Google Scholar]
- Shen L, Song CX, He C, Zhang Y. Mechanism and function of oxidative reversal of DNA and RNA methylation. Annu Rev Biochem. 2014;83:585–614. doi: 10.1146/annurev-biochem-060713-035513. [DOI] [PMC free article] [PubMed] [Google Scholar]
- Shih AH, Jiang Y, Meydan C, Shank K, Pandey S, Barreyro L, Antony-Debre I, Viale A, Socci N, Sun Y, et al. Mutational cooperativity linked to combinatorial epigenetic gain of function in acute myeloid leukemia. Cancer Cell. 2015;27:502–515. doi: 10.1016/j.ccell.2015.03.009. [DOI] [PMC free article] [PubMed] [Google Scholar]
- Sperling AS, Gibson CJ, Ebert BL. The genetics of myelodys-plastic syndrome: from clonal haematopoiesis to secondary leukaemia. Nat Rev Cancer. 2017;17:5–19. doi: 10.1038/nrc.2016.112. [DOI] [PMC free article] [PubMed] [Google Scholar]
- Wiehle L, Raddatz G, Musch T, Dawlaty MM, Jaenisch R, Lyko F, Breiling A. Tet1 and Tet2 protect DNA methylation canyons against hypermethylation. Mol Cell Biol. 2015;36:452–461. doi: 10.1128/MCB.00587-15. [DOI] [PMC free article] [PubMed] [Google Scholar]
- Wilson A, Laurenti E, Oser G, van der Wath RC, Blanco-Bose W, Jaworski M, Offner S, Dunant CF, Eshkind L, Bockamp E, et al. Hematopoietic stem cells reversibly switch from dormancy to self-renewal during homeostasis and repair. Cell. 2008;135:1118–1129. doi: 10.1016/j.cell.2008.10.048. [DOI] [PubMed] [Google Scholar]
- Yin R, Mao SQ, Zhao B, Chong Z, Yang Y, Zhao C, Zhang D, Huang H, Gao J, Li Z, et al. Ascorbic acid enhances Tet-mediated 5-methylcytosine oxidation and promotes DNA demethylation in mammals. J Am Chem Soc. 2013;135:10396–10403. doi: 10.1021/ja4028346. [DOI] [PubMed] [Google Scholar]
- Young JI, Züchner S, Wang G. Regulation of the epigenome by vitamin C. Annu Rev Nutr. 2015;35:545–564. doi: 10.1146/annurev-nutr-071714-034228. [DOI] [PMC free article] [PubMed] [Google Scholar]
- Yun J, Mullarky E, Lu C, Bosch KN, Kavalier A, Rivera K, Roper J, Chio II, Giannopoulou EG, Rago C, et al. Vitamin C selectively kills KRAS and BRAF mutant colorectal cancer cells by targeting GAPDH. Science. 2015;350:1391–1396. doi: 10.1126/science.aaa5004. [DOI] [PMC free article] [PubMed] [Google Scholar]
- Zeidan AM, Kharfan-Dabaja MA, Komrokji RS. Beyond hypomethylating agents failure in patients with myelodysplastic syndromes. Curr Opin Hematol. 2014;21:123–130. doi: 10.1097/MOH.0000000000000016. [DOI] [PMC free article] [PubMed] [Google Scholar]
Associated Data
This section collects any data citations, data availability statements, or supplementary materials included in this article.