

The strength of photon localization in the band-tail states is determined by the degree of disorder and state energy.
Abstract
Anderson localization in random structures is an intriguing physical phenomenon, for which experimental verifications are far behind theoretical predictions. We report the first experimental confirmations of photonic band-tail states and a complete transition of Anderson localization. An optically activated photonic crystal alloy platform enables the acquisition of extensive experimental data exclusively on pure eigenstates, revealing direct evidence of band-tail states and Anderson localization transition within the band-tail states. Analyses of both experimental and simulated data lead to a comprehensive picture of photon localization that is highly consistent with theories by Anderson and others. We believe that our results provide a strong experimental foundation upon which both the fundamental understandings and application possibility of Anderson localization can be promoted significantly.
INTRODUCTION
It has been nearly 60 years since Anderson published the theory of electron localization in disordered lattice structures (1), which is now referred to as Anderson localization. Anderson suggested that random potential fluctuations superimposed in a periodic lattice structure can produce a wide variety of electronic eigenstates that span from diffusive (thus, extended) to localized states. Numerous theoretical studies to understand and predict the physics of the phenomenon have followed; the studies of Abou-Chacra et al. (2), Abrahams et al. (3), Thouless (4), Lee and Ramakrishnan (5), John et al. (6, 7), and Mieghem (8) are only a selection of the most notable ones. Contrarily, experiments began only after it was found that localization could also occur in classical waves (9), such as electromagnetic waves (photons) (10–23) or acoustic waves (24, 25) [later, this phenomenon was also confirmed in quantum waves (26, 27)]. Previous experimental evidence regarding photon localization is, however, predominantly based on macroscopic and collective data, such as backscattering (10–12) or transmission (13, 14); sometimes, their proofs can be indirect and therefore contested. Furthermore, most of these works used lattice-disordered platforms, probably influenced by the thermally excited disorder in solid-state systems; this kind of disorder, however, quickly destroys the crystalline symmetry, resulting in systems very different from Anderson’s original model.
A notable experimental breakthrough was made by Schwartz et al. (17); they succeeded in visualizing the localized photon modes in a perturbed periodic potential by exploiting the effectively enlarged structural dimension in transverse directions, albeit permitting the photon propagation in longitudinal direction. They also refreshed the importance of crystalline symmetry in Anderson localization, leading to successive research on disorder-enhanced photon transport (21–23). As a research platform for another experimental milestone, we propose a two-dimensional (2D) photonic crystal (PhC) alloy system that enables complete photon trapping. By realizing such Anderson-type disordered structures in an optically active medium and tracing the spectral evolution of resultant lasing modes, we clarify that the eigenstates of the system are photonic band-tail states, which are speculated to be intimately related to strong photon localizations (7). In addition, direct visualization of the wavelength-scale modal profiles, using a scanning near-field optical microscopy (SNOM) technique (28, 29), reveals that the band-tail states are Anderson-localized, with their localization strengths monotonically dependent on the degree of disorder as well as the state energy. Our results demonstrate that photon localization can be manipulated over a wide spectro-spatial range in a controlled and predictable manner, which should stimulate further studies to understand and use the light-matter interactions via Anderson-localized modes (30, 31).
RESULTS AND DISCUSSION
PhC alloy system
The device system studied here consists of a set of 2D PhC alloys, where each device is fabricated by perforating an InAsP/InP multiple quantum well (MQW) slab waveguide bonded on a fused quartz substrate with a hexagonal lattice array of air holes [see Materials and Methods for details and section S1 for scanning electron microscopy (SEM) images]. To comply with the philosophy of the original Anderson model, in which disorder is introduced only through potential fluctuations, we adopt the compositional disorder (32) that preserves the crystalline symmetry regardless of disorder strength (see section S2). The compositional disorder, which mimics that of compound semiconductor alloys, implies a random distribution of multiple (quaternary in this study) kinds of basis atoms at regular lattice sites, where the compositional ratios among the multiple basis atoms remain the same throughout the structure (Fig. 1A). We quantify the disorder strength using the scheme of Conti et al. (33): The radius of each basis atom is given by r = r0(1 + γξ), where γ (≥0) is the parameter that controls the degree of disorder and ξ is a deviation that uniformly varies within the range of −1/2 ≤ ξ ≤ 1/2. Because we design our PhC alloys to be quaternary, we fix ξ at four equally spaced values: −1/2, −1/6, +1/6, and +1/2. r0 is the air-hole radius of the reference PhC composed of homogeneous air holes (γ = 0). Figure 1B is a photonic band structure calculated for the reference PhC, where two band-edges (BEs) [K1 and M2, at both ends of the band-gap (BG)] are denoted. Figure 1C schematically shows the photonic density of states as a function of photon energy. In an analogy to band-tail states in electronic disordered systems (such as semiconductor alloys) (6, 8, 34, 35), we speculate that photonic band-tail states develop inside the photonic BG upon the introduction of disorder, which was theoretically predicted earlier by John (7).
Fig. 1. Compositionally disordered PhCs.
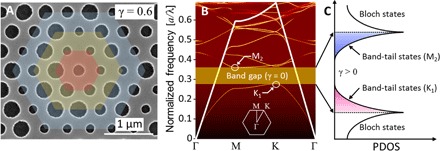
(A) SEM image of a fabricated PhC alloy device. The device is composed of four kinds of photonic atoms with different air-hole sizes, distributed randomly at otherwise regular hexagonal lattice sites. Multiple hexagons are intentionally overlapped with the SEM image to illustrate that the hexagonal symmetry is strictly preserved. (B) Calculated photonic band structure of the reference PhC composed of homogenous air holes in a slab waveguide, arranged in the hexagonal lattice: r0 = 0.30a and h = 0.51a, where a = 450 nm is the lattice constant and h is the MQW slab thickness. (C) Schematic of photonic density of states (PDOS) versus photon energy with an illustration of band-tail states expected as a consequence of disorder.
Laser spectra and band-tail states
We first measured microphotoluminescence (μPL) spectra from the fabricated PhC alloy devices in the far-field regime (see Materials and Methods for details). Some representative emission spectra are shown in Fig. 2A. Note that every sharp peak in the μPL spectra is an individual lasing mode (see section S3) and therefore corresponds to an eigenstate of the system. When the system is ordered (γ = 0), the spectrum is dominated by a single lasing mode, which we identify as the K1 BE mode (for reasons that will be explained later). For intermediate disorders (0.2 ~ γ ~ 0.6), lasing actions occur at multiple closely spaced modes; the spectral width over which multiple lasing peaks appear becomes broadened as the degree of disorder increases. At high disorders (0.6 ~ γ ~ 0.8), another set of lasing peaks develops from the short-wavelength side. For theoretical confirmation, we performed finite-difference time-domain (FDTD) simulations (see Materials and Methods for details). Figure 2B shows simulation results that not only are consistent with the experimental spectra but also predict that the two groups of lasing modes eventually merge at high disorders.
Fig. 2. Band-tail states in lasing spectra.
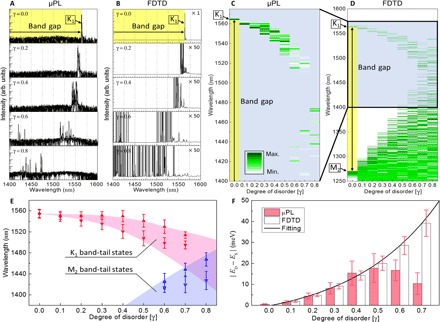
(A) Measured μPL spectra from the PhC alloy devices with different degrees of disorder (γ = 0.0, 0.2, 0.4, 0.6, and 0.8). Each spectrum is constructed by overlapping at least five individual spectra taken from different locations on the same device. The excitation power density was 6.2 kW/cm2 throughout the measurements. Each peak in the spectra corresponds to an individual laser line with a well-defined threshold. (B) Simulated |E|2 spectra for the model structures that correspond to those shown in (A). (C and D) Measured (C) and simulated (D) spectra, plotted as a function of the degree of disorder. Note that simulations are performed over an extended spectral range that includes the M2 BE as well. (E) Statistical summary of all the band-tail states identified from μPL measurements. For each degree of disorder, the average (▲,▼) and SD (I) are determined from an ensemble of 10 PhC alloy devices with different disorder configurations. The shaded areas are from simulations. (F) Energy range occupied by the K1 band-tail states, presented as a function of the degree of disorder. Results from μPL measurements and FDTD simulations are presented as red bars and white bars, respectively. The solid line is an exponential fitting to the simulation result.
Panels C and D are replots of panels A and B of Fig. 2, but are shown as direct functions of the degree of disorder to elucidate the evolution of lasing modes with respect to the BG. The photonic BG is found to gradually narrow and eventually vanish as the degree of disorder increases. We claim that this is the first experimental observation that disorder-induced eigenstates (or band-tail states) fill the photonic BG, as implied in theories by John (7). These observations also indicate that the groups of lasing modes at long- and short-wavelength sides originate from the two BEs, K1 and M2, respectively. This argument is also supported by modal profiles in momentum space (see section S4).
To ensure generality, we apply statistical treatments to the measured results by taking an ensemble average over different PhC alloy configurations. In this way, we can exclude (or minimize) the effect of specificity in disorder configurations. Figure 2E presents both the averaged spectral positions of the upper (upward-pointing triangles) and lower (downward-pointing triangles) bounds (in terms of wavelength) of scattered lasing modes, as functions of the degree of disorder, along with the ranges of band-tail states estimated by simulations (areas shaded in color). The width of the K1 band-tail states gradually increases as γ increases, which is followed by the situation in which the K1 and M2 band-tail states merge and their discrimination becomes difficult (γ ≥ 0.7). The overall trend is similar to that of electronic disordered systems (8). We note that, unlike in the simulation results, the experimentally determined width of the K1 band-tail states increases only to γ = 0.5 and then decreases thereafter. However, this discrepancy is simply caused by the reduction in optical gain overlap, not any intrinsic change in the properties of the band-tail states (see section S5); that is, not all band-tail states are subject to lasing.
Figure 2F (as a function of γ) shows the width of the energy range over which the K1 band-tail states spread, which is defined by the energy difference between the deepest and the shallowest band-tail states, |ED – ES|. The penetration depth of the K1 band-tail states is super-linearly proportional to γ. This phenomenon is similar to an Urbach tail, which often appears in the absorption edge of disordered solids (36). We note that the disorder-induced localized states were found to be largely responsible for the Urbach tail (6). The similarity between electronics and photonics encourages us to examine the mode profiles of the band-tail states in our system with the expectation that they are spatially localized eigenstates.
Eigenmode profiles measured by near-field optical microscopy
Figure 3A shows several representative near-field images measured for the K1 band-tail states (see Materials and Methods for details, section S6 for the M2 band-tail states, and section S7 for the excitation power density dependence). For a given value of γ, the shallowest band-tail state should be nearly identical to the BE itself (see section S8). The images are taken from a single set of devices such that their disorder configurations are identical; these are the devices for which μPL spectra are presented in Fig. 2A. Therefore, one can make direct comparisons not only among the SNOM images for different γ values but also between emission spectra and mode images. When γ = 0, for which only a single K1 BE mode exists (see Fig. 2A), the SNOM image exhibits a periodic 2D Bloch mode profile throughout the entire excitation region; the minor intensity variations are due to structural inhomogeneity inevitably introduced during device fabrication. In the presence of disorder, however, the observed near-field profiles are drastically changed. Whereas the shallowest band-tail states are commonly characterized by a fairly large mode profile composed of multiple loosely connected segments, the deepest band-tail states exhibit a spatially isolated single-enveloped mode pattern. The localized mode shrinks in size as γ increases; the mode is as small as approximately 1 μm (only a small number of PhC lattices) for γ = 0.6. Again, the FDTD simulation method is used for comparison, and the results shown in Fig. 3B agree very well with the SNOM images. In particular, note that even the physical locations of localized spots are correctly reproduced by the simulations.
Fig. 3. Mode patterns of the K1 band-tail states.
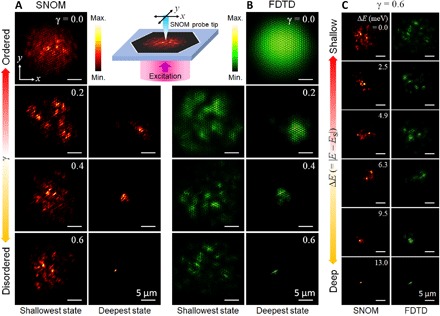
(A) Representative SNOM images taken from devices with different degrees of disorder: γ = 0.0, 0.2, 0.4, and 0.6. For each degree of disorder, near-field images for the shallowest and deepest K1 band-tail states are shown in the left and right columns, respectively. All the SNOM images were taken at a fixed excitation power density (~7 kW/cm2) well above laser thresholds of the modes. (B) Simulated |E|2 mode patterns for the band-tail states that correspond to those shown in (A). (C) Measured (SNOM) and simulated (FDTD) images of various K1 band-tail states for a fixed degree of disorder (γ = 0.6) but at different band-tail state energies. The images are arranged in the order of state energy (from the shallowest at the top to the deepest at the bottom): ΔE ≡ E – ES = 0.0, 2.5, 4.9, 6.3, 9.5, and 13.0 meV. The inset is a schematic SNOM measurement configuration.
The modal patterns observed using SNOM (and confirmed by FDTD) are consistent with the theories by Anderson (1) and John (7), which explain the localization phenomenon via the hopping probability. According to the theory, the introduction of random potential fluctuations breaks up a homogeneous Bloch mode because of the loss of long-range phase coherence, resulting in a mixture of multiple split field domains represented by an envelope function. When the state energy is shallow, as compared to potential fluctuations, the amplitude of the envelope function between domains is finite, allowing photons to transfer by hopping between domains spread over the entire structure, which is called weak localization. We believe that this is what we observed from the shallowest band-tail states. For a deep state, however, the envelope function decays completely, far before it reaches other domains. This situation results in a completely isolated envelope function and thus no hopping probability between domains, leading to a state called strong localization. The near-field images from the deepest band-tail states strongly support this conceptual picture. Our observations also indicate that the strong and weak localized states can coexist in the same disordered structure, which was also theoretically predicted (5).
To better understand modal evolutions, we compare the SNOM images (and the corresponding FDTD simulation results) of the K1 band-tail states of various intermediate (between the shallowest and the deepest) energy levels from a single device with the degree of disorder γ = 0.6 (Fig. 3C). Results show that the mode size monotonically shrinks, which indicates that the eigenstate gradually changes its character from a weaker to stronger localization, as the band-tail state becomes deeper. Therefore, eigenstates of the intermediate energy levels are neither fully extended nor fully localized, but are instead in gradual transition, qualitatively consistent with the discussion by Edwards and Thouless (37).
Effective widths and the Ioffe-Regel criterion
The physical length scale over which a localized mode extends is a direct measure to quantify the strength of localization. From measured near-field images, we can extract the effective width for a band-tail state, which is defined by for a 2D system, where P is the participation ratio (17, 38). Results obtained from all of the measured SNOM images are summarized in Fig. 4A. The effective width is dependent on both the degree of disorder and the depth of the band-tail state; that is, as γ increases and the band-tail state becomes deeper, the effective width tends to be smaller, and thus, the corresponding mode becomes more localized. FDTD simulations not only confirm the experimental results with excellent agreement but also reveal that the M2 band-tail states exhibit a similar behavior (Fig. 4B).
Fig. 4. Spatial extents of band-tail states.
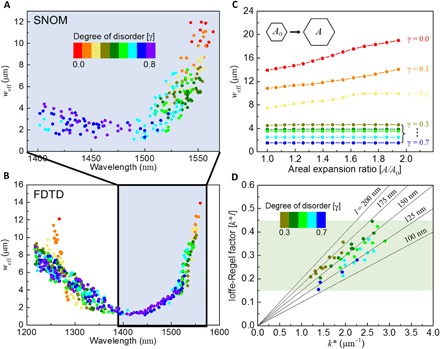
(A) Effective spatial widths of band-tail states, deduced from SNOM images for various degrees of disorder, band-tail state energies, and disorder configurations. (B) Simulated effective widths of various band-tail states. Simulations were performed over an extended spectral range to include the M2 band-tail states. (C) Effective width versus PhC pattern size, simulated for various degrees of disorder (0.0 ≤ γ ≤ 0.7). Throughout simulations, the disorder configuration is fixed so as to exclude configuration-specific fluctuations. (D) Modified Ioffe-Regel factors (k*l) estimated for the deepest band-tail states of γ ≥ 0.3. The results are plotted as a function of the envelope wave number k* such that the slope directly reflects the mean free path l.
Intuitively, increasing the area of the PhC pattern will result in the expansion of the BE mode. However, such a simple size effect cannot occur in a strongly localized mode because the mode is already confined within a local spot and, thus, is insensitive to the PhC pattern boundaries. Figure 4C, which is obtained using FDTD simulations, shows how the effective widths of the deepest band-tail states change as the PhC pattern size increases. When we enlarge the PhC domain size (from A0 to A) by appending additional photonic atoms around the initial PhC domain, the effective width for low disorder (0 ≤ γ ≤ 0.2) monotonically increases, starting from a relatively large value (>6 μm). However, the situation for higher disorder (γ ≥ 0.3) is very different: The effective width is independent of the PhC domain size. These results imply that the PhC pattern boundaries may or may not influence the formation of localized modes (39). Therefore, one should carefully discriminate the disorder-induced “true” localizations from the boundary-affected “false” ones when making claims about Anderson localization. In our PhC alloy system, at least the deepest band-tail states of γ ≥ 0.3 are candidates for Anderson localization.
Finally, we evaluated our devices in terms of the Ioffe-Regel factor, kl, where k is the wave number and l is the mean free path. It is a theoretical notion that when the relative scales of λ (=2π/k) and l become comparable, wave interference modifies transport properties drastically and a transition from extended to localized modes takes place (40, 41). By analyzing the SNOM images of the deepest band-tail states (only for γ ≥ 0.3 as explained in the previous paragraph; see section S9), we obtained 1.2 < kl < 2.0, which is close to the Ioffe-Regel condition (kl ≈ 1). However, it was pointed out that the criterion should be modified for a periodic arrangement of coherent scatterers to k*l ≈ 1, where k* ≡ |k – kBE| is the wave number of the envelope wave function (41). We summarize the results in Fig. 4D, where the deepest band-tail states are indicated in the (k*, k*l) plane. The modified Ioffe-Regel factors now become 0.15 < k*l < 0.45 (shaded area in Fig. 4D), well below 1, and therefore, the Ioffe-Regel condition is fully satisfied. The corresponding mean free path is l ≈ 150 nm, which is only a fraction of the lattice constant a = 450 nm. This result explains why localized photon states are readily available in our devices, confirming that our PhC alloy system is an ideal platform on which to study the phenomenon of Anderson localization.
CONCLUSION
Our 2D PhC alloy system constructed in an MQW slab waveguide not only conforms to Anderson’s original model structure but also has several unique advantageous features: precision controllability of the degree of disorder and direct imaging capability for the internal mode profiles. Furthermore, the optically active nature of the system, achieved by constructing the crystal symmetry–preserving disordered structure in an MQW slab waveguide, enables us to exclusively manipulate lasing modes over a wide range of disorder, from weakly to strongly disordered regimes. We have visualized localized modes in real scales and established a comprehensive picture of the localization transition in the band-tail states.
The evolution of localized modes in our system is highly reproducible and can be tailor-designed, which we have proved to be inherent to the band-tail states distributed over wide spectral (across the entire BG) and spatial (from only two to three lattices to the entire structure) ranges. Furthermore, all these observations are made from lasing modes, indicating that the localized eigenstates in our platform constitute well-trapped photon modes with high-quality factors, which makes them attractive for not only the fundamental research but also photonic device technology. We believe that these results can accelerate our understandings on disorder physics and also shed light on sophisticated next-generation photonic devices in the areas where localized states can be engineered to multiplex their spectral and spatial degrees of freedom for enhanced device performance and new functionalities, such as biosensing, photovoltaics, optical data storage, and cavity quantum electrodynamics.
MATERIALS AND METHODS
Device fabrication
An InP-based MQW epilayer structure was grown on an InP substrate using molecular beam epitaxy, with a center emission wavelength at approximately 1530 nm. The MQW section consists of four InAsP MQWs separated by InP barriers, totaling 230 nm in nominal thickness, which corresponds to ~λ/2n, where n is the effective refractive index of the slab waveguide. Grown underneath the MQW section was an InGaAs etch-stop layer for selective chemical etching. The grown wafer was flip-bonded onto a fused silica substrate using a wafer fusion technique (42), resulting in an InAsP/InP MQW layer that is directly in contact with the silica substrate. The InP substrate and InGaAs etch-stop layer were then selectively removed in dilute HCl and FeCl3 solutions, respectively. A 50-nm-thick silicon nitride hard mask layer was deposited on the exposed surface of the MQW epilayer using the plasma-enhanced chemical vapor deposition method (310PC, Surface Technology Systems) at a process temperature of 200°C. Electron-beam lithography (JBX-6300FS, JEOL) was then used to generate 2D PhC patterns, which was followed by reactive ion etching (RIE 80 Plus, Oxford Instrument) to sequentially transfer the PhC patterns onto the silicon nitride hard mask layer and the MQW layer. Finally, the hard mask layer was removed using the RIE to complete device fabrication.
μPL spectra
μPL measurements were performed using a homemade fiber-based setup (43), in which a cleaved butt-end fiber tip with a 62.5-μm core diameter is connected to a 1 × 2 multiplexing multimode fiber coupler. The pump beam from a 1064-nm pulsed laser diode (PSL10, Multiwave Photonics), operating at a 500-kHz repetition rate with a 20-ns pulse duration, was coupled to the input port of the coupler. The cleaved fiber tip was brought in close proximity to the desired location on the PhC sample surface. Scattered light output emitted from the PhC was then detected via the same fiber tip and delivered to the output port of the coupler, which was, in turn, fed to an optical spectrum analyzer (Q8381A, Advantest) for spectral analysis.
FDTD simulation
Numerical simulations based on the FDTD method were performed with a commercial FDTD software package (FDTD solutions, Lumerical Solutions). For each model structure, the simulation domain size was 32 μm × 28 μm, including the padding. The spatial resolution was set to 45 pixels/μm, which is sufficiently high that we can distinguish individual modes. We used the so-called 2.5D FDTD method where a 3D structure is collapsed into a set of effective 2D materials, with effective refractive indices determined from the in-plane wave vector component. This method is known to offer 3D accuracy using only 2D computing resources, although it is applicable for a specific simulation bandwidth (44). In our simulations, the effective index of neff = 2.7 was used for our PhC waveguide slab. The model PhC structures used in the simulations are nominally identical to the real devices examined experimentally, because the same CAD files were shared by both electron-beam lithography and FDTD simulations.
To mimic real experimental conditions and to excite as many resonant modes existing in the model structure as possible, we applied the dipole cloud approach, in which many dipoles with random positions, polarizations, and phases are incorporated within a virtual pump spot. Likewise, we placed many randomly positioned time monitors over the entire PhC slab such that all of the resonant modes can be identified from the resultant spectrum. In the analysis step immediately before the Fourier transformation to extract the modal spectra, we applied the apodization of time signals with a Gaussian profile to eliminate the start and end effects. For the simulated |E|2 distribution of each resonant mode, the same approach was taken, except that time monitors were replaced with 2D frequency-domain field monitors.
Near-field imaging
To directly obtain the modal pattern for an individual lasing mode, we custom-designed and built a SNOM apparatus operating in the near-infrared range (28). The scanning part of the apparatus was built by integrating a scanning controller system (SMENA, NT-MDT) with an inverted optical microscope (Eclipse Ti-S, Nikon). The detecting part was assembled from a monochromator (MicroHR, Horiba), an InGaAs photodiode (DSS-IGA025T, Horiba), and a lock-in amplifier (SR830, Stanford Research Systems).
The SNOM apparatus was operated in a collection geometry in which a laser diode, which is identical to that used for the μPL measurements (except for an additional 1-kHz modulation to provide a reference signal to the lock-in amplifier), delivered a pump beam from the back side of the sample (through the transparent silica substrate). The near-field signal from the sample was recorded by the SNOM probe while the probe tip scanned the front surface of the sample. We used the scanning-by-probe scheme, in which only the probe mounted in the scan head moves during the scanning process. This scheme is particularly useful in our study because the relative positions of pump beam and sample are preserved during scanning such that a high-quality near-field image over a large scan area (30 μm × 30 μm) can be obtained.
The near-field intensity profile was obtained for each of the lasing peaks seen in the μPL spectra using a commercial dielectric SNOM probe (MF115_NTF/WA, NT-MDT). The center wavelength of the monochromator was tuned to the corresponding lasing mode wavelength. The amount of spectral shift caused by probe perturbation was measured to be less than 1 nm. The spectral resolution of the monochromator was set to ±1 nm for half width at half maximum, which is an optimal compromise between signal-to-noise ratio and mode distinguishability. For a single SNOM scan, more than 2.6 × 105 pixel data points were collected, which corresponds to a spatial resolution of 17 pixels/μm.
Supplementary Material
Acknowledgments
Funding: This work was supported by the National Research Foundation (NRF) grant funded by the Korea Government (Ministry of Education, Science and Technology) (no. 2014R1A2A1A11051576). The collaboration between Seoul National University and Institut des nanotechnologies de Lyon/Ecole Centrale de Lyon was carried out in the frame of the French-Korean Laboratoire International Associé “Center for Photonics and Nanostructures.” Author contributions: M.L. conducted the majority of experimental work, including design, fabrication, measurements, and simulations. J.L. and S.K. constructed the SNOM setup and performed initial data collection. S.C. and C.S. provided the bonded InAsP MQW wafers and involved SNOM measurements. H.J. conceived and directed the research. All authors contributed to the scientific discussions and the preparation of the manuscript. Competing interests: The authors declare that they have no competing interests. Data and materials availability: All data needed to evaluate the conclusions in the paper are present in the paper and the Supplementary Materials. Additional data related to this paper may be requested from the authors.
SUPPLEMENTARY MATERIALS
Supplementary material for this article is available at http://advances.sciencemag.org/cgi/content/full/4/1/e1602796/DC1
section S1. SEM images of fabricated devices
section S2. Ordered and disordered components in compositional disorder
section S3. Lasing properties of band-tail states
section S4. Mode profiles in momentum space
section S5. Gain overlap factors of band-tail states
section S6. Eigenmode profiles of the M2 band-tail states
section S7. Excitation strength dependence of modal properties
section S8. Estimation of the K1 BE positions in disordered PhCs
section S9. Localization length and mean free path
section S10. The Bloch states in simulated spectra
section S11. Effective width in momentum space
section S12. Resolution dependence of effective widths
fig. S1. Fabricated devices.
fig. S2. Ordered versus disordered components.
fig. S3. Lasing properties of band-tail states.
fig. S4. Momentum space profiles of the band-tail states.
fig. S5. Gain overlap factors of band-tail states.
fig. S6. Mode profiles of the M2 band-tail states.
fig. S7. Excitation power density dependence of modal properties.
fig. S8. K1 band edges in disordered PhCs.
fig. S9. Localization length and mean free path.
fig. S10. Bloch states.
fig. S11. Effective widths in momentum space.
fig. S12. Resolution dependence of effective widths.
REFERENCES AND NOTES
- 1.Anderson P. W., Absence of diffusion in certain random lattices. Phys. Rev. 109, 1492–1505 (1958). [Google Scholar]
- 2.Abou-Chacra R., Thouless D. J., Anderson P. W., A self-consistent theory of localization. J. Phys. C Solid State Phys. 6, 1734–1752 (1973). [Google Scholar]
- 3.Abrahams E., Anderson P. W., Licciardello D. C., Ramakrishnan T. V., Scaling theory of localization: Absence of quantum diffusion in two dimensions. Phys. Rev. Lett. 42, 673–676 (1979). [Google Scholar]
- 4.Thouless D. J., Electrons in disordered systems and the theory of localization. Phys. Rep. 13, 93–142 (1974). [Google Scholar]
- 5.Lee P. A., Ramakrishnan T. V., Disordered electronic systems. Rev. Mod. Phys. 57, 287–337 (1985). [Google Scholar]
- 6.John S., Soukoulis C., Cohen M. H., Economou E. N., Theory of electron band tails and the Urbach optical-absorption edge. Phys. Rev. Lett. 57, 1777–1780 (1986). [DOI] [PubMed] [Google Scholar]
- 7.John S., Strong localization of photons in certain disordered dielectric superlattices. Phys. Rev. Lett. 58, 2486–2489 (1987). [DOI] [PubMed] [Google Scholar]
- 8.Van Mieghem P., Theory of band tails in heavily doped semiconductors. Rev. Mod. Phys. 64, 755–793 (1992). [Google Scholar]
- 9.Anderson P. W., The question of classical localization: A theory of white paint? Philos. Mag. B 52, 505–509 (1985). [Google Scholar]
- 10.Van Albada M. P., Lagendijk A., Observation of weak localization of light in a random medium. Phys. Rev. Lett. 55, 2692–2695 (1985). [DOI] [PubMed] [Google Scholar]
- 11.Wolf P.-E., Maret G., Weak localization and coherent backscattering of photons in disordered media. Phys. Rev. Lett. 55, 2696–2699 (1985). [DOI] [PubMed] [Google Scholar]
- 12.Etemad S., Thompson R., Andrejco M. J., Weak localization of photons: Universal fluctuations and ensemble averaging. Phys. Rev. Lett. 57, 575–578 (1986). [DOI] [PubMed] [Google Scholar]
- 13.Wiersma D. S., Bartolini P., Lagendijk A., Righini R., Localization of light in a disordered medium. Nature 390, 671–673 (1997). [Google Scholar]
- 14.Störzer M., Gross P., Aegerter C. M., Maret G., Observation of the critical regime near Anderson localization of light. Phys. Rev. Lett. 96, 063904 (2006). [DOI] [PubMed] [Google Scholar]
- 15.Dalichaouch R., Armstrong J. P., Schultz S., Platzman P. M., McCall S. L., Microwave localization by two-dimensional random scattering. Nature 354, 53–55 (1991). [Google Scholar]
- 16.Chabanov A. A., Stoytchev M., Genack A. Z., Statistical signatures of photon localization. Nature 404, 850–853 (2000). [DOI] [PubMed] [Google Scholar]
- 17.Schwartz T., Bartal G., Fishman S., Segev M., Transport and Anderson localization in disordered two-dimensional photonic lattices. Nature 446, 52–55 (2007). [DOI] [PubMed] [Google Scholar]
- 18.Fallert J., Dietz R. J., Sartor J., Schneider D., Klingshirn C., Kalt H., Co-existence of strongly and weakly localized random laser modes. Nat. Photonics 3, 279–282 (2009). [Google Scholar]
- 19.Sperling T., Bührer W., Aegerter C. M., Maret G., Direct determination of the transition to localization of light in three dimensions. Nat. Photonics 7, 48–52 (2013). [Google Scholar]
- 20.Crespi A., Osellame R., Ramponi R., Giovannetti V., Fazio R., Sansoni L., Nicola F. D., Sciarrino F., Mataloni P., Anderson localization of entangled photons in an integrated quantum walk. Nat. Photonics 7, 322–328 (2013). [Google Scholar]
- 21.Levi L., Krivolapov Y., Fishman S., Segev M., Hyper-transport of light and stochastic acceleration by evolving disorder. Nat. Phys. 8, 912–917 (2012). [Google Scholar]
- 22.Leonetti M., Karbasi S., Mafi A., Conti C., Observation of migrating transverse Anderson localizations of light in nonlocal media. Phys. Rev. Lett. 112, 193902 (2014). [DOI] [PubMed] [Google Scholar]
- 23.Hsieh P., Chung C., McMillan J. F., Tsai M., Lu M., Panoiu N. C.,Wong C. W., Photon transport enhanced by transverse Anderson localization in disordered superlattices. Nat. Phys. 11, 268–274 (2015). [Google Scholar]
- 24.Weaver R. L., Anderson localization of ultrasound. Wave Motion 12, 129–142 (1990). [Google Scholar]
- 25.Hu H., Strybulevych A., Page J. H., Skipetrov S. E., van Tiggelen B. A., Localization of ultrasound in a three-dimensional elastic network. Nat. Phys. 4, 945–948 (2008). [Google Scholar]
- 26.Gavish U., Castin Y., Matter-wave localization in disordered cold atom lattices. Phys. Rev. Lett. 95, 020401 (2005). [DOI] [PubMed] [Google Scholar]
- 27.Billy J., Josse V., Zuo Z., Bernard A., Hambrecht B., Lugan P., Clément D., Sanchez-Palencia L., Bouyer P., Aspect A., Direct observation of Anderson localization of matter waves in a controlled disorder. Nature 453, 891–894 (2008). [DOI] [PubMed] [Google Scholar]
- 28.Louvion N., Gérard D., Mouette J., de Fornel F., Seassal C., Letartre X., Rahmani A., Callard S., Local observation and spectroscopy of optical modes in an active photonic-crystal microcavity. Phys. Rev. Lett. 94, 113907 (2005). [DOI] [PubMed] [Google Scholar]
- 29.Intonti F., Vignolini S., Riboli F., Vinattieri A., Wiersma D. S., Colocci M., Balet L., Monat C., Zinoni C., Li L. H., Houdré R., Francardi M., Gerardino A., Fiore A., Gurioli M., Spectral tuning and near-field imaging of photonic crystal microcavities. Phys. Rev. B 78, 041401 (2008). [Google Scholar]
- 30.Sapienza L., Thyrrestrup H., Stobbe S., Garcia P. D., Smolka S., Lodahl P., Cavity quantum electrodynamics with Anderson-localized modes. Science 327, 1352–1355 (2010). [DOI] [PubMed] [Google Scholar]
- 31.Cazé A., Pierrat R., Carminati R., Strong coupling to two-dimensional Anderson localized modes. Phys. Rev. Lett. 111, 053901 (2013). [DOI] [PubMed] [Google Scholar]
- 32.Kim S., Lee J., Jeon H., Callard S., Seassal C., Song K.-D., Park H.-G., Simultaneous observation of extended and localized modes in compositional disordered photonic crystals. Phys. Rev. A 88, 023804 (2013). [Google Scholar]
- 33.Conti C., Fratalocchi A., Dynamic light diffusion, three-dimensional Anderson localization and lasing in inverted opals. Nat. Phys. 4, 794–798 (2008). [Google Scholar]
- 34.Zimmermann R., Runge E., Excitons in narrow quantum wells: Disorder localization and luminescence kinetics. Phys. Stat. Sol. (A) 164, 511–516 (1997). [Google Scholar]
- 35.Hess H. F., Betzig E., Harris T. D., Pfeiffer L. N., West K. W., Near-field spectroscopy of the quantum constituents of a luminescent system. Science 264, 1740–1745 (1994). [DOI] [PubMed] [Google Scholar]
- 36.Urbach F., The long-wavelength edge of photographic sensitivity and of the electronic absorption of solids. Phys. Rev. 92, 1324 (1953). [Google Scholar]
- 37.Edwards J. T., Thouless D. J., Numerical studies of localization in disordered systems. J. Phys. C Solid State Phys. 5, 807–820 (1972). [Google Scholar]
- 38.Bell R. J., Dean P., Hibbins-Butler D. C., Localization of normal modes in vitreous silica, germania and beryllium fluoride. J. Phys. C Solid State Phys. 3, 2111–2118 (1970). [Google Scholar]
- 39.Jović D. M., Kivshar Y. S., Denz C., Belić M. R., Anderson localization of light near boundaries of disordered photonic lattices. Phys. Rev. A 83, 033813 (2011). [Google Scholar]
- 40.Ioffe A. F., Regel A. R., Non-crystalline, amorphous, and liquid electronic semiconductors. Prog. Semicond. 4, 237–291 (1960). [Google Scholar]
- 41.John S., Localization of light. Phys. Today 44, 32–40 (1991). [Google Scholar]
- 42.Seassal C., Monat C., Mouette J., Touraille E., Bakir B. B., Hattori H. T., Leclercq J.-L., Letartre X., Rojo-Romeo P., Viktorovitch P., InP bonded membrane photonics components and circuits: Toward 2.5 dimensional micro-nano-photonics. IEEE J. Sel. Top. Quant. Electron. 11, 395–407 (2005). [Google Scholar]
- 43.Park Y., Kim S., Moon C., Jeon H., Kim H. J., Butt-end fiber coupling to a surface-emitting Γ-point photonic crystal band edge laser. Appl. Phys. Lett. 90, 171115 (2007). [Google Scholar]
- 44.Hammer M., Ivanova O. V., Effective index approximations of photonic crystal slabs: A 2-to-1-D assessment. Opt. Quant. Electron. 41, 267–283 (2009). [Google Scholar]
- 45.Cao H., Zhao Y. G., Ho S. T., Seelig E. W., Wang Q. H., Chang R. P. H., Random laser action in semiconductor powder. Phys. Rev. Lett. 82, 2278–2281 (1999). [Google Scholar]
- 46.Yablonovitch E., Gmitter T. J., Meade R. D., Rappe A. M., Brommer K. D., Joannopoulos J. D., Donor and acceptor modes in photonic band structure. Phys. Rev. Lett. 67, 3380–3383 (1991). [DOI] [PubMed] [Google Scholar]
- 47.Kim S., Yoon S., Seok H., Lee J., Jeon H., Band-edge lasers based on randomly mixed photonic crystals. Opt. Express 18, 7685–7692 (2010). [DOI] [PubMed] [Google Scholar]
- 48.Quang T., Woldeyohannes M., John S., Agarwal G. S., Coherent control of spontaneous emission near a photonic band edge: A single-atom optical memory device. Phys. Rev. Lett. 79, 5238–5241 (1997). [Google Scholar]
Associated Data
This section collects any data citations, data availability statements, or supplementary materials included in this article.
Supplementary Materials
Supplementary material for this article is available at http://advances.sciencemag.org/cgi/content/full/4/1/e1602796/DC1
section S1. SEM images of fabricated devices
section S2. Ordered and disordered components in compositional disorder
section S3. Lasing properties of band-tail states
section S4. Mode profiles in momentum space
section S5. Gain overlap factors of band-tail states
section S6. Eigenmode profiles of the M2 band-tail states
section S7. Excitation strength dependence of modal properties
section S8. Estimation of the K1 BE positions in disordered PhCs
section S9. Localization length and mean free path
section S10. The Bloch states in simulated spectra
section S11. Effective width in momentum space
section S12. Resolution dependence of effective widths
fig. S1. Fabricated devices.
fig. S2. Ordered versus disordered components.
fig. S3. Lasing properties of band-tail states.
fig. S4. Momentum space profiles of the band-tail states.
fig. S5. Gain overlap factors of band-tail states.
fig. S6. Mode profiles of the M2 band-tail states.
fig. S7. Excitation power density dependence of modal properties.
fig. S8. K1 band edges in disordered PhCs.
fig. S9. Localization length and mean free path.
fig. S10. Bloch states.
fig. S11. Effective widths in momentum space.
fig. S12. Resolution dependence of effective widths.