Abstract
Several studies exist modeling the Fontan connection to understand its hemodynamic ties to patient outcomes4,19,35,38. The most patient-accurate of these studies include flexible, patient-specific total cavopulmonary connections. This study improves Fontan hemodynamic modeling by validating Fontan model flexibility against a patient-specific bulk compliance value, and employing real-time phase contrast magnetic resonance flow data. The improved model was employed to acquire velocity field information under breath-held, free-breathing, and exercise conditions to investigate the effect of these conditions on clinically important Fontan hemodynamic metrics including power loss and viscous dissipation rate. The velocity data, obtained by stereoscopic particle image velocimetry, was visualized for qualitative three-dimensional flow field comparisons between the conditions. Key hemodynamic metrics were calculated from the velocity data and used to quantitatively compare the flow conditions. The data shows a multi-factorial and extremely patient-specific nature to Fontan hemodynamics.
Introduction
The Fontan procedure is a staged, palliative intervention for single ventricle congenital heart disease patients. The result of the Fontan procedure connects the venous return directly to the pulmonary arteries via the total cavopulmonary connection (TCPC)8. The Fontan procedure shows perioperative success, but suffers from several long-term complications2,14,17,18,29. These long-term complications and comorbidities are correlated to TCPC hemodynamics10,12,16,20,23,25,27,30,37. The fact that a relationship exists between Fontan hemodynamics and patient outcomes promotes the modeling and study of TCPC hemodynamics to improve patient quality of life.
Several studies exist using in silico, in vitro, and in vivo animal models to study Fontan connection hemodynamics. A review article by DeGroff in 2008 summarized the state of Fontan circulation modeling and highlighted areas that were lacking7. DeGroff noted the use of patient-specific anatomy, pulsatile flow boundary conditions, and vessel compliance as important modeling features. Most of the studies summarized by DeGroff employed idealized anatomies, steady flow boundary conditions, and rigid wall vessels. Since then, in vitro models have progressed to include these features in a variety of studies. In 2013, Giridharan et al. used patient-specific pulsatile flow waveforms in a rigid-walled idealized anatomy Fontan connection model when assessing an impeller pump design for Fontan cavopulmonary assist11. Santhanakrishnan et al. used patient-specific pulsatile flow waveforms and arbitrary-compliance flexible walls in an idealized anatomy to examine the effect of placing a one-way valve in the Fontan connection, also in 201331. In 2014, Chopski et al. used a rigid-walled patient-specific anatomy with steady flow boundary conditions to experimentally measure the energy added to the TCPC when a mechanical pump was added to the system5. To date, the most physiologically accurate in vitro Fontan circulation model was published by Vukicevic et al.39. The model published by Vukicevic was a physical lumped parameter model that included a patient-specific compliant TCPC test section and patient-specific pulsatile flow boundary conditions to test the ability to control respiration-induced retrograde flow in the TCPC. The Vukicevic model inlet flow waveforms were verified against patient-specific respiration-gated magnetic resonance (MR) flow data. However, the Vuckicevic TCPC model compliance value was not verified as patient-specific.
The novel aspects of the model used in this study are a patient-specific verified TCPC compliance value for the flexible test section, and condition-specific flow waveforms from real-time phase contrast MR flow data. Computational studies of Fontan hemodynamics conclude that proper flexible wall modeling can affect hemodynamic metrics1,26. The same should be considered true for in vitro methods, and the exploration of such with in vitro methods can serve to verify such computational results. Condition-specific flow waveforms are important to remove the limitations inherent in modeling any patient-specific condition. Results from employing condition-specific boundary conditions can contribute to the issue of condition modeling accuracy.
The novel model was used to acquire three-dimensional velocity field information inside the TCPC under condition-specific breath-held (BH), free-breathing (BH) and peak exercise (EX) conditions. These conditions were selected to provide condition-specific insight on the effects of respiration and exercise. Respiration effects are important for Fontan patients because of the lack of a pulmonary support pump in the Fontan circulation. The resulting passive flow to the pulmonary system is susceptible to respiration pressure changes that induce retrograde flow and other phenomena3,21,34,39,40. Exercise effects are important to explore because Fontan patients experience decreased exercise capacity9,22,28,32,33. This decreased exercise capacity is directly correlated to flow efficiency through the TCPC20,40. Moreover, the acquisition of velocity field information may provide reasoning for why and how key, patient-relevant metrics are affected by respiration and exercise. To date, no in vitro study has examined instantaneous three-dimensional velocity fields inside a compliance-validated patient-specific Fontan model under real-time MR condition-specific flow data. In addition to providing physiological insight, the instantaneous three-dimensional velocity field data may be used as validation data for existing and pending fluid-structure interaction models.
The hypothesis of this study is that respiration and exercise affect in vitro TCPC hemodynamics. This hypothesis was tested by examining quantitative hemodynamic metrics acquired from a novel in vitro Fontan circulation model.
Materials and Methods
This study obtained two patient data from the Georgia Tech-Children's Hospital of Philadelphia Fontan database. Both had a completed Fontan connection. Informed consent was obtained and the protocol was approved by the Georgia Institute of Technology and Children's Hospital of Philadelphia institutional review boards. Table 1 summarizes the patient demographics and characteristics of both models.
Table 1. Patient demographics.
| Model | Gender | Age | BSA | Diagnosis | Fontan Type |
|---|---|---|---|---|---|
| #1 | Female | 11 | 1.64 | HLHS, VSD | LT |
| #2 | Male | 9 | 1.77 | HLHS | LT |
HLHS: hypoplastic left heart syndrome
VSD: ventricular septal defect
LT: lateral tunnel
The hemodynamic effect of respiration and exercise was explored by comparing hemodynamic metrics computed from the pressure, flow rate, and time-resolved three-dimensional velocity data collected from the novel in vitro circulation model. The hemodynamic values included simplified power loss, indexed simplified power loss, viscous dissipation rate, and indexed viscous dissipation rate. Power loss is important for its relationship to patient outcomes20,41. Viscous dissipation is a similar flow efficiency metric used in numerous Fontan hemodynamic studies6,13. Equations (1), (2), (3), and (4) show the computation of the simplified power loss, indexed simplified power loss, viscous dissipation rate, and indexed viscous dissipation rate, respectively.
| (1) |
| (2) |
| (3) |
| (4) |
where P was the vessel static pressure, ρ was the fluid density ( ), Qin was the vessel volumetric flow rate either into the TCPC, Qout was the vessel volumetric flow rate out of the TCPC, A was the vessel cross-sectional area. The TCPC inlets were the IVC and SVC, and the outlets were the LPA and RPA. BSA was the patient's body surface area and Qtot was the total time-averaged flow rate into the TCPC (sum of IVC and SVC flow rate).
These metrics were reported as single values. The power loss metrics were reported as time-averaged values, and the viscous dissipation terms were recorded as time- and volume-averaged values.
The effect of respiration on these hemodynamic metrics was determined by comparing values computed while the in vitro Fontan circulation modeled a patient-specific breath-held condition to values computed under a patient-specific free-breathing condition for two different patients. The effect of exercise was determined by comparing values computed while the in vitro Fontan circulation modeled a patient-specific free-breathing condition, a derived half-peak exercise condition, and a patient-specific peak exercise condition. The derived half-peak exercise experimental condition was defined as having the same practical flow waveform pulsatility as the peak exercise condition and a mean inflow rate equal to half-way between the free-breathing and peak exercise patient-specific conditions. The derived half-peak exercise experimental condition was created to more fully understand the trends due to exercise. Table 2 summarizes the condition-specific parameters used to understand the effect of respiration and exercise on the hemodynamic metrics.
Table 2.
Experimental conditions summary highlighting the conditions used to determine the effects of respiration and exercise on Fontan hemodynamics.
| Model | Effect of | Conditions | Mean Inflow Rate (IVC+SVC) (L/min) | IVC:SVC Flow Ratio (%) | LPA:RPA Flow Ratio (%) | IVC Pulsatility (%) | |
|---|---|---|---|---|---|---|---|
| #1 | Respiration | BH | Patient-Specific | 3.2 | 75.1 | 45.9 | 33.4 |
| FB | Patient-Specific | 4.04 | 76.3 | 56.4 | 84.8 | ||
| Exercise | FB | Patient-Specific | 4.04 | 76.3 | 56.4 | 84.8 | |
| EX | Half-Peak Pulsatile* | 5.95 | 77.8 | 46.1 | 93.4 | ||
| Peak Patient-Specific | 7.90 | 79.3 | 43.1 | 101.1 | |||
| #2 | Respiration | BH | Patient-Specific | 3.10 | 76.8 | 23.0 | 31.9 |
| FB | Patient-Specific | 4.96 | 43.8 | 25.3 | 115.2 | ||
| Exercise | FB | Patient-Specific | 4.96 | 43.8 | 25.3 | 115.2 | |
| EX | Half-Peak Pulsatile* | 6.20 | 47.4 | 25.1 | 118.4 | ||
| Peak Patient-Specific | 7.08 | 48.2 | 25.3 | 126.4 | |||
The denotes the derived condition.
The in vitro Fontan circulation model employed in this study was a physical lumped parameter model, as shown in Figure 1.
Figure 1. In vitro.
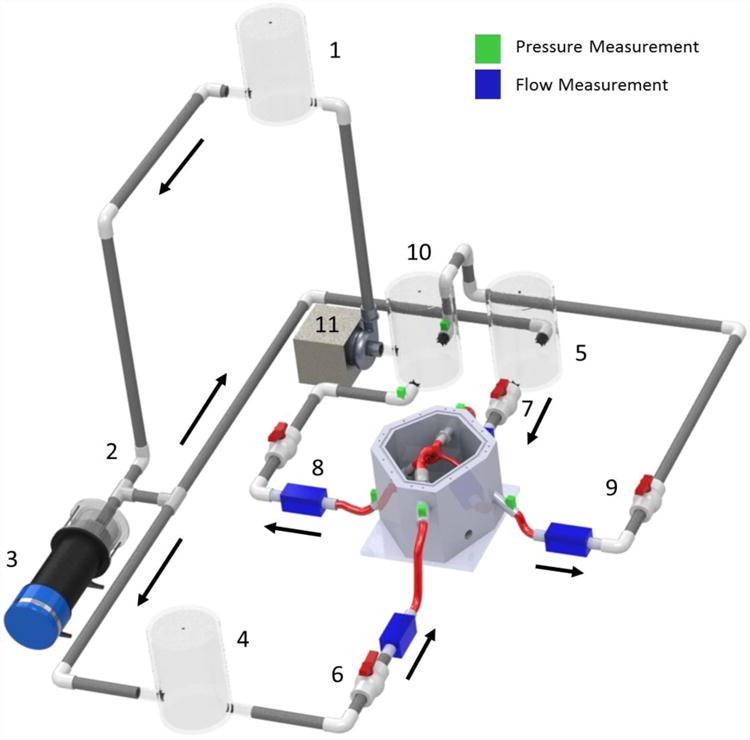
Fontan circulation model schematic. Fluid reservoirs acted to provide lumped compliance, and ball valves acted to provide lumped flow resistance. Pressure and flow measurement locations are denoted by the color legend. The arrows denote the mean flow direction.
The in vitro Fontan circulation model was a gravity-driven system filled with a saline-glycerin solution (ρ = 1060 kg/m3; μ = 0.0034 Pa ś∙s). Flow began in the single ventricle reservoir (1) and proceed through a one-way mechanical valve (2) representative of the aortic valve. A programmable piston pump (3) capable of being assigned an arbitrary waveform provided pulsatility to the flow. The flow after (3) is representative of blood in the aorta. Then, the flow split toward either a chamber used to lump all lower body blood vessel compliance (4) or a chamber used to lump all upper body blood vessel compliance (5). Two resistance valves – (6) and (7) – then provided the lumped flow resistance for the lower body and upper body, respectively, before flow entered the flexible TCPC test section. Flow exited the TCPC test section through either the right pulmonary artery (RPA) flow resistor (8) or the left pulmonary artery (LPA) flow resistor (9) before arriving at a reservoir that both lumped the pulmonary circulation compliance and acted as the single atrium (10). A steady flow pump (11) then provided the mean pressure head necessary to elevate the fluid back to the ventricular reservoir (1), and complete the cycle.
Pressure and flow rate measurements were collected at the locations highlighted in Figure 1. Pressure relative to atmospheric pressure was measured via fluid-filled strain gauge pressure transducers (Model 6199; Utah Medical Products Inc., Midvale, UT). The pressure transducers had a measurement range of -50 to 300 mmHg and a sensitivity of 5 μV/V/mmHg, or ± 2 %. Flow rates were measured with 3 in-line and 1 clamp-on ultrasonic flow probes (Transonic Systems, Ithaca, NY). The 3 in-line flow measurements were performed with model 10PXN probes. The clamp-on measurement was with a model 8PXL probe. The flow probes utilized the Doppler effect to measure the flow at a frequency of 1.2 MHz. The flow signal from each probe was sent to a TS410 tubing flow module housed within a T402 multi-channel research console. The research console applied a low pass filter at 100 Hz to each signal. All flow probes had a resolution of 0.01 L/min. Both pressure and flow measurements were collected with a custom LabVIEW 13.1 virtual instrument (National Instruments, Austin TX).
One novel aspect of the in vitro Fontan circulation model was the use of real-time phase contrast MR (rtPCMR) data. The rtPCMR was an echoplanar sequence that used shared velocity encoding, the details of which have been described previously24. The acquisition protocol consisted of through-plane PCMR across the inferior vena cava (IVC), superior vena cava (SVC), left pulmonary artery (LPA), and right pulmonary artery (RPA) for at least 10 seconds (approximately 20 frames/second). The same imaging protocol was performed under resting breath-held, resting free-breathing, and exercise conditions. Exercise conditions were obtained using an MRI-compatible supine bicycle ergometer (Lode BV, Groningen, the Netherlands) which allowed for data acquisition within 10 seconds of end exercise. Both FB and EX flows included respiration (inspiration and expiration) effects. The real-time PCMRI data was used as boundary conditions for match both the inflow and outflow flow rate waveforms. Thus, rather than modeling respiration by imposing a low-frequency pressure wave over the top of patient-specific breath-held MRI data with an additional pump, a single programmable piston pump was employed to reproduce the flow rate waveforms to match measure patient-specific data while the patient breathed. Figure 2 shows a comparison of patient-specific real-time PCMRI flow rate waveforms and in-vitro flow rate waveforms for Model 1 under free-breathing conditions.
Figure 2.
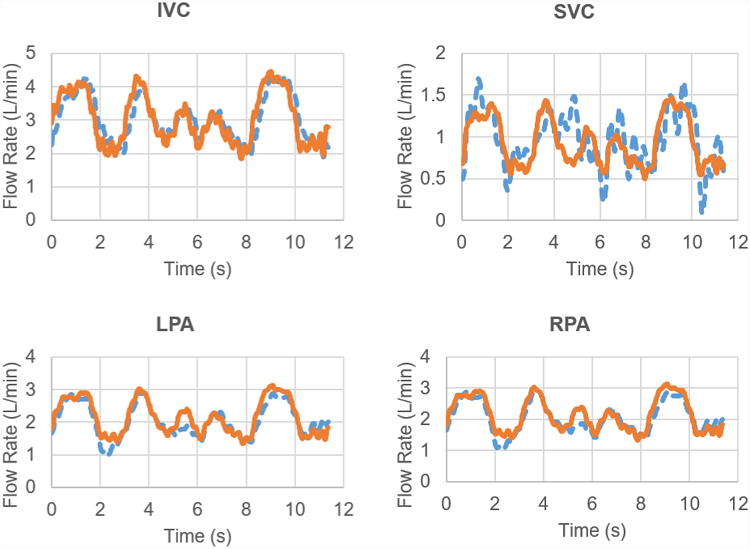
Flow rate comparisons between PCMRI (dashed-blue lines) and in-vitro data (orange-solid lines) for Model 1 under free-breathing conditions.
The other novel aspect of the in vitro Fontan circulation model was the use of a compliance-verified patient-specific TCPC model. The model's patient-specific geometry was acquired by segmenting anatomical magnetic resonance data using ITK-SNAP 3.6.042. Segmentation resulted in a three-dimensional computational model (.stl file) that was passed to the manufacturer for mold-making. The models were manufactured by BDC Labs (Wheat Ridge, CO). The models were constructed of a clear silicone compound to maintain optical access for velocity field data acquisition via particle image velocimetry methods. The models returning from the manufacturer underwent a compliance verification process outlined previously36. Table 3 summarizes the patient-specific compliances as acquired from the MRI data, and the in-vitro model compliances used in the mock Fontan circulation.
Table 3.
Summary of patient-specific (PS) and in-vitro compliance values as calculated from changes in volume and changes in pressure. The PS ΔV and ΔP values came from PCMRI data and age-matched catheter lab tracings, respectively. The in-vitro ΔV and ΔP values were monitored during the BH experiments conducted in this study.
| Model | PS ΔV (mL) | PS ∆P (mmHg) | PS C (mL/mmHg) | In-Vitro ΔV (mL) | In-Vitro ∆P (mmHg) | In-Vitro C (mL/mmHg) |
|---|---|---|---|---|---|---|
| 1 | 2.11 ± 0.21 | 1.55 ± 0.87 | 1.36 ± 0.78 | 2.69 ± 0.09 | 1.97 ± 0.02 | 1.37 ± 0.05 |
| 2 | 2.68 ± 0.27 | 1.55 ± 0.87 | 1.73 ± 0.99 | 3.42 ± 0.12 | 1.98 ± 0.05 | 1.72 ± 0.11 |
With the two novel aspects of the in vitro Fontan circulation model established, the model system was tuned to match condition-specific flow waveforms by assigning a programmable piston pump waveform, and manually adjusting compliance chamber levels and resistance valves. Comparison of the model flow waveforms to the condition-specific flow waveforms from the MR data was conducted using two error metrics – an average error and a root-mean square error, as found in Equations (5) and (6):
| (5) |
| (6) |
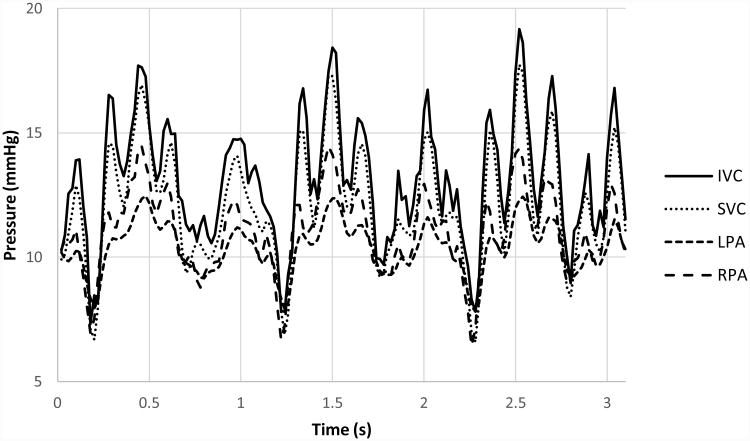
Though patient-specific pressure waveforms were not available for direct comparison because none were acquired during real-time PCMRI data acquisition, the post-tuned mean pressure values from the in vitro loop were in agreement with known values from literature15. Figure 3 shows the in vitro pressure values for the Model 1 experiment under breath-held conditions.
Figure 3.
Pressure waveforms from the in vitro Model 1 experiment under breath-held conditions.
Stereoscopic particle image velocimetry (PIV) techniques were used to collect instantaneous velocity fields composed of all three-velocity vectors on multiple coronal planes of two different flexible TCPC test sections. Each flexible TCPC model was placed in a saline-glycerin bath to reduce laser light refractive index changes. Figure 4 and Table 4 summarize the velocity field sampling planes for each model. The PIV sampling planes for Model 2 were altered from an even distribution to focus on acquiring data at central planes at the TCPC inflows and outflows.
Figure 4.
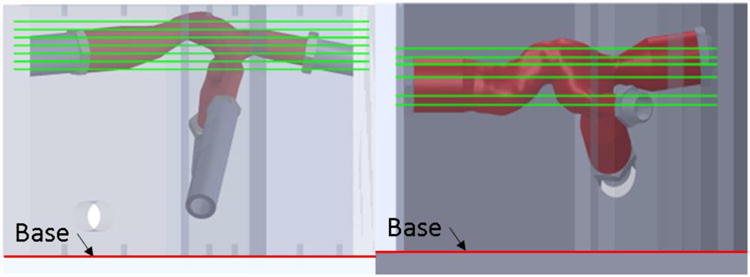
Schematic showing PIV sampling plane locations for each model. Model #1 is on the left. Model #2 is on the right.
Table 4. PIV sampling plane locations as measured from the base of each model's refractive index bath.
| Plane Number | Model #1 Plane Height (mm) | Model #2 Plane Height (mm) |
|---|---|---|
| 1 | 110 | 67 |
| 2 | 115 | 71 |
| 3 | 120 | 80 |
| 4 | 125 | 86 |
| 5 | 130 | 89 |
| 6 | 135 | 93 |
| 7 | 140 | -- |
PIV acquisition was triggered to occur at multiple times throughout the condition-specific waveforms to acquire a time-resolved data set over a representative time period. The breath-held conditions only included cardiac effects in the flow waveform, but the free-breathing and exercise conditions included both respiration and cardiac effects. The respiration time scale was much slower than the cardiac time scale, so PIV data acquisition triggering had to occur at different time points for each condition. Regardless, all PIV velocity fields were ensemble averaged over 150 instantaneous acquisitions to reduce measurement error. In-plane PIV resolution was approximately 0.083 mm/pixel with approximately one velocity vector every 0.4mm. Camera images were calibrated using a 3-dimensioanl calibration plate 3D printed to fit the test section housing and include 1 mm diameter dots spaced 4 mm apart in one plane (XY-plane). An additional plane of dots was offset from the original plane by 2 mm in the X direction and 1 mm in the Z direction. The PIV acquisition took place with the TCPC model resting in a saline-glycerin bath to reduce laser reflections due to refractive index mismatch.
Once acquired, the time-resolved velocity field planes were spatially interpolated in order to increase resolution for the viscous dissipation calculations. Figure 5 is a flow chart representing the spatial interpolation process.
Figure 5.

PIV velocity field interpolation process flow chart. The individual diagrams represent the aligned planes as a point cloud, the enclosed volume linear interpolation, and the final resampled data set (L to R). The final resampled dataset highlights only one plane though an entire volume is present.
First, the individual time-resolved planes were loaded into ParaView (Version 5.2.0, Kitware Inc., Clifton Park, NY) and aligned with one another based on visual clues within each raw PIV image. As a group, the planes were then aligned with a three-dimensional static computerized model of the TCPC wall. The velocity at the wall was set to zero. The resulting point cloud was enclosed in a rectangular prism structured grid of 0.5mm × 0.5mm × 0.5mm resolution, and the velocity values on the grid were interpolated using the point cloud. The structured grid was then mapped back on to an unstructured grid in the shape of the TCPC, with velocity values now at a higher spatial resolution. The resulting time-resolve three-dimensional velocity field was the bases for the viscous dissipation term calculations (Equations (3) and (4)). To the authors' knowledge, this study is the first instance of time-resolved three dimensional velocity field data acquired in a compliance-verified flexible TCPC test section.
The validity of this interpolation method was insured using a known flow field solution of a computational fluid dynamics (CFD) simulation. These simulation results originated from a different patient-specific MRI dataset and were not included in this study other than to act as a verification tool for the interpolation process. The solution of an idealized TCPC CFD simulation was down-sampled at 7 different orthogonal planes at arbitrary locations with non-uniform spacing. These 7 planes were then put through the same velocity field interpolation process shown in Figure 5, and the interpolation result was compared to the CFD solution from whence the planes originated. The two velocity fields were quantitatively compared by summing the difference magnitudes of the velocity values for the entire field. Treating the idealized CFD solution as true, the interpolation method introduced 1.8% error in the velocity measurements. The maximum error at any given location was 2.7%. This error was added to each interpolated velocity value and propagated to each power loss and viscous dissipation metric. Figure 6 shows a comparison of the two interpolation method validation flow fields.
Figure 6.
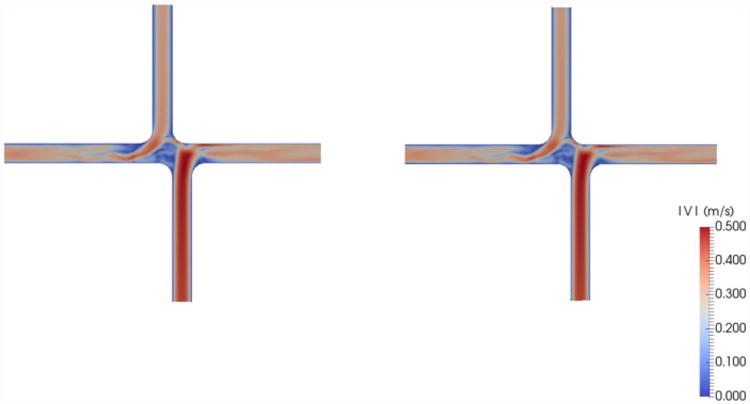
Comparison of CFD simulation result (left) and sub-sampled interpolated data (right) used to validate the velocity field interpolation method used on the stereo-PIV velocity data for this study
Results
The novel in vitro Fontan circulation model successfully produced patient-specific flow waveforms for each condition of each model. A summary of the average and root-mean square error values for each patient-specific condition are included in Table 5. The derived half-peak exercise condition was not included because there was no patient-specific MR data to compare it to for an error analysis.
Table 5. Time-average and root-mean square error metrics for each vessel waveform under each patient-specific condition.
| Model | Condition | T (s) | Vessel | εavg(%) | εrms(mL/s2) | εmax(mL/s) | |
|---|---|---|---|---|---|---|---|
| #1 | BH | Patient-Specific | 3.1 | IVC | 10.7 | 20.34 | 59.93 |
| SVC | 4.3 | 2.64 | 9.41 | ||||
| LPA | 8.2 | 9.45 | 31.78 | ||||
| RPA | 14.8 | 20.19 | 74.15 | ||||
| FB | Patient-Specific | 11.36 | IVC | 11.2 | 7.51 | 78.29 | |
| SVC | 15.9 | 3.58 | 81.78 | ||||
| LPA | 9.8 | 4.53 | 54.02 | ||||
| RPA | 12.0 | 4.71 | 70.24 | ||||
| EX | Patient-Specific | 8.02 | IVC | 5.7 | 28.78 | 121.48 | |
| SVC | 4.9 | 6.67 | 20.66 | ||||
| LPA | 6.6 | 15.73 | 38.26 | ||||
| RPA | 6.0 | 20.04 | 79.42 | ||||
| #2 | BH | Patient-Specific | 3.04 | IVC | 7.8 | 15.97 | 56.01 |
| SVC | 8.0 | 4.65 | 13.13 | ||||
| LPA | 5.2 | 2.96 | 10.67 | ||||
| RPA | 2.7 | 5.35 | 16.09 | ||||
| FB | Patient-Specific | 15.24 | IVC | 5.5 | 4.40 | 36.83 | |
| SVC | 5.1 | 5.21 | 39.39 | ||||
| LPA | 6.4 | 2.82 | 23.18 | ||||
| RPA | 6.9 | 9.12 | 66.27 | ||||
| EX | Patient-Specific | 6.48 | IVC | 9.7 | 19.83 | 116.44 | |
| SVC | 9.5 | 20.51 | 92.39 | ||||
| LPA | 6.3 | 6.17 | 26.83 | ||||
| RPA | 5.6 | 17.24 | 75.81 | ||||
The effect of respiration on Fontan hemodynamics is explored by comparing the power loss and viscous dissipation values between the breath-held and free-breathing patient-specific conditions for each model. A summary of the time-averaged power loss and time- and volume-averaged viscous dissipation values for each condition is listed in Table 6.
Table 6.
Power loss and viscous dissipation terms compared to determine the effect of respiration on Fontan hemodynamics. The uncertainty values listed represent a 95% confidence interval based on error analysis and propagation.
| Model | Condition | Ėsimp(mW) | iĖsimp(×106) | φ(1/s2) | iφ(×1012) | |
|---|---|---|---|---|---|---|
| #1 | BH | Patient-Specific | 16.3 ± 5.9 | 290.3 ± 128.3 | 6272.8 ± 280.6 | 10.66 ± 1.21 |
| FB | Patient-Specific | 55.6 ± 9.7 | 418.6 ± 128.2 | 5586.53 ± 423.3 | 5.95 ± 0.77 | |
| #2 | BH | Patient-Specific | 18.0 ± 4.6 | 374.0 ± 111.1 | 756.3 ± 28.4 | 1.49 ± 0.17 |
| FB | Patient-Specific | 33.8 ± 14.9 | 170.6 ± 79.6 | 533.6 ± 9.0 | 0.41 ± 0.04 | |
The metrics in Table 6 were calculated from pressure and flow rate data, as well as time-resolved three-dimensional velocity fields. The 95% confidence interval values are a large percentage of the total value because they include the effect of time-averaging the data in addition to measurement uncertainties. An example of the velocity fields collected to understand the effect of respiration on Fontan hemodynamics is shown in Figure 7.
Figure 7.
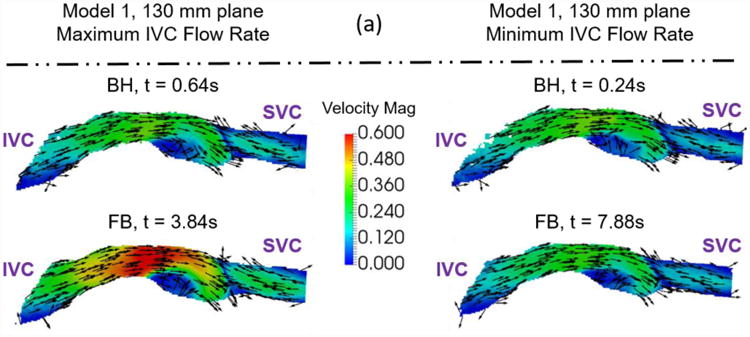
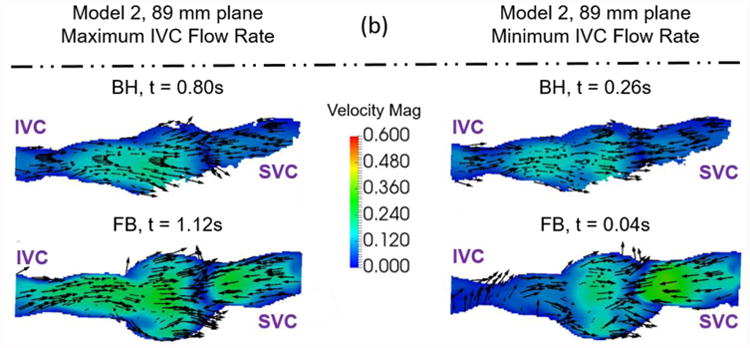
Example velocity fields collected to understand the effect of respiration on Fontan hemodynamics. Velocity fields of (a) Model 1 and (b) Model 2 were measured at a central plane (130mm and 89mm) during maximum and minimum IVC flow rate time points. The colors represent velocity magnitude. The vectors represent the velocity direction.
The effect of exercise on Fontan hemodynamics is explored by comparing the power loss and viscous dissipation values between the free-breathing patient specific, half-peak exercise derived, and peak exercise patient-specific conditions. A summary of the time-averaged power loss and time- and volume-averaged viscous dissipation values for each condition is listed in Table 7.
Table 7.
Power loss and viscous dissipation terms compared to determine the effect of exercise on Fontan hemodynamics. The uncertainty values listed represent a 95% confidence interval based on error analysis and propagation.
| Model | Condition | Ėsimp(mW) | iĖsimp(×106) | φ(1/s2) | iφ(×1012) | |
|---|---|---|---|---|---|---|
| #1 | FB | Patient-Specific | 55.6 ± 9.7 | 418.6 ± 128.2 | 5586.53 ± 423.3 | 5.95 ± 0.77 |
| EX | Half-Peak Derived | 96.6 ± 8.3 | 268.1 ± 70.9 | 18850.3 ± 44.5 | 9.26 ± 0.97 | |
| Peak Patient-Specific | 278.5 ± 5.7 | 329.4 ± 82.6 | 33359.0 ± 527.2 | 9.30 ± 0.98 | ||
| #2 | FB | Patient-Specific | 33.8 ± 14.9 | 170.6 ± 79.6 | 533.6 ± 9.0 | 0.41 ± 0.04 |
| EX | Half-Peak Derived | 71.5 ± 9.8 | 185.3 ± 37.8 | 742.4 ± 7.9 | 0.37 ± 0.04 | |
| Peak Patient-Specific | 97.9 ± 17.1 | 170.6 ± 39.4 | 807.9 ± 7.2 | 0.31 ± 0.03 | ||
The metrics in Table 7 were calculated from pressure and flow rate data, as well as time-resolved three dimensional velocity fields. Again, the 95% confidence interval values are a large percentage of the total value because they include the effect of time-averaging the data. An example of the velocity fields collected to understand the effect of exercise on Fontan hemodynamics is shown in Figure 8.
Figure 8.
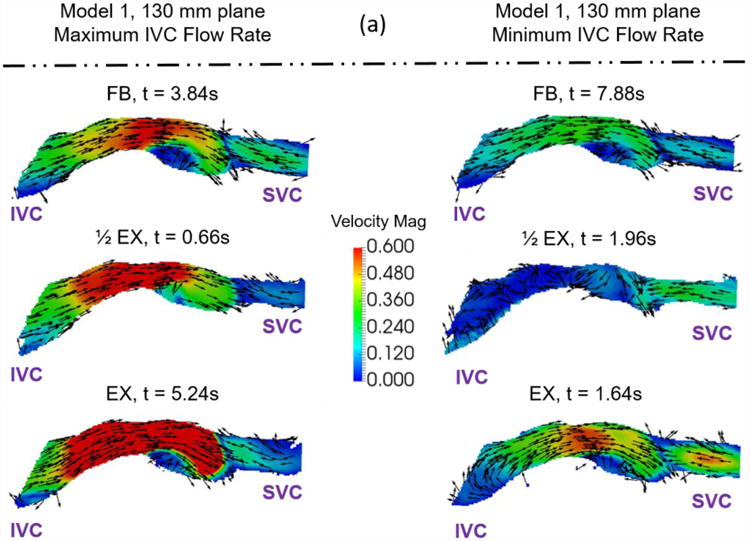
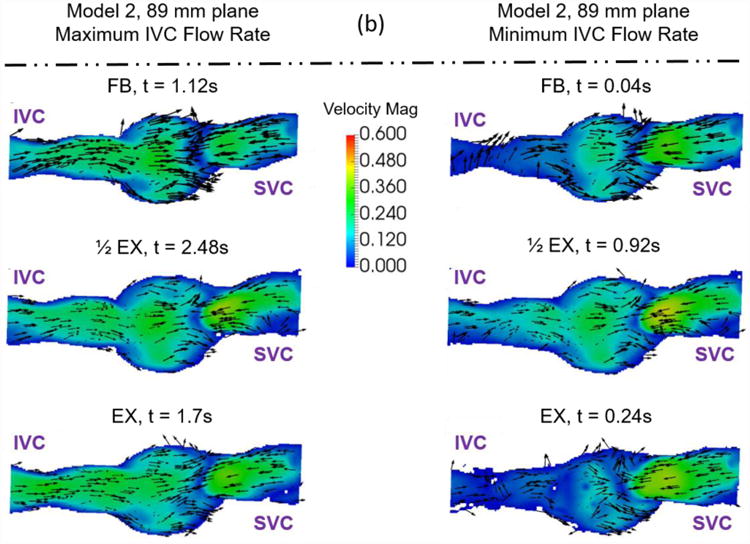
Example velocity fields collected to understand the effect of exercise on Fontan hemodynamics. Velocity fields of (a) Model 1 and (b) Model 2 were measured at a central plane (130mm and 89mm) during maximum and minimum IVC flow rate time points. The colors represent velocity magnitude. The vectors represent the velocity direction.
Discussion
A novel in vitro Fontan circulation model was developed and used to show the effect of respiration and exercise on Fontan hemodynamics. The novel aspects of the in vitro Fontan circulation model included a patient-specific compliance-verified flexible TCPC model, and the use of patient-specific, condition-specific real-time phase contrast MR data. These additions create the most physiologically accurate in vitro Fontan circulation model to date, and provide a unique opportunity to comment on the effect of respiration and exercise on Fontan hemodynamics. The error analysis summarized in Table 5 shows good agreement between the modeled flow rate and in vivo data. The error values shown here are similar to those reported in the literature38. A study by Vukicevic et al showed mean flow rate comparisons of the IVC and SVC between experimental and clinical values to be between 3.7% and 8.2%. These error estimates can be compared to the average error values calculated in this study.
The effect of respiration and exercise was shown qualitatively by comparison of the PIV velocity fields and quantitatively by comparison of power loss and viscous dissipation hemodynamic metrics between patient-specific breath-held, free-breathing, and exercise conditions based on real-time phase contrast magnetic resonance data.
The qualitative effect of respiration is shown in Figure 7. Both models show similar flow fields between BH and FB conditions at both maximum IVC flow rate and minimum IVC flow rate time points. The only significant difference is the magnitude of the peak velocity, though its position relative the model geometry does not change. The quantitative effect of respiration resulted in a consistent increase in simplified power loss and a consistent decrease in indexed viscous dissipation rate for both models (Table 6). Further examination of the quantitative metrics between BH and FB conditions shows an order of magnitude difference in viscous dissipation metrics between the models that is not seen in the power loss metric. This fact shows a significant difference between the mechanisms of energy loss between the two patients. The power loss metric takes into account mean flow rate changes between the conditions, while viscous dissipation is a summation of local velocity gradients. Thus, it is possible that ratio of fluid energy lost based on mean flow rate is higher for Model 2 than for Model 1. Examination of the experimental conditions (Table 2) shows that more than one experimental parameter changes between the breath-held and free-breathing conditions for both models. In particular, the mean inflow rate and the flow waveform pulsatility change significantly for both models. Model #2 also experiences a significant change in the IVC:SVC inflow ratio when respiration effects are added. The changing of multiple experimental parameters means one cannot identify a single hemodynamic reason for why the metrics change when respiration is added. The experimental parameters also change by different amounts for the different models. Thus, the effect of respiration is patient-specific and should always be treated as such.
The qualitative effect of exercise is shown in Figure 8. During both the minimum and maximum IVC flow rate time points, Model 1 shows an increase in velocity magnitude in the center of the Fontan connection with increasing exercise intensity with little change in the overall flow features. Model 2 shows the same trend, but less dramatically. This stands to reason, as the changes in conditions between resting and peak exercise for the patient represented by Model 2 were less extreme than for the patient represented by Model 1. Table 2 shows metrics describing these patient specific conditions.
The quantitative effect of exercise resulted in a consistent increase in simplified power loss and the viscous dissipation rate term with increasing exercise intensity. Again, examination of the experimental conditions (Table 2) shows that more than one experimental parameter changes between the patient-specific free-breathing, derived half-peak exercise, and patient-specific peak exercise conditions for both models. In particular, the mean inflow rate and the flow waveform pulsatility change with increasing exercise intensity. The other parameters undergo small changes, but are practically equivalent. Once again, one cannot identify a single hemodynamic reason for why the metrics change with increasing exercise intensity due to the multi-factorial and patient-specific nature of the exercise conditions. This result highlights the importance of using condition-specific data when calculating hemodynamic metrics. The practice of modeling exercise effects with a simple increase in mean inflow rate or other single parameter changes should be avoided.
Study limitations concerning the in vitro Fontan circulation model exist. Despite its novelty, the flexible TCPC test section is a linear homogenous material that is verified to a bulk patient-specific metric (compliance). In reality, the in vivo Fontan connection is a non-homogeneous construct of graft material and non-linear native tissue. Thus, the flexible TCPC model does not deform in the exact manner as the patient-specific in vivo Fontan connection. These deformation differences could affect the calculated hemodynamic metrics. The viscous dissipation rate is more likely to be affected because of its direct dependence on spatial velocity gradients, which would undoubtedly be affected by changes in wall deformation. Regardless, the total volume change of each of the TCPC models during the most extreme conditions was less than 3%. Such a small volumetric change means that local changes could not have been terribly extreme either. A linear elastic homogenous material was necessarily chosen for the flexible TCPC model to ensure optical access for PIV measurements. In addition, static pressure outside the flexible TCPC model was not controlled and did not change in time. Thus, the instantaneous pressure values, and their phase shift with respect to instantaneous flow rate values are suspect. Accordingly, only time-averaged values were reported in this study.
Though the velocity field interpolation method was validated, and showed a relatively small velocity error, the interpolation method employed a static TCPC model. The experimental model wall experienced some deformation, which places additional limits on the validity of the interpolation method and the subsequent velocity field results. The total volume deformation over each representative cycle never exceeded 10%, but to truly understand the impact of this assumption the wall deformation must be tracked and quantified. This is the subject of pending studies.
Overall, respiration and exercise affect Fontan hemodynamics in a multi-factorial and patient-specific way. This finding emphasizes the importance of acquiring and using patient-specific, condition-specific data to model respiration and exercise rather than using cohort-averaged data.
Acknowledgments
The authors thank funding for this study from Children’s Healthcare of Atlanta and the Children’s Miracle network (Award Number: 660069-0316) and the National Heart, Lung, and Blood Institute (Grants No. HL67622 and HL098252).
References
- 1.Bazilevs Y, Hsu MCC, Benson DJ, Sankaran S, Marsden AL. Computational fluid–structure interaction: methods and application to a total cavopulmonary connection. Comput Mech. 2009;45:77–89. [Google Scholar]
- 2.van den Bosch AE, Roos-Hesselink JW, Van Domburg R, Bogers AJJJC, Simoons ML, Meijboom FJ. Long-term outcome and quality of life in adult patients after the Fontan operation. Am J Cardiol. 2004;93:1141–5. doi: 10.1016/j.amjcard.2004.01.041. [DOI] [PubMed] [Google Scholar]
- 3.Van De Bruaene A, Claessen G, La Gerche A, Kung E, Marsden AL, De Meester P, Devroe S, Bogaert J, Claus P, Heidbuchel H, Budts W, Gewillig M. Effect of respiration on cardiac filling at rest and during exercise in Fontan patients: A clinical and computational modeling study. IJC Hear Vasc. 2015;9:100–108. doi: 10.1016/j.ijcha.2015.08.002. [DOI] [PMC free article] [PubMed] [Google Scholar]
- 4.Chopski SG. Experimental and Computational Assessment of Mechanical Circulatory Assistance of a Patient-Specific Fontan Vessel Configuration. 2013 [Google Scholar]
- 5.Chopski SG, Rangus OM, Moskowitz WB, Throckmorton AL. Experimental Measurements of Energy Augmentation for Mechanical Circulatory Assistance in a Patient-Specific Fontan Model. Artif Organs. 2014;38:791–799. doi: 10.1111/aor.12255. [DOI] [PubMed] [Google Scholar]
- 6.Cibis M, Jarvis K, Markl M, Rose M, Rigsby C, Barker AJ, Wentzel JJ. The effect of resolution on viscous dissipation measured with 4D flow MRI in patients with Fontan circulation: Evaluation using computational fluid dynamics. J Biomech. 2015;48:2984–2989. doi: 10.1016/j.jbiomech.2015.07.039. [DOI] [PMC free article] [PubMed] [Google Scholar]
- 7.DeGroff CG. Modeling the Fontan circulation: where we are and where we need to go. Pediatr Cardiol. 2008;29:3–12. doi: 10.1007/s00246-007-9104-0. [DOI] [PubMed] [Google Scholar]
- 8.Fontan F, Baudet E. Surgical repair of tricuspid atresia. Thorax. 1971;26:240–8. doi: 10.1136/thx.26.3.240. [DOI] [PMC free article] [PubMed] [Google Scholar]
- 9.Forsdick V, Iyengar AJ, Carins T, Gentles TL, Weintraub RG, Celermajer DS, D'Udekem Y. Unsatisfactory Early and Late Outcomes After Fontan Surgery Delayed to Adolescence and Adulthood. Semin Thorac Cardiovasc Surg. 2015;27:168–174. doi: 10.1053/j.semtcvs.2015.05.001. [DOI] [PubMed] [Google Scholar]
- 10.Gewillig MH, Lundström UR, Bull C, Wyse RKH, Deanfield JE. Exercise responses in patients with congenital heart disease after fontan repair: Patterns and determinants of performance. J Am Coll Cardiol. 1990;15:1424–1432. doi: 10.1016/s0735-1097(10)80034-8. [DOI] [PubMed] [Google Scholar]
- 11.Giridharan GA, Koenig SC, Kennington J, Sobieski MA, Chen J, Frankel SH, Rodefeld MD. Performance evaluation of a pediatric viscous impeller pump for Fontan cavopulmonary assist. J Thorac Cardiovasc Surg. 2013;145:249–57. doi: 10.1016/j.jtcvs.2012.01.082. [DOI] [PMC free article] [PubMed] [Google Scholar]
- 12.Goldberg DJ, Paridon SM. The Fontan Circulation: The Search for Targeted Therapy. Circulation. 2014;130:1999–2001. doi: 10.1161/CIRCULATIONAHA.114.013365. [DOI] [PubMed] [Google Scholar]
- 13.Healy TM, Lucas CW, Yoganathan AP. Noninvasive Fluid Dynamic Power Loss Assessments for Total Cavopulmonary Connections Using the Viscous Dissipation Function: A Feasibility Study. J Biomech Eng. 2001;123:317. doi: 10.1115/1.1384875. [DOI] [PubMed] [Google Scholar]
- 14.Hebson CL, McCabe NM, Elder RW, Mahle WT, McConnell M, Kogon BE, Veledar E, Jokhadar M, Vincent RN, Sahu A, Book WM. Hemodynamic phenotype of the failing Fontan in an adult population. Am J Cardiol. 2013;112:1943–7. doi: 10.1016/j.amjcard.2013.08.023. [DOI] [PMC free article] [PubMed] [Google Scholar]
- 15.Hsia TY, Khambadkone S, Bradley SM, de Leval MR. Subdiaphragmatic venous hemodynamics in patients with biventricular and Fontan circulation after diaphragm plication. J Thorac Cardiovasc Surg. 2007;134:1397–1405. doi: 10.1016/j.jtcvs.2007.07.044. [DOI] [PubMed] [Google Scholar]
- 16.Hsia TY, Khambadkone S, Deanfield JE, Taylor JFN, Migliavacca F, de Leval MR. Subdiaphragmatic venous hemodynamics in the Fontan circulation. J Thorac Cardiovasc Surg. 2001;121:436–47. doi: 10.1067/mtc.2001.112527. [DOI] [PubMed] [Google Scholar]
- 17.Hsu DT. The Fontan operation: the long-term outlook. Curr Opin Pediatr. 2015;27 doi: 10.1097/MOP.0000000000000271. [DOI] [PubMed] [Google Scholar]
- 18.Khairy P, Fernandes SM, Mayer JE, Triedman JK, Walsh EP, Lock JE, Landzberg MJ. Long-term survival, modes of death, and predictors of mortality in patients with Fontan surgery. Circulation. 2008;117:85–92. doi: 10.1161/CIRCULATIONAHA.107.738559. [DOI] [PubMed] [Google Scholar]
- 19.Khiabani RH, Restrepo M, Tang E, de Zélicourt DA, Sotiropoulos F, Fogel MA, Yoganathan AP. Effect of flow pulsatility on modeling the hemodynamics in the total cavopulmonary connection. J Biomech. 2012;45:2376–81. doi: 10.1016/j.jbiomech.2012.07.010. [DOI] [PMC free article] [PubMed] [Google Scholar]
- 20.Khiabani RH, Whitehead KK, Han D, Restrepo M, Tang E, Bethel J, Paridon SM, Fogel MA, Yoganathan AP. Exercise capacity in single-ventricle patients after Fontan correlates with haemodynamic energy loss in TCPC. Heart. 2014:1–5. doi: 10.1136/heartjnl-2014-306337. [DOI] [PubMed] [Google Scholar]
- 21.Khiabani RH, Whitehead K, Losse J, Fogel M, Yoganathan A. The Effects of Respiration on Flow in the Fontan Pathway Using Real Time Phase Contrast Magnetic Resonance Imaging At Resting Conditions. J Am Coll Cardiol. 2014;63:A1039. [Google Scholar]
- 22.Kung E, Perry JC, Davis C, Migliavacca F, Pennati G, Giardini A, Hsia TY, Marsden AL. Computational Modeling of Pathophysiologic Responses to Exercise in Fontan Patients. Ann Biomed Eng. 2014;43:1335–1347. doi: 10.1007/s10439-014-1131-4. [DOI] [PMC free article] [PubMed] [Google Scholar]
- 23.de Leval MR, Deanfield JE. Four decades of Fontan palliation. Nat Rev Cardiol. 2010;7:520–527. doi: 10.1038/nrcardio.2010.99. [DOI] [PubMed] [Google Scholar]
- 24.Lin HYY, Bender JA, Ding Y, Chung YCC, Hinton AM, Pennell ML, Whitehead KK, Raman SV, Simonetti OP. Shared velocity encoding: A method to improve the temporal resolution of phase-contrast velocity measurements. Magn Reson Med. 2012;68:703–710. doi: 10.1002/mrm.23273. [DOI] [PMC free article] [PubMed] [Google Scholar]
- 25.Mertens L, Hagler DJ, Sauer U, Somerville J, Gewillig MH. Protein-losing enteropathy after the Fontan operation: an international multicenter study. J Thorac Cardiovasc Surg. 1998;115:1063–73. doi: 10.1016/s0022-5223(98)70406-4. [DOI] [PubMed] [Google Scholar]
- 26.Mirabella L, Haggerty CM, Passerini T, Piccinelli M, Powell AJ, Del Nido PJ, Veneziani A, Yoganathan AP, Del Nido PJ. Treatment planning for a TCPC test case: A numerical investigation under rigid and moving wall assumptions. Int j numer method biomed eng. 2013;29:197–216. doi: 10.1002/cnm.2517. [DOI] [PubMed] [Google Scholar]
- 27.O'Donnell CP, Landzberg MJ. The “failing” Fontan circulation. Prog Pediatr Cardiol. 2002;16:105–114. [Google Scholar]
- 28.Ohuchi H, Negishi J, Noritake K, Hayama Y, Sakaguchi H, Miyazaki A, Kagisaki K, Yamada O. Prognostic Value of Exercise Variables in 335 Patients after the Fontan Operation: A 23-year Single-center Experience of Cardiopulmonary Exercise Testing. Congenit Heart Dis. 2014;10:105–116. doi: 10.1111/chd.12222. [DOI] [PubMed] [Google Scholar]
- 29.Poh CL, Zannino D, Weintraub RG, Winlaw DS, Grigg LE, Cordina R, Hornung T, Bullock A, Justo RN, Gentles TL, Verrall C, du Plessis K, Celermajer DS, d'Udekem Y. Three decades later: the fate of the population of patients who underwent the Atriopulmonary Fontan procedure. Int J Cardiol. 2017 doi: 10.1016/j.ijcard.2017.01.057. [DOI] [PubMed] [Google Scholar]
- 30.Rychik J, Goldberg DJ, Dodds K. Long-term results and consequences of single ventricle palliation. Prog Pediatr Cardiol. 2010;29:19–23. [Google Scholar]
- 31.Santhanakrishnan A, Maher KO, Tang E, Khiabani RH, Johnson J, Yoganathan AP. Hemodynamic effects of implanting a unidirectional valve in the inferior vena cava of the Fontan circulation pathway: an in vitro investigation. Am J Physiol Heart Circ Physiol. 2013;305:H1538–47. doi: 10.1152/ajpheart.00351.2013. [DOI] [PubMed] [Google Scholar]
- 32.Senzaki H, Masutani S, Ishido H, Taketazu M, Kobayashi T, Sasaki N, Asano H, Katogi T, Kyo S, Yokote Y. Cardiac rest and reserve function in patients with Fontan circulation. J Am Coll Cardiol. 2006;47:2528–35. doi: 10.1016/j.jacc.2006.03.022. [DOI] [PubMed] [Google Scholar]
- 33.Smaś-Suska M, Tomkiewicz-Pająk L, Weryński P, Dłużniewska N, Olszowska M, Podolec P. Exercise capacity in adult patients after Fontan procedure (RCD code: IV-5B.1) J Rare Cardiovasc Dis. 2016;2:254–258. [Google Scholar]
- 34.Tang TLE. Effect of Geometry, Respiration and Vessel Deformability on Fontan Hemodynamics: a Numerical Investigation. 2015 [Google Scholar]
- 35.Taylor CA, Figueroa CA. Patient-specific modeling of cardiovascular mechanics. Annu Rev Biomed Eng. 2009;11:109–34. doi: 10.1146/annurev.bioeng.10.061807.160521. [DOI] [PMC free article] [PubMed] [Google Scholar]
- 36.Tree M, Wei ZA, Munz B, Maher K, Deshpande S, Slesnick T, Yoganathan A. A Method for In Vitro Compliance Verification. ASME J Biomech Eng. 2017 doi: 10.1115/1.4036474. [DOI] [PubMed] [Google Scholar]
- 37.Tweddell JS, Nersesian M, Mussatto KA, Nugent M, Simpson P, Mitchell ME, Ghanayem NS, Pelech AN, Marla R, Hoffman GM. Fontan palliation in the modern era: factors impacting mortality and morbidity. Ann Thorac Surg. 2009;88:1291–9. doi: 10.1016/j.athoracsur.2009.05.076. [DOI] [PubMed] [Google Scholar]
- 38.Vukicevic M, Chiulli JA, Conover TA, Pennati G, Hsia TY, Figliola RS. Mock circulatory system of the fontan circulation to study respiration effects on venous flow behavior. ASAIO J (American Soc Artif Intern Organs 1992) 2013;59:253–60. doi: 10.1097/MAT.0b013e318288a2ab. [DOI] [PMC free article] [PubMed] [Google Scholar]
- 39.Vukicevic M, Conover TA, Jaeggli M, Zhou J, Pennati G, Hsia TY, Figliola RS. Control of respiration-driven retrograde flow in the subdiaphragmatic venous return of the Fontan circulation. ASAIO J. 2014;60:21–23. doi: 10.1097/MAT.0000000000000093. [DOI] [PMC free article] [PubMed] [Google Scholar]
- 40.Wei Z, Whitehead KK, Khiabani RH, Tree M, Tang E, Paridon SM, Fogel MA, Yoganathan AP. Respiratory Effects on Fontan Circulation During Rest and Exercise Using Real-Time Cardiac Magnetic Resonance Imaging. Ann Thorac Surg. 2016;101:1818–1825. doi: 10.1016/j.athoracsur.2015.11.011. [DOI] [PMC free article] [PubMed] [Google Scholar]
- 41.Whitehead KK, Pekkan K, Kitajima HD, Paridon SM, Yoganathan AP, Fogel MA. Nonlinear power loss during exercise in single-ventricle patients after the Fontan: insights from computational fluid dynamics. Circulation. 2007;116:I165–71. doi: 10.1161/CIRCULATIONAHA.106.680827. [DOI] [PubMed] [Google Scholar]
- 42.Yushkevich PA, Piven J, Hazlett HC, Smith RG, Ho S, Gee JC, Gerig G. User-guided 3D active contour segmentation of anatomical structures: significantly improved efficiency and reliability. Neuroimage. 2006;31:1116–28. doi: 10.1016/j.neuroimage.2006.01.015. [DOI] [PubMed] [Google Scholar]


