Abstract
Purpose
CPX-351 is a novel liposomal formulation of cytarabine and daunorubicin which has recently been FDA-approved for treatment of acute myeloid leukemia (AML). The current study investigated the pharmacokinetics (PK) of this liposomal formulation.
Methods
CPX-351 PK data (cytarabine, daunorubicin, and metabolites) from a Phase I study of relapsed and refractory AML were used for the analysis. Therapy was given days 1, 3, and 5 of induction (3 to 134 units/m2). We developed a population PK model to characterize CPX-351 disposition.
Results
39 patients (3589 samples) were evaluated. Liposomal cytarabine and daunorubicin were modeled separately with their respective metabolites. A one-compartment model fit the parent compounds well; the metabolites required two-compartment models. Weight was an independent predictor of liposomal volumes; mild renal and liver dysfunction were not predictors of clearance or volume (maximum creatinine 1.6 mg/dL, total bilirubin 1.8 mg/dL). Liposomal clearances of the two drugs were highly correlated and 1000-fold smaller than published non-encapsulated values supporting prolonged encapsulation in the liposome.
Conclusions
The PK model demonstrates prolonged exposure to cytarabine and daunorubicin without increases in non-hematologic toxicity that indicates retention of the drugs within the liposome. The unique pharmacology of this formulation may allow for simplified regimens and improved outcomes.
Keywords: liposome, pharmacokinetics, pharmacodynamics, AML, CPX-351
INTRODUCTION
Standard induction therapy for patients with acute myeloid leukemia (AML) is a 7 day course of cytarabine with 3 days of anthracycline (daunorubicin or idarubicin); termed 7+3 induction1. It has significant toxicities requiring inpatient hospitalization and tolerability is limited to medically fit patients. Although long-term durable remissions can approach 60–70% for younger patients with favorable risk disease, older patients without favorable risk factors have cure rates of less than 15%2. These compounds were originally selected based on non-overlapping toxicities. However given the differential half-lives and infusion schedules for these compounds, drug levels and ratios seen change dramatically over the course of induction therapy.
Liposomal formulations have been explored as a methodology to improve efficacy with enhanced exposure of therapeutics while limiting toxicity. As an example, liposomal doxorubicin has been associated with reduced cardiac toxicity3. The ability of the liposome to retain drug with minimal leakage is important for toxicity and efficacy4. While liposomal formulations are increasingly being pursued to decrease toxicity and prolong exposure, there is limited experience in oncology with combination liposomal therapy.
CPX-351 is a liposomal formulation of cytarabine and daunorubicin that contains the two drugs in a 5:1 molar ratio. The 5:1 molar ratio has previously been shown to provide enhanced anti-leukemic activity both in vitro and in vivo5, 6. The liposomal membrane is composed of distearoylphosphatidylcholine, distearolyphosphatidylglyerol, and cholesterol in a 7:2:1 molar ratio. This novel formulation has been explored for treatment of AML for newly diagnosed older adults and as salvage therapy in Phase 2 studies7, 8. Randomized phase III data indicated a significant improvement in survival over standard cytarabine and daunorubicin induction chemotherapy for older patients with secondary leukemias leading to FDA-approval9.
There is a limited knowledge of the clinical pharmacology of CPX-351. A better understanding of how the drug is released from the liposome and the dosing adjustments necessary for special populations is needed. The current project aims to develop a population pharmacokinetic model to address these issues and characterize liposomal cytarabine and daunorubicin disposition.
MATERIALS AND METHODS
Patient population, drug administration, and sampling
CPX-351 data from a phase 1 clinical trial of adults with relapsed or refractory AML was used for the analysis and have been previously described10. Informed consent was obtained for all patients in the phase 1 clinical trial. CPX-351 was given as an IV infusion over 90 minutes days 1, 3, and 5 of first induction therapy. Doses ranged 3–134 units/m2 (1 unit: 1 mg cytarabine, 0.44 mg daunorubicin; 5:1 molar ratio). The maximum tolerable dose of the phase 1 trial was 101 units/m2. Pharmacokinetic assessments were obtained at predose, 45 minutes, 90 minutes, and 2, 4, 6, 8, 12, and 24 hours after the start of the infusion on day 1; predose, 45 and 90 minutes after the start of the infusion on day 3; and predose, 45 and 90 minutes, and 2, 4, 6, 8, 12, 24, 48, 72, 96, and 168 hours after the start of the infusion on day 5. Validated analytic methods employed liquid chromatography–tandem mass spectrometry for quantification of cytarabine, daunorubicin, uracil arabinoside (araU), and daunorubicinol (daunoU) as previously described10. DaunoU is an active metabolite while araU is inactive. The cytarabine and daunorubicin assays included a step for dissolving the liposomal membrane to liberate the encapsulated drugs. Thus drug concentrations represent total (encapsulated and non-encapsulated) plasma cytarabine and daunorubicin. The uracil arabinoside assay used a gemcitabine internal standard.
Pharmacokinetic analysis
Using the computer program NONMEM (version 7.2) with a GNU Fortran G77 Compiler, concentration-time data were modeled using first-order conditional estimation method (FOCE) with interaction. Cytarabine and daunorubicin were modeled separately (ADVAN6, TRANS1 subroutine) with modeling of parent and metabolite compounds performed simultaneously. An exponential-normal distribution error model was used for inter-subject variability.
Renal function (serum creatinine (SCR), calculated glomerular filtration rate by Cockgroft-Gault (GFR)), liver function (AST, ALT, total bilirubin), age, weight, and gender were evaluated as potential covariates for liposomal and metabolite clearance and liposomal volume of distribution. Potential covariates were added to the model one at a time as a linear function, with covariates that improved the model fitting by a change in the objective function of at least 4.0 (p < ~0.05) being retained in the initial covariate screen. A forward stepwise addition approach was utilized in the multivariate assessment. Covariates found to decrease the objective function by 8.0 (p<~0.005) or greater were retained in the final model.
Separate residual errors were considered for liposomal and metabolite concentration data. Empiric Bayesian estimates of individual pharmacokinetic parameters were generated from the final model using the POSTHOC subroutine. A 1000 sample bootstrap assessment of the final model was performed using Wings for NONMEM for the cytarabine and daunorubicin models.
Monte Carlo simulations were performed using the final population PK model to assess the maximum tolerable dose of 101 units/m2 for cytarabine (101 mg/m2) and daunorubicin (44 mg/m2). Concentration profiles were generated for 1,000 virtual (667 male and 333 female) patients representative of the study population. Randomly generated weights with a uniform distribution around the mean weight for males and females, respectively, as observed in the study were assigned to each virtual patient. The correlation of weight and height was determined using linear regression (SAS v. 9.4) and height was assigned based on a randomly distributed uniform distribution around the correlated height.
Exposure-response assessment
The relationship between exposure (AUC) and response data during initial induction therapy were explored using statistical software (SAS v. 9.4). AUC for a single dose was calculated from final population pharmacokinetic model estimates by dividing dose by clearance. Logistic regression was used to determine the relationship between AUC and occurrence of reported complete remission.
RESULTS
Pharmacokinetic data were available for 39 patients (26 male, 13 female; 85% white) undergoing first induction with CPX-351 (904 cytarabine, 904 daunorubicin, 910 araU, and 871 daunoU concentrations; 3589 total samples) of whom 13 were treated at the maximum tolerable dose of 101 units/m2. Median (range) of laboratory values prior to treatment were: serum creatinine 0.90 (0.6 – 1.6) mg/dL, total bilirubin 0.60 (0.20 – 1.8) mg/dL, AST 28 (12 – 124) U/L, ALT 27 (15 – 151) U/L and GFR 77.6 (27.5 – 171.8) mL/min. Median (range) age and weight were 62 (24 – 81) years and 75.8 (38.9 – 156.5) kg, respectively.
Population pharmacokinetic base model
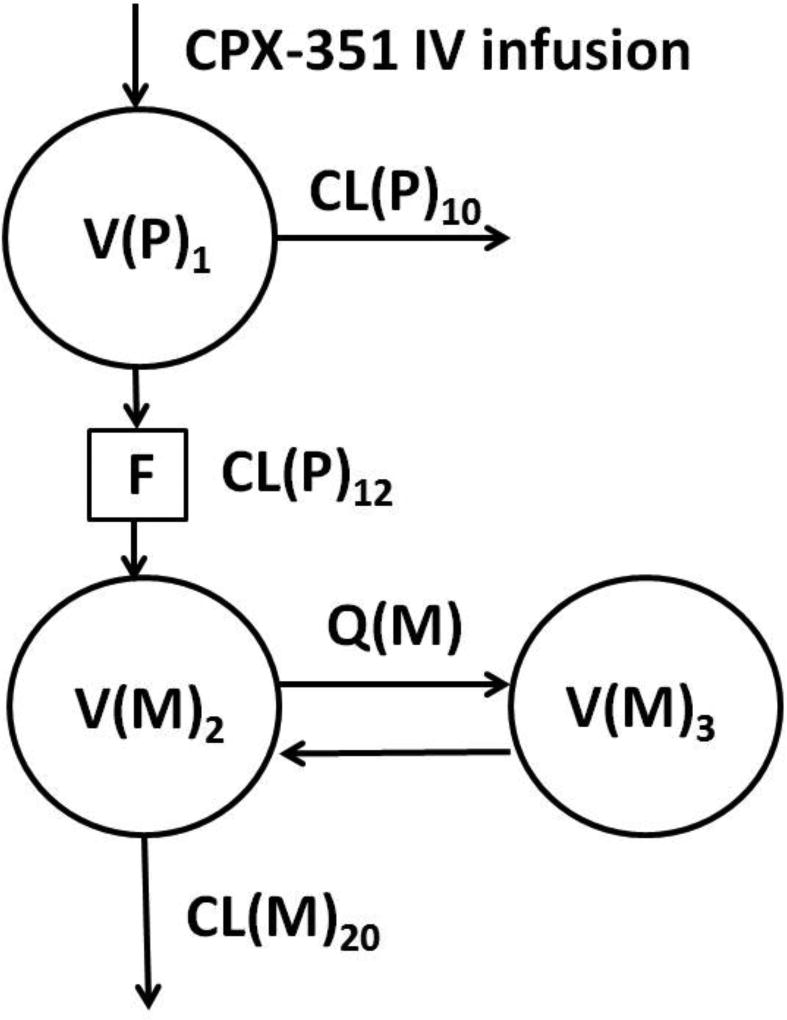
Liposomal cytarabine and daunorubicin were evaluated separately using one compartment models. Combined parent drug and metabolite models were described using two compartments to characterize the metabolite concentrations (Figure 1). Metabolite volume (Vss(M)=V(M)2+V(M)3) was fixed to known literature values (118 L araU11, 1031 L daunoU12) due to identifiability issues with metabolite volume estimates. The clearance of the parent CL(P)10 independent of the major metabolite pathway was found to be minimal in the preliminary model, thus was fixed to zero for both cytarabine and daunorubicin. Separate residual error terms were assigned to parent and metabolite concentrations.
Figure 1.
Population pharmacokinetic model for liposomal cytarabine and daunorubicin with their respective metabolites uracil arabinoside (araU) and daunorubicinol (daunoU). Clearance of parent independent of the major pathway (CL(P)10) was fixed to 0. Clearance of parent by the major pathway (CL(P)12), parent volume (V(P)1), inter-compartmental clearance of metabolite (Q(M)), and metabolite volumes (V(M)2, V(M)3) were estimated separately for cytarabine and daunorubicin. The liposome is broken down to release free drug (F) prior to formation of metabolite. Metabolite volume (Vss(M) = V(M)2 + V(M)3) was fixed to literature values.
Cytarabine pharmacokinetic model
The univariate screen identified weight on parent (V(P)1) and metabolite (V(M)2, V(M)3) volumes, SCR on V(P)1, parent clearance (CL(P)12), and gender on V(P)1 as potential covariates, however the multivariate screen only identified weight as independent predictors of V(P)1,V(M)2, and V(M)3. Inter-subject variability was assessed on CL(P)12, metabolite clearance (CL(M)20), and V(P)1. During the bootstrap model validation the weight covariate assessments on metabolite volumes (V(M)2, V(M)3) had a 95% confidence interval including zero indicating a non-significant impact. Therefore weight as a covariate on the metabolite volume was removed from the final model. The final pharmacokinetic model had linear weight as an independent predictor of V(P)1.
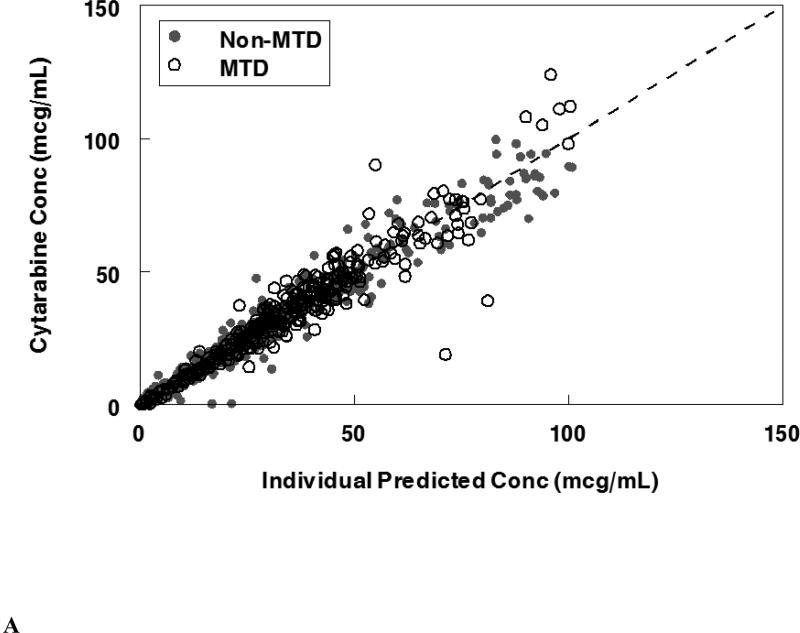
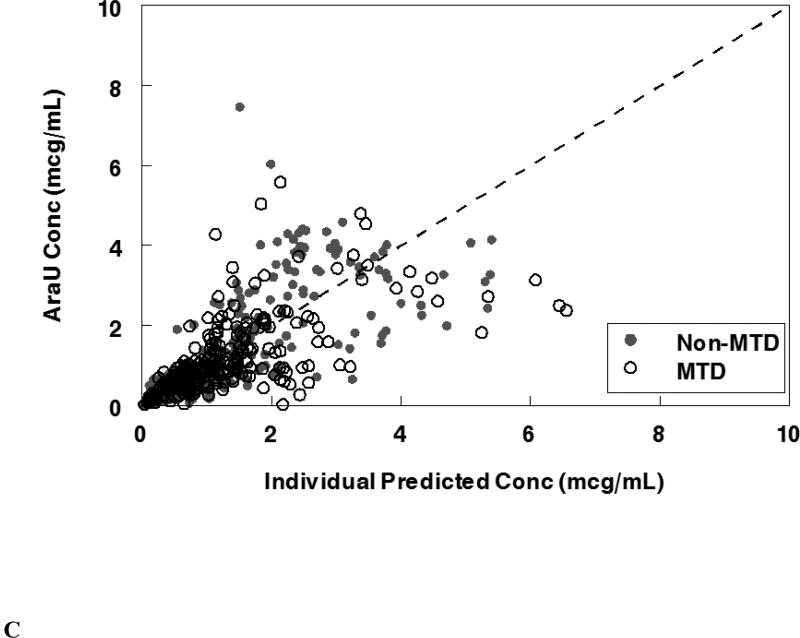
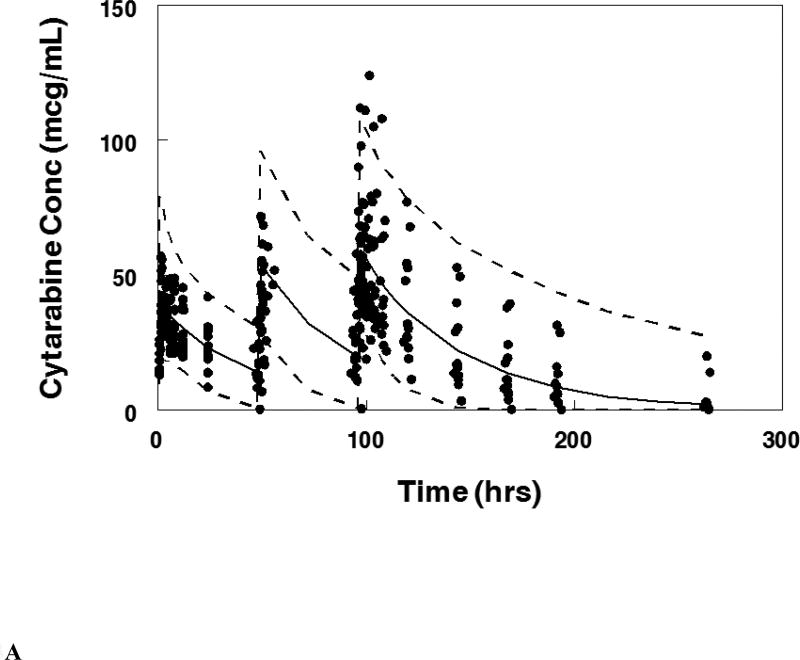
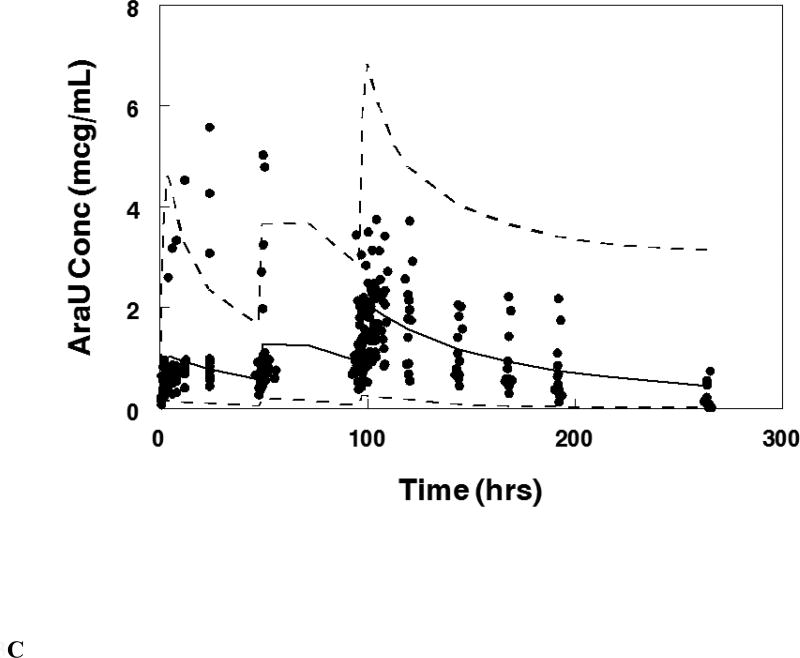
The final population pharmacokinetic model described the parent and metabolite compounds without significant bias as shown in Figures 2A, 2C (Supplemental Figures 1A, 1C, 2A, 2C). Shrinkage estimates for inter-subject variability were low: −0.23% (CL(P)12), 3.6% (CL(M)20) and 0.031% (V(P)1). Final model parameter and variance estimates are shown in Table 1. The final parameter estimates of the model fall well within the 95% confidence interval and are close in value to the median bootstrap estimates demonstrating that the final model represents the population well. Visual predictive plots (Figure 3A, 3C) with the results of the Monte Carlo simulation plotted data from patients receiving the maximal tolerable dose of 101 units/m2 demonstrate the vast majority of observed concentrations fell within the 2.5 to 97.5 percentiles of the simulated values although the model under-predicted early araU concentrations.
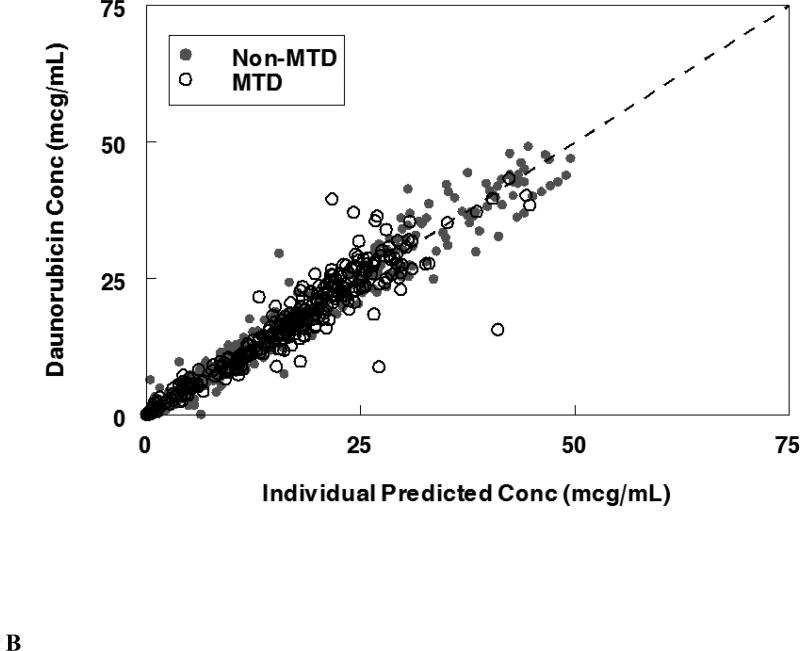
Figure 2.
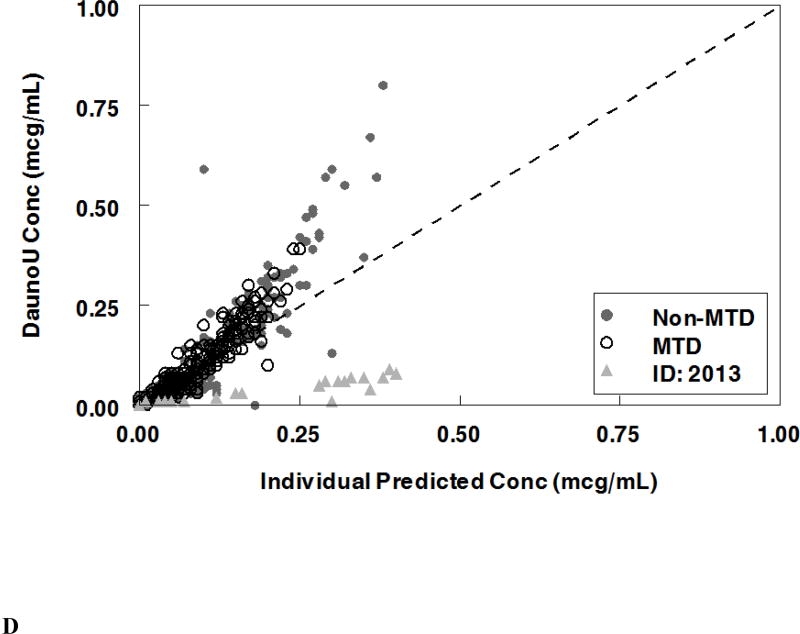
Population pharmacokinetic final model. Individual predictions were compared to observed concentrations in the study for: A. Liposomal cytarabine, B. Liposomal daunorubicin, C. Uracil arabinoside (araU, cytarabine metabolite), and D. Daunorubicinol (daunoU, daunorubicin metabolite). Open black circles represent the maximum tolerable dose of 101 units/m2 while other doses are represented by solid gray circles. One subject made minimal daunoU metabolite (ID: 2013) and was denoted by gray triangles.
Table 1.
Liposomal cytarabine, daunorubicin, and metabolite model: Final parameter, standard error, and median bootstrap estimates with 95% confidence intervals.
| Cytarabine | Parameter Estimates | Standard Error | Bootstrapa Median (95% CI) |
| CL(P)10 (L/hr) | 0b | - | - |
| CL(P)12 (L/hr) | 0.095 | 0.009 | 0.095 (0.079 – 0.114) |
| CL(M)20 (L/hr) | 1.73 | 0.24 | 1.74 (1.29 – 2.32) |
| Q(M) (L/hr) | 1.44 | 0.54 | 1.37 (0.036 – 4.06) |
| V(P)1 (L) | 4.86 | 0.27 | 4.87 (4.34 – 5.45) |
| V(M)2 (L) | 2.15 | 0.78 | 2.26 (0.5 – 4.23) |
| V(M)3 (L) | 115.9c | - | - |
| Weight on V(P)1 | 0.70d | 0.12 | 0.70 (0.41 – 0.64) |
| Variability | |||
| ETA1 (CL(P)12) | 52.4% | 6.3% | 50.8% (40.2% – 64.3%) |
| ETA2 (CL(M)20) | 113.6% | 12.5% | 109.1% (72.2% – 146.2%) |
| ETA3 (V(P)1) | 36.7% | 7.8% | 35.2% (19.7% – 50.6%) |
| Error | |||
| EPS1 (Proportional Parent) | 16.0% | 1.1% | 16.1% (14.0% – 18.5%) |
| EPS2 (Proportional Metabolite) | 51.5% | 3.7% | 50.6% (43.2% – 56.7%) |
| EPS3 (Additive Parent) | 1.1 | 0.29 | 1.12 (0.54 – 1.83) |
| Daunorubicin | Parameter Estimates | Standard Error | Bootstrape Median (95% CI) |
| CL(P)10 (L/hr) | 0b | - | - |
| CL(P)12 (L/hr) | 0.109 | 0.0079 | 0.109 (0.094 – 0.128) |
| CL(M)20 (L/hr) | 8.20 | 1.83 | 7.77 (4.53 – 13.565) |
| Q(M) (L/hr) | 3.74 (Fixed) | - | - |
| V(P)1 (L) | 3.65 | 0.153 | 3.65 (3.32 – 3.97) |
| V(M)2 (L) | 440 | 79.5 | 444.5 (329 – 670) |
| V(M)3 (L) | 591f | - | - |
| Weight on V(P)1 | 0.705g | 0.095 | 0.71 (0.51 – 0.93) |
| Variability | |||
| ETA1 (CL(P)12) | 44.4% | 4.3% | 45.5% (35.8% – 61.9%) |
| ETA2 (CL(M)20) | 157.5% | 32.2% | 162.8% (107.7% – 229.3%) |
| ETA3 (V(P)1) | 24.1% | 5.6% | 24.1% (13.3% – 36.5%) |
| Error | |||
| EPS1 (Proportional Parent) | 15.03% | 1.75% | 15.9% (11.8% – 25.7%) |
| EPS2 (Proportional Metabolite) | 55.50% | 12.60% | 53.6% (28.6% – 77.0%) |
| EPS3 (Additive Parent) | 0.84 | 0.24 | 0.68 (0.006 – 1.23) |
| EPS4 (Additive Metabolite) | 0.0034 | 0.000054 | 0.0036 (0.0025 – 0.0046) |
Bootstrap evaluation of the final cytarabine model had an 86% convergence rate.
Clearance of parent independent of the major pathway (CL(P)10) was fixed to 0.
VSS(M)= V(M)2 + V(M)3 was fixed to 118 L.
Weight (WTKG) was an independent predictor of liposomal volume: (WTKG/76)0.7.
Bootstrap evaluation of the final daunorubicin model had a 99% convergence rate.
VSS(M)= V(M)2 + V(M)3 was fixed to 1031 L.
Weight (WTKG) was an independent predictor of liposomal volume: (WTKG/76)0.705.
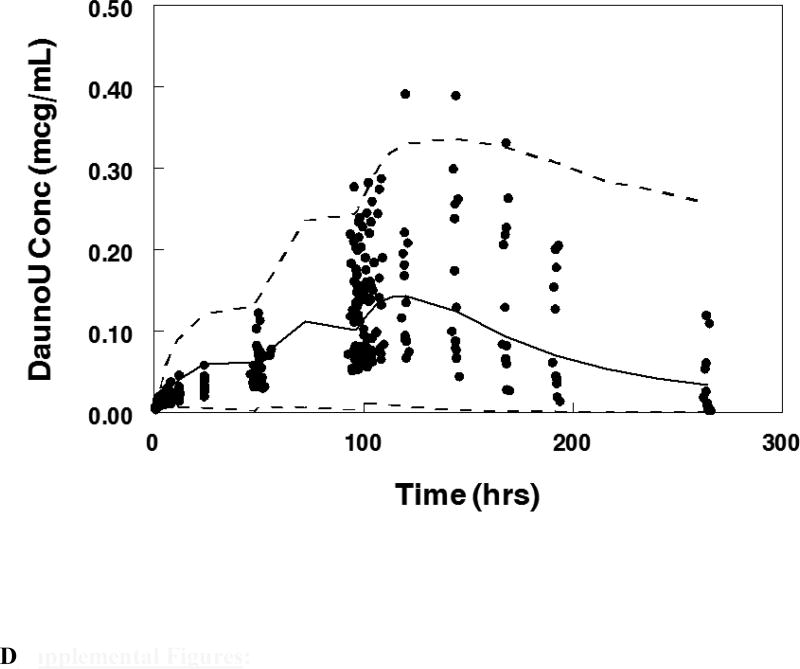
Figure 3.
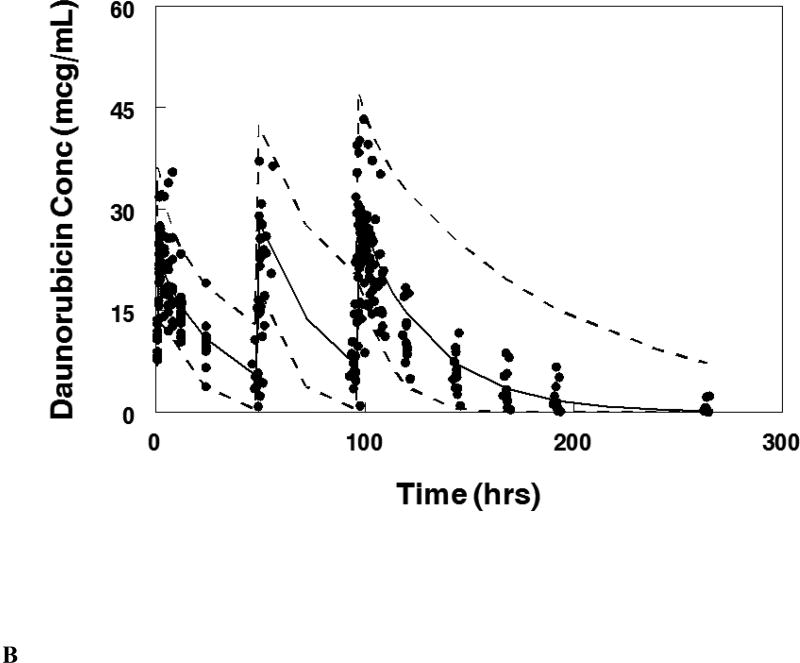
Visual predictive plot for the population pharmacokinetic model with concentration data from patients treated on the maximum tolerable dose of 101 units/m2 for: A. Cytarabine, B. Daunorubicin, C.Uracil arabinoside (araU, cytarabine metabolite), and D. Daunorubicinol (daunoU, daunorubicin metabolite). Solid line represents median and dashed lines represent the 2.5 and 97.5 percentiles from the Monte Carlo simulation of the final model.
Liposomal cytarabine had a terminal half-life of 33.5 hr as compared to the published non-liposomal value of 3.0 hr13. The typical AUC for the maximum tolerated dose of 101 units/m2 (101 mg/m2 cytarabine) as 1980.8 mcg*hr/mL approximately 3000 fold higher than published non-liposomal values14. V(P)1 was 4.59 L as compared to the published value of 138.2 L for the non-liposomal formulation14.
Daunorubicin population pharmacokinetic model
The univariate screen identified weight on V(P)1 and V(M)3, SCR on V(P)1 and CL(P)12, and gender on V(P)1 as potential covariates, however the multivariate screen only identified weight as independent predictors of V(P)1 and the V(M)3. Inter-subject variability was assessed on CL(P)12, metabolite clearance (CL(M)20), and V(P)1. Separate residual error terms were assigned to parent and metabolite concentrations. During the bootstrap model validation the weight covariate assessment on the metabolite volume (V(M)3) had a 95% confidence interval including zero indicating a non-significant impact. Therefore weight as a covariate on the metabolite volume was removed from the final model. The final pharmacokinetic model had linear weight as an independent predictor of V(P)1.
The final population pharmacokinetic model described the parent compound without significant bias as shown in Figure 2B (Supplemental Figures 1B, 2B). The model under-predicted daunoU concentrations at early time points (Supplemental Figures 2D), but otherwise did not have significant bias (Figure 2D, Supplemental Figure 1D). In addition, one patient at the maximum tolerable dose made minimal metabolite (Figure 2D). Shrinkage estimates for inter-subject variability were low: 1.4% (CL(P)12), 6.2% (CL(M)20) and 3.1% (V(P)1). Final model parameter and variance estimates are shown in Table 1. The final parameter estimates of the model fall well within the 95% confidence interval and are close in value to the median bootstrap estimates demonstrating that the final model represents the population well. Visual predictive plots (Figure 3B, 3D) with the results of the Monte Carlo simulation plotted data from patients receiving the maximal tolerable dose of 101 units/m2 demonstrate the vast majority of observed concentrations fell within the 2.5 to 97.5 percentiles of the simulated values although the model under-predicted early daunoU concentrations.
Liposomal daunorubicin had a terminal half-life of 22.0 hr as compared to the published non-liposomal value of 18.5 hr15. The typical AUC for the maximum tolerated dose of 101 units/m2 (44 mg/m2 daunorubicin) was 761.8 mcg*hr/mL approximately 1,250 fold higher than published non-liposomal values14. V(P)1 was 3.44 L as compared to the published value of 1364 L for the non-liposomal formulation14. There was a very high correlation between cytarabine and daunorubicin CL(P)12 (r2 =0.82).
Complete remission (CR) after first induction was achieved in 21% of patients (8 out of 39). Despite the large dose and AUC ranges (60.3 – 4892.2 cytarabine, 29.1 – 1569.9 daunorubicin mcg*hr/mL), no significant differences were present between the achievement of complete remission and AUC for cytarabine (p=0.37) or daunorubicin (p=0.26).
DISCUSSION
The induction therapy regimen for a medically fit AML patient of inpatient cytarabine with daunorubicin or idarubicin has been standard since 1990, however ongoing research and clinical trials has led to four new drug approvals in 2017.Gemtuzumab ozogamcin, a CD33 antibody-conjugate previously approved for salvage therapy then subsequently withdrawn from the market in 2010, received repeat approval for newly diagnosed or relapsed AML in combination with cytarabine and daunorubicin or as a single agent16. Midostaurin was approved for patients with FLT3-positive disease in combination with cytarabine and daunorubicin17 and enasidenib was approved for relapsed or refractory disease with IDH2 mutations18. While these three drugs explored novel mechanisms to combat AML, CPX-351 is the fourth FDA-approval in 2017 and represents a novel formulation which attempted to improve pharmacologic properties of two classic drugs for newly diagnosed therapy-related AML or AML with myelodysplasia-related changes9. CPX-351 is a liposomal formulation that prolongs cytarabine and daunorubicin release and systemic exposure.
Prior pharmacokinetic assessments of non-liposomal cytarabine and daunorubicin demonstrated large differences in clearance, volume of distribution, and half-life. However, the liposomal formulation CPX-351 has the potential to mute these differences and maintain a fixed ratio of cytarabine and daunorubicin over the course of induction and consolidation therapy. Population PK modeling of non-liposomal combination therapy demonstrated a clearance of 272 vs. 129 L/hr with a volume of distribution of 138 vs. 1364 L for cytarabine and daunorubicin, respectively14. Other publications have cited a half-life of 3 hours for cytarabine13 as compared to 18.5 hrs for daunorubicin15. Although the current phase I study did not have a comparator arm with conventional dosing, the CPX-351 liposomal formulation pharmacokinetics differed dramatically from previously published conventional cytarabine and daunorubicin dosing results. The novel liposomal cytarabine and daunorubicin formulation had overall lower clearance and smaller volumes of distribution with similar and well correlated clearance between the two drugs. The liposomal half-life of cytarabine was 33.5 hrs and 22.0 hrs for daunorubucin. The liposomal formulation has more than a 1000-fold reduction in clearance and a significant reduction (1000-fold daunorubicin, 30-fold cytarabine) in volume of distribution resulting in dramatically increased exposures. In addition, liposomal cytarabine and daunorubicin clearances were highly correlated in plasma providing additional evidence that the majority of the drugs remain encapsulated in the liposome. This is consistent with prior non-compartmental analyses of the current data set showing cytarabine and daunorubicin ratios remained approximately constant over time supporting persistence in the liposome despite intrinsically different half -lives of the non-encapsulated drugs19.
Limited sub-population analyses demonstrated that volume of the parent was significantly affected by weight as would be expected for a compound predominantly restricted to the intravascular space such as a liposome. However, no other significant covariates were seen. We saw no evidence of PK alterations based on renal or hepatic function, although this study did not enroll subjects with moderate to severe organ dysfunction (maximum serum creatinine 1.6, total bilirubin 1.8). Thus while no dosing modification based on mild renal or hepatic dysfunction is required, a full assessment of renal and hepatic disease is limited by the range of organ dysfunction in this study.
Overall the PK model described the parent data well. While initial daunoU and araU levels were under-predicted with the first two doses of CPX-351, this occurred within the first 50 hrs which has a limited contribution to the total AUC given the long half-life of the liposomal formulation. Later metabolite concentrations were well-described by the PK model. One subject (ID 2013) made minimal daunoU metabolite, thus drug concentrations were not described well by the metabolite model. There is some evidence that alterations in enzymes of metabolism, including flavin-containing monooxygenase (FMO), glutathione-S transferase (GSTP1), and P450 oxidoreductase (POR) polymorphisms20, 21, may lead to decreased clearance and increased toxicity. It is may be possible that this patient had a metabolic variant which led to poor generation of metabolite. Given that daunoU is an active metabolite, having additional subjects who make minimal metabolite would be helpful to develop a more comprehensive model.
Prior studies exploring high dose (90 mg/m2) vs. standard dose (45 mg/m2) daunorubicin for induction therapy showed improvement in complete response rates and overall survival22. In contrast, high-dose cytarabine (1000 mg/m2 BID daily for 5 days) gave similar outcomes with increased non-hematologic toxicity along with delayed neutrophil and platelet recovery, as compared to standard induction doses (200 mg/m2 daily for 7 days)23. In the current study, higher exposures did not lead to an increased number of complete remissions, but the percentage of complete remissions was low which likely limited the ability to find a difference in response.
Randomized phase III results demonstrated significantly improved response rates, survival, and 60 day mortality with similar grade III-V non-hematologic toxicity9, 24. However, Phase II and III studies with the maximum tolerable dose of CPX-351, conducted after the current phase I data set was complete, demonstrated an increased time to platelet recovery of 8–11 days and neutrophil recovery of 4–8 days compared to standard induction therapy7, 8, 24. The phase II data also demonstrated that complete response with incomplete blood count recovery (CRi) led to similar survival as patients with CR which differs from outcomes seen in standard induction chemotherapy7. This is likely secondary to the prolonged cytopenias observed rather than the presence of residual leukemia. Although CPX-351 exposure was higher, cytarabine and daunorubicin are predominantly encapsulated and protected from certain tissues sites. Thus the liposomal formulation results in prolonged exposure to low levels of free drug over time which may lead to slower recovery of cytopenias, but contributed to increased survival and response rates without increased non-hematologic toxicity. The liposome may also be taken up by bone marrow cells directly which can contribute to the prolonged cytopenias.
While liposomal formulations are increasingly being pursued to decrease toxicity and prolong exposure, there is limited experience in oncology with combination liposomal therapy. CPX-351 encapsulates two drugs to maintain a fixed ratio of the drugs over an extended interval. The improved pharmacokinetics of this formulation may simplify treatment regimens. Standard induction therapy involves 7 days of continuous infusion. In contrast, CPX-351 infusions are only 90 minutes and are administered only three times (days 1, 3, and 5) which may allow for outpatient delivery and monitoring.
In conclusion, the current PK model of cytarabine, daunorubicin, and their metabolites following administration of the liposomal formulation CPX-351 strongly suggests drug persists in liposomes after administration. It provides extended exposure of both cytarabine and daunorubicin likely contributing to the improved overall survival without enhanced non-hematologic toxicity observed in the current phase III clinical trial. CPX-351 has the potential to simplify dosing regimens, allow for outpatient therapy, and ultimately lead to improved AML treatment outcomes.
Supplementary Material
Supplemental Figure 1: Population pharmacokinetic final model. Population predictions were compared to observed concentrations in the study for: A. Liposomal cytarabine, B. Liposomal daunorubicin, C. Uracil arabinoside (araU, cytarabine metabolite), and D. Daunorubicinol (daunoU, daunorubicin metabolite). Open black circles represent the maximum tolerable dose of 101 units/m2 while other doses are represented by solid gray circles.
Supplemental Figure 2: Population pharmacokinetic final model. Conditional weight residuals were compared to time for: A. Liposomal cytarabine, B. Liposomal daunorubicin, C. Uracil arabinoside (araU, cytarabine metabolite), and D. Daunorubicinol (daunoU, daunorubicin metabolite). Open black circles represent the maximum tolerable dose of 101 units/m2 while other doses are represented by solid gray circles.
Acknowledgments
The phase 1 clinical trial was funded by Celator Pharmaceuticals, Inc., a subsidiary of Jazz Pharmaceuticals, plc. Dr. Nikanjam received salary support from a National Institutes of Health grant (4T32HL066992 – Academic Training in Hematology) and a Tower Cancer Research Foundation Career Development Award. Additional funding support was provided by a Research in Pediatric and Developmental Pharmacology NIH grant (1U54HD090259-01, Dr. Capparelli) and the Aramont Foundation for the study of Hematological Malignancies (Dr. Schiller).
Conflicts of Interest:
Dr. Capparelli serves on the data safety and monitoring board for Cempra Pharmaceuticals and The Medicines Company and has received consulting fees from Aptose, Plexxikon, Atox Bio Ltd, Celltrion, and Patara. Dr. Schiller has received research funding from Celator Pharmaceuticals. Dr. Louie is employed by Celator Pharmaceuticals.
Footnotes
Ethical approval:
All procedures performed in studies involving human participants were in accordance with the ethical standards of the institutional and/or national research committee and with the 1964 Helsinki declaration and its later amendments or comparable ethical standards.
References
- 1.Cashen A, VanTine BA. Hematology and Oncology Subspecialty Consult. Third. Philadelphia, PA: Lippincott, Williams, and Wilkins; 2012. [Google Scholar]
- 2.Dohner H, Weisdorf DJ, Bloomfield CD. Acute Myeloid Leukemia. N Engl J Med. 2015;373:1136–1152. doi: 10.1056/NEJMra1406184. [DOI] [PubMed] [Google Scholar]
- 3.Rahman AM, Yusuf SW, Ewer MS. Anthracycline-induced cardiotoxicity and the cardiac-sparing effect of liposomal formulation. Int J Nanomedicine. 2007;2:567–583. [PMC free article] [PubMed] [Google Scholar]
- 4.Drummond DC, Meyer O, Hong K, et al. Optimizing liposomes for delivery of chemotherapeutic agents to solid tumors. Pharmacol Rev. 1999;51:691–743. [PubMed] [Google Scholar]
- 5.Mayer LD, Harasym TO, Tardi PG, et al. Ratiometric dosing of anticancer drug combinations: controlling drug ratios after systemic administration regulates therapeutic activity in tumor-bearing mice. Mol Cancer Ther. 2006;5:1854–1863. doi: 10.1158/1535-7163.MCT-06-0118. [DOI] [PubMed] [Google Scholar]
- 6.Tardi P, Johnstone S, Harasym N, et al. In vivo maintenance of synergistic cytarabine:daunorubicin ratios greatly enhances therapeutic efficacy. Leuk Res. 2009;33:129–139. doi: 10.1016/j.leukres.2008.06.028. [DOI] [PubMed] [Google Scholar]
- 7.Lancet JE, Cortes JE, Hogge DE, et al. Phase 2 trial of CPX-351, a fixed 5:1 molar ratio of cytarabine/daunorubicin, vs cytarabine/daunorubicin in older adults with untreated AML. Blood. 2014;123:3239–3246. doi: 10.1182/blood-2013-12-540971. [DOI] [PMC free article] [PubMed] [Google Scholar]
- 8.Cortes JE, Goldberg SL, Feldman EJ, et al. Phase II, multicenter, randomized trial of CPX-351 (cytarabine:daunorubicin) liposome injection versus intensive salvage therapy in adults with first relapse AML. Cancer. 2015;121:234–242. doi: 10.1002/cncr.28974. [DOI] [PMC free article] [PubMed] [Google Scholar]
- 9.VYXEOS™ (daunorubicin and cytarabine) liposome for injection, for intravenous use. [Accessed October 21, 2017];2017 Aug; https://www.accessdata.fda.gov/drugsatfda_docs/label/2017/209401s000lbl.pdf.
- 10.Feldman EJ, Lancet JE, Kolitz JE, et al. First-in-man study of CPX-351: a liposomal carrier containing cytarabine and daunorubicin in a fixed 5:1 molar ratio for the treatment of relapsed and refractory acute myeloid leukemia. J Clin Oncol. 2011;29:979–985. doi: 10.1200/JCO.2010.30.5961. [DOI] [PMC free article] [PubMed] [Google Scholar]
- 11.Radeski D, Cull GM, Cain M, et al. Effective clearance of Ara-U the major metabolite of cytosine arabinoside (Ara-C) by hemodialysis in a patient with lymphoma and end-stage renal failure. Cancer Chemother Pharmacol. 2011;67:765–768. doi: 10.1007/s00280-010-1373-2. [DOI] [PubMed] [Google Scholar]
- 12.Galettis P. Daunorubicin Kinetics and Drug Resistance in Leukaemia. University of Technology; Sydney: 1996. [Google Scholar]
- 13.Koren G, Beatty K, Seto A, et al. The effects of impaired liver function on the elimination of antineoplastic agents. Ann Pharmacother. 1992;26:363–371. doi: 10.1177/106002809202600311. [DOI] [PubMed] [Google Scholar]
- 14.Krogh-Madsen M, Bender B, Jensen MK, et al. Population pharmacokinetics of cytarabine, etoposide, and daunorubicin in the treatment for acute myeloid leukemia. Cancer Chemother Pharmacol. 2012;69:1155–1163. doi: 10.1007/s00280-011-1800-z. [DOI] [PubMed] [Google Scholar]
- 15.Daunorubicin Hydrochloride Injection. [Accessed October 21, 2017];2013 Jun; http://docs.boehringer-ingelheim.com/Prescribing%20Information/PIs/Ben%20Venue_Bedford%20Labs/55390-108-01%20DNOP_AQ%2020mg/5539010801.
- 16.Gemtuzumab ozogamicin package insert. [Accessed October 21, 2017];2017 Sep; https://www.accessdata.fda.gov/drugsatfda_docs/label/2017/761060lbl.pdf.
- 17.Midostaurin Package Insert. [Accessed October 21, 2017];2017 Aug; https://www.accessdata.fda.gov/drugsatfda_docs/label/2017/207997s000lbl.pdf.
- 18.Enasidenib Package Insert. [Accessed October 21, 2017];2017 Aug; https://www.accessdata.fda.gov/drugsatfda_docs/nda/2017/209606Orig1s000Lbl.pdf.
- 19.Feldman EJ, Kolitz JE, Trang JM, et al. Pharmacokinetics of CPX-351; a nano-scale liposomal fixed molar ratio formulation of cytarabine:daunorubicin, in patients with advanced leukemia. Leuk Res. 2012;36:1283–1289. doi: 10.1016/j.leukres.2012.07.006. [DOI] [PubMed] [Google Scholar]
- 20.Thompson P, Wheeler HE, Delaney SM, et al. Pharmacokinetics and pharmacogenomics of daunorubicin in children: a report from the Children's Oncology Group. Cancer Chemother Pharmacol. 2014;74:831–838. doi: 10.1007/s00280-014-2535-4. [DOI] [PMC free article] [PubMed] [Google Scholar]
- 21.Lubieniecka JM, Graham J, Heffner D, et al. A discovery study of daunorubicin induced cardiotoxicity in a sample of acute myeloid leukemia patients prioritizes P450 oxidoreductase polymorphisms as a potential risk factor. Front Genet. 2013;4:231. doi: 10.3389/fgene.2013.00231. [DOI] [PMC free article] [PubMed] [Google Scholar]
- 22.Fernandez HF, Sun Z, Yao X, et al. Anthracycline dose intensification in acute myeloid leukemia. N Engl J Med. 2009;361:1249–1259. doi: 10.1056/NEJMoa0904544. [DOI] [PMC free article] [PubMed] [Google Scholar]
- 23.Lowenberg B, Pabst T, Vellenga E, et al. Cytarabine dose for acute myeloid leukemia. N Engl J Med. 2011;364:1027–1036. doi: 10.1056/NEJMoa1010222. [DOI] [PubMed] [Google Scholar]
- 24.Lancet JE, Uy GL, Cortes JE, et al. Final results of a phase III randomized trial of CPX-351 versus 7+3 in older patients with newly diagnosed high risk (secondary) AML. American Society of Clinical Oncology; Chicago, Illinois: 2016. [Google Scholar]
Associated Data
This section collects any data citations, data availability statements, or supplementary materials included in this article.
Supplementary Materials
Supplemental Figure 1: Population pharmacokinetic final model. Population predictions were compared to observed concentrations in the study for: A. Liposomal cytarabine, B. Liposomal daunorubicin, C. Uracil arabinoside (araU, cytarabine metabolite), and D. Daunorubicinol (daunoU, daunorubicin metabolite). Open black circles represent the maximum tolerable dose of 101 units/m2 while other doses are represented by solid gray circles.
Supplemental Figure 2: Population pharmacokinetic final model. Conditional weight residuals were compared to time for: A. Liposomal cytarabine, B. Liposomal daunorubicin, C. Uracil arabinoside (araU, cytarabine metabolite), and D. Daunorubicinol (daunoU, daunorubicin metabolite). Open black circles represent the maximum tolerable dose of 101 units/m2 while other doses are represented by solid gray circles.


