

Summary
Tumor hypoxia is associated with poor patient survival and is a characteristic of glioblastoma. Notch signaling is implicated in maintaining glioma stem-like cells (GSCs) within the hypoxic niche, although the molecular mechanisms linking hypoxia to Notch activation have not been clearly delineated. Here we show that Vasorin is a critical link between hypoxia and Notch signaling in GSCs. Vasorin is preferentially induced in GSCs by a HIF1α/STAT3 co-activator complex and stabilizes Notch1 protein at the cell membrane. This interaction prevents Numb from binding Notch1, thereby rescuing it from Numb-mediated lysosomal degradation. Thus, Vasorin acts as a switch to augment Notch signaling under hypoxic conditions. Vasorin promotes tumor growth and reduces survival in mouse models of glioblastoma and its expression correlates with increased aggression of human gliomas. These findings provide mechanistic insights into how hypoxia promotes Notch signaling in glioma and identify Vasorin as a potential therapeutic target.
Keywords: Vasorin, Notch, Numb, Glioma, Glioblastoma, Hypoxia, Pseudohypoxia, HIF1, HIF2, STAT3, Glioma stem-like cells
eTOC Blurb
Yu and colleagues show that hypoxia preferentially augments Notch signaling in glioma stem-like cells by inducing the HIF1/STAT3 target gene, Vasorin. Vasorin functions as a competitive inhibitor of Numb to reduce Notch turnover, thereby augmenting Notch signaling under hypoxic stress.
Introduction
Tumor hypoxia is consistently associated with poor survival across multiple cancer types. Glioblastoma (GBM) is the most deadly primary brain tumor and is characterized by areas of hypoxia (Keith and Simon, 2007; Semenza, 2004; Soeda et al., 2009). Glioma stem-like cells (GSCs) or tumor initiating cells are an aggressive population of cancer cells that display a high capacity for self-renewal and therapeutic resistance and have been implicated in disease progression (Bao et al., 2006; Bleau et al., 2009; Chen et al., 2012; Singh et al., 2004). GSCs often reside in a hypoxic niche that supports their undifferentiated state (Li et al., 2009b; Qiang et al., 2012; Seidel et al., 2010), but the underlying molecular mechanisms are unclear.
The hypoxia-inducible factor (HIF) proteins direct cellular responses to hypoxia. The HIF proteins form a heterodimeric complex consisting of an oxygen-sensitive α subunit and a constitutively expressed β subunit (Harris, 2002; Keith and Simon, 2007). Two HIFα proteins, HIF1α and HIF2α, are stabilized in low oxygen tension and dimerize with HIF1β to control the transcription of multiple target genes. Although they bind to similar hypoxia-responsive elements (HREs), HIF1α and HIF2α have discrete, non-overlapping roles due to their different target genes (Hu et al., 2003). HIF2α has garnered much attention as it is preferentially induced by hypoxia in GSCs, whereas hypoxia induces HIF1α in both GSC and their counterpart non-stem-like tumor cells (non-GSCs) (Li et al., 2009b). The contribution of HIF1 proteins to the selective expression of target genes in GSCs is unclear.
We recently reported that the HIF1α-regulated protein Vasorin is induced by hypoxia and frequently overexpressed in human GBM (Choksi et al., 2011). The function of Vasorin includes abrogation of TNF-mediated apoptosis (Choksi et al., 2011) and inhibition of TGFβ signaling (Ikeda et al., 2004; Malapeira et al., 2011) but is not fully understood. Through a screen for interacting proteins, we found that Vasorin binds to Notch1 to regulate its expression on the cell membrane and therefore calibrate Notch pathway activation.
The Notch pathway is highly conserved and orchestrates organogenesis and tissue homeostasis (Bray, 2006). Notch activation is tightly regulated through post-translational modifications and a series of proteolytic cleavages (Flores et al., 2014; Kandachar and Roegiers, 2012). Notch is first cleaved within the Golgi by Furin protease. Heterodimeric Notch then traffics to the cell membrane where it can bind to Delta/Serrate/Lag2 (DSL) family ligands on adjacent cells. Upon ligand binding, Notch undergoes two additional proteolytic processing events, an extracellular cleavage by ADAM family proteases and an intramembranous cleavage by the γ-secretase complex to release the Notch intracellular domain (NICD). The NICD translocates to the nucleus where it binds the DNA binding protein CSL and coactivator complex to facilitate the transcription of target genes, including Hes/Hey family members. These in turn contribute to maintaining the stem cell program in several cell types (Bray, 2006; Ranganathan et al., 2011).
Membranous Notch levels and Notch activation are tightly regulated by the endocytic cycle (Le Borgne et al., 2005; Miele, 2006; Ranganathan et al., 2011). Notch is internalized and recycled to the cell membrane or targeted for ubiquitylation and degradation in lysosomes (Le Borgne et al., 2005; Moretti and Brou, 2013). Numb is an adaptor protein that inhibits Notch signaling. The mechanisms by which Numb antagonizes Notch signaling are unclear but ultimately lead to Notch degradation. One theory is that Numb promotes the endocytosis of membranous Notch through α-adaptin and adaptor protein 2 (AP-2) (Kandachar and Roegiers, 2012). Another theory proposes that Numb reduces recycling of internalized Notch to the cell membrane (Kandachar and Roegiers, 2012). Numb serves as a scaffold for Itch family E3 ubiquitin ligases that target Notch for degradation by the lysosome (McGill et al., 2009; Santolini et al., 2000). However, molecular mechanisms governing Numb-Notch interaction and Notch turnover are unclear.
Notch activity is frequently upregulated in GSCs (Purow et al., 2008; Qiang et al., 2012; Wang et al., 2010; Zhu et al., 2011) and has been implicated in regulating stem cell properties under hypoxic conditions (Charles et al., 2010; Gustafsson et al., 2005; Kim et al., 2009; Qiang et al., 2012). While NICD stability can be regulated by hypoxia (Qiang et al., 2012), the mechanisms governing Notch stability before proteolytic processing are unclear. Here, we reveal that Vasorin is differentially induced in GSCs under hypoxic conditions by a HIF1α/STAT3 co-activator complex. Vasorin binds to and stabilizes Notch1 at the cell membrane by blocking Numb-mediated ubiquitylation and lysosomal degradation. Silencing Vasorin reduced Notch signaling in GSCs and improved survival in mouse models of GBM. In human GBM, Vasorin was overexpressed in hypoxic regions and correlated with increased Notch activation. Taken together, these data identify Vasorin as a key regulator of Notch signaling in GSCs in the hypoxic niche.
Results
Vasorin Expression Correlates With Glioma Aggressiveness
Vasorin was initially identified as a HIF1 target gene that is frequently over-expressed in human GBM (Choksi et al., 2011). To assess the role of Vasorin in glioma, we first queried the TCGA diffuse glioma database. Vasorin expression was elevated in GBM compared to low grade gliomas (Figure 1A). Gliomas have been categorized into two main groups based on isocitrate dehydrogenase (IDH) mutational status (Ceccarelli et al., 2016). Patients with IDH mutant gliomas have a favorable prognosis compared to patients with wild-type (wt) IDH tumors (Eckel-Passow et al., 2015; Noushmehr et al., 2010). We found that Vasorin expression was higher in IDH1 wild-type gliomas compared to IDH1 mutant gliomas (Figure 1B). Additionally, in the IDH1 wild-type subset of gliomas, Vasorin expression correlated with poor patient survival (Figure 1C). Subset analysis of Vasorin expression in IDH1 wild-type GBM was not of prognostic significance (not shown). The number of IDH1 mutant GBM was too limited to analyze (not shown).
Figure 1. Vasorin Is Expressed in Aggressive Gliomas.

(A) Boxplot of Vasorin expression in low grade gliomas (LGG) and glioblastoma (GBM) from the TCGA diffuse glioma database. Significance testing by Mann-Whitney U test.
(B) Boxplot of Vasorin expression in IDH1 wild-type (WT) and IDH1 mutant glioblastomas from the TCGA GBM database. Significance testing by Mann-Whitney U test.
(C) Kaplan-Meier survival analysis of patients with IDH1 wt gliomas stratified by Vasorin expression. Median Vasorin expression was used for stratification into Vasorin high and Vasorin low tumors.
(D) Immunohistochemical staining of Vasorin in normal brain and GBM. Representative images are shown.
(E) Table of tumor type and Vasorin expression in gliomas and normal brain. The fraction and percent of Vasorin positive tumors or normal brain are shown.
Immunohistochemical analysis of Vasorin expression in 68 glioma specimens ranging from grade 1 (n=5) and grade 2 (n=18) astrocytoma, glioblastoma (n=32), oligoastrocytoma (n=4) and oligodendroglioma (n=9) showed increased Vasorin expression in higher grade tumors (Figures 1D and 1E). Whereas only 20% of grade I astrocytomas stained positively for Vasorin, 81.5% of GBM were Vasorin-positive. About half of grade II astrocytomas, oligoastrocytomas and oligodendrogliomas were positive for Vasorin expression. Together, these data suggest that Vasorin expression is increased in more aggressive gliomas.
Vasorin is Preferentially Induced by Hypoxia in Glioma Stem-like Cells
To assess the regulation of Vasorin by hypoxia in GBM, we examined the expression of Vasorin and HIF1α or carbonic anhydrase 9 (CA9) in a panel of 10 human GBM. CA9 is a HIF1 target gene that is frequently used as a marker of hypoxia (Hoogsteen et al., 2009; Lau et al., 2007; Wilson and Hay, 2011). Because GSCs are enriched in hypoxic niches, and tumor hypoxia maintains the stem cell phenotype (Bar et al., 2010; Seidel et al., 2010; Soeda et al., 2009), we also stained these GBM specimens for 5 different putative stem cell markers including Olig2, Sox2, CD44 (Pietras et al., 2014), CD133 (Bao et al., 2006; Singh et al., 2004) and SSEA1 (Son et al., 2009). Vasorin was highly expressed in HIF1α-positive and CA9-positive tumor cells that also expressed stem cell markers (Figure 2A and Figure S1A). These data demonstrate that stem-cell marker positive cells are enriched in hypoxic areas and suggest that Vasorin is expressed in these putative stem-like cells.
Figure 2. Vasorin is Induced by Hypoxia in Glioma Stem-like Cells.

(A) Immunofluorescent (IF) staining of Vasorin (purple), putative stem cell marker (Olig2, CD133, or Sox2; green) and hypoxia marker (HIF1α or CA9; red) in human GBM. Nuclei were counterstained with DAPI (blue). Representative images are shown. Scale bar measures 10µm.
(B) IF staining of Vasorin (purple), CD44 (green) and endothelial marker CD31 (red) in human GBM. Nuclei were counterstained with DAPI (blue). Representative images are shown. Scale bar measures 25µm.
(C) IF staining of Vasorin (purple), CA9 (red) and CD31 (green) in human GBM. Nuclei were counterstained with DAPI (blue). Representative images are shown. Scale bar measures 25µm.
(D) Matched non-GSCs and GSCs (line 4121) were cultured in standard conditions or hypoxia (1% O2) for the indicated amount of time. Expression of Vasorin and HIF proteins was assessed by immunoblot.
(E) Five matched non-GSC and GSC pairs were cultured in standard conditions or hypoxia (1% O2) for 24 hrs. Vasorin mRNA expression was analyzed by qRT-PCR.
* p < 0.05; ** p < 0.01; *** p<0.001; NS, not significant Data are represented as mean ± SD. See also Figure S1–S2.
In addition to hypoxic areas, GSCs are also found in perivascular niches (Calabrese et al., 2007). These GSCs are maintained in part through CD44/HIF2-dependent signaling (Pietras et al., 2014). To assess the possibility that GSCs are maintained through different mechanisms in the hypoxic and perivascular niches, we assessed Vasorin, CD44, CA9 and the endothelial marker CD31 in 2 human GBM specimens. Consistent with prior reports, CD44-positive cells were preferentially located in the perivascular areas (Figure 2B). Interestingly, we found that some cells in the perivascular niche were also CA9-positive (Figure 2C), suggesting activation of HIF1. This could be due to hypoxia secondary to a thrombus occluding the vessel proximally or from pseudohypoxia (Denko, 2008). Vasorin was expressed in a subset of CD44-positive cells (Figure 2B) and CA9-positive cells (Figure 2C), suggesting that Vasorin may also contribute to the maintenance of HIF1-activated perivascular GSCs.
We then assessed expression of Vasorin and hypoxia response genes, as defined by Patel et al. (Patel et al., 2014) and the hypoxia gene ontology group. Vasorin expression correlated with expression of multiple hypoxia response genes, including CA9, VEGFA, LDHA, PDK1 and PGK1 in the TCGA glioma database (Ceccarelli et al., 2016) (Figure S2B), supporting induction of Vasorin by hypoxia. To further study hypoxic regulation of Vasorin, we used GSCs carrying a hypoxia reporter gene (HRE-EGFP) in which enhanced green fluorescent protein (EGFP) was expressed under the regulation of a hypoxia response element promoter (Moeller et al., 2004; Raman et al., 2006). We established orthotopic xenografts using two different GSC lines (4121 and 387). In these tumors, HRE-EGFP expression co-localized with CA9 (Figure S1C), indicating that the HRE-EGFP reporter appropriately labeled hypoxic tumor cells. Vasorin staining co-localized with EGFP and SOX2 (Figure S1D), and Vasorin staining was observed in perinecrotic tumor cells (Figure S1E), suggesting that Vasorin is expressed in the GSC population within the hypoxic niche.
We next assessed the expression of Vasorin in a panel of matched GSCs and non-GSCs derived from the same tumors. GSCs and non-GSCs were characterized by expression of stem cell markers (Olig2, Sox2, Nestin) or the differentiation marker GFAP (Figure S2A–B). GSCs and non-GSCs were further tested for their capacity to form tumorspheres (Figure S2C) and orthotopic tumors by in vitro and in vivo limiting dilution assays, respectively (Figure S2D–S2E). As expected, GSCs expressed stem-cell markers, lacked expression of GFAP and formed tumors in vivo more efficiently than their counterpart non-GSCs. Using these cells, we found that Vasorin expression was low but detectable under standard culture conditions and was induced more highly in GSCs compared to non-GSCs under hypoxic conditions (Figure 2D and 2E). Similarly, cells treated with the hypoxia mimic desferoxamine (DFX) (Hu et al., 2003) preferentially induced expression of Vasorin in GSCs (Figure S1F and S1G).
HIF1α/STAT3 Co-Activator Complex Induces Expression of Vasorin in GSCs
In GBM, expression of both HIF1α and HIF2α are induced by hypoxia (Li et al., 2009b; Seidel et al., 2010; Soeda et al., 2009) but the relative roles of these proteins in maintaining GSCs is controversial. To assess the role of the HIF proteins in regulating Vasorin, we silenced HIF1α and HIF2α using two different, non-overlapping small hairpin RNA (shRNA) sequences. Under hypoxic conditions, downregulation of HIF1α but not HIF2α diminished Vasorin expression in GSCs at the protein (Figure 3B, 3C, S3A) and mRNA levels (Figure 3E and S3C). This differential induction of Vasorin in GSCs by HIF1α was surprising because it was previously shown that HIF2α but not HIF1α is selectively induced by hypoxia in GSCs (Li et al., 2009b). Consistent with that report, we also found that HIF1α is induced in both GSCs and non-GSCs (Figure 2D). We hypothesized that additional transcription factors help to direct the selective expression of Vasorin in hypoxic GSCs. Signal transducer and activator of transcription 3 (STAT3) was shown to form a complex with HIF1α, but not HIF2α, to drive a unique set of target genes to drive tumorigenesis under hypoxic conditions (Pawlus et al., 2014; Pawlus et al., 2013). Because STAT3 is constitutively activated in GSCs (Guryanova et al., 2011; Sherry et al., 2009), we assessed the Vasorin promoter for STAT3 binding sites and found a putative binding site (Figure 3A). Knockdown of STAT3 significantly decreased the induction of Vasorin protein (Figure 3D and S3B) and mRNA expression (Figure 3F and S3D) under hypoxic conditions. Both HIF1α (Figure 3G and S3E) and STAT3 (Figure 3H and S3F) bound to the Vasorin promoter, as assessed by chromatin immunoprecipitation (ChIP). Additionally, STAT3 knockdown reduced HIF1α binding to the Vasorin promoter (Figure 3I and S3G). Together, these data suggest that both STAT3 and HIF1α are required for the selective expression of Vasorin in GSCs under hypoxic conditions.
Figure 3. A HIF1α/STAT3 Co-Activator Complex Induces Expression of Vasorin in GSCs.

(A) Cartoon of Vasorin promoter with 3 putative hypoxia response elements (HRE) and 1 STAT3 binding site.
(B–D) Immunblot (IB) of Vasorin in GSCs transduced with two different shRNA sequences targeting HIF1α (B), HIF2α (C) or STAT3 (D). GSCs were cultured in hypoxia (1% O2) for 48 hrs.
(E) qRT-PCR of HIF1α and Vasorin in GSCs transduced with shNT or shHIF1α and cultured in hypoxia for 48 hrs.
(F) qRT-PCR of STAT3 and Vasorin in GSCs transduced with shNT or shSTAT3 and cultured in hypoxia for 48 hrs.
(G–H) Chromatin IP (ChIP) analyses on the promoter of Vasorin. Assays were performed with the indicated antibodies and immunoprecipitates were subjected to qPCR analyses using primers flanking the HRE sites (G) or STAT3 binding motif (H). GSCs were cultured in hypoxia for 48 hrs.
(I) ChIP of HIF1α binding to the Vasorin promoter in GSCs cultured under hypoxia after STAT3 knockdown.
*p < 0.05; **p < 0.01, *** p < 0.001. Data are represented as mean ± SD. See also Figure S3.
Vasorin Maintains the Tumorigenic Potential of GSCs
To determine the function of Vasorin in GSCs, we first investigated the effect of Vasorin knockdown on GSC self-renewal by tumorsphere formation and in vitro limiting dilution assay, the standard in vitro assay to assess self-renewal capacity (Pastrana et al., 2011). Under hypoxic conditions, reduction of Vasorin expression significantly impaired tumorsphere formation (Figure 4A–4B, S4A), reduced the frequency of GSCs able to form tumorspheres (Figure 4C and S4B) and reduced GSC viability (Figure 4D). Vasorin knockdown reduced proliferation, as assessed by EdU incorporation (Figure 4E, S4E–S4F) and induced apoptosis of GSCs (Figure 4F and S4D). In contrast, Vasorin knockdown in non-GSCs had little impact on cell viability (Figure S4C).
Figure 4. Vasorin Promotes GSC Maintenance and Tumorigenesis.

(A) GSCs (4121 and 3691) were transduced with two different shVasorin sequences and cultured in hypoxia (1% O2) for 5 days and tumorsphere formation was assessed by bright field microscopy.
(B) Quantification of tumorspheres in 2 different GSC lines (4121 and 3691) in hypoxia after Vasorin knockdown.
(C) In vitro limiting dilution assay of GSCs expressing shNT or shVasorin cultured in hypoxia.
(D) Cell viability of GSC lines 4121 and 3691 after Vasorin knockdown and cultured in hypoxia.
(E) IF imaging (left) of EdU incorporation in GSC tumorspheres cultured under hypoxic conditions for 48 hrs. Quantification of the fraction of EdU+ cells (right).
(F) IB analysis of cleaved caspase3 and cleaved PARP proteins in GSCs with Vasorin knockdown cultured under hypoxic conditions.
(G–J) GSCs stably expressing luciferase were transduced with shNT or shVasorin through lentiviral infection and intracranially transplanted into the brains of nude mice (2×10⁴ cells per mouse). (G) Representative images of cross-sections (hematoxylin and eosin stained) of mouse brains 26 days after transplantation. (H) Apoptotic cells in GBM xenografts derived from GSCs expressing shNT or shVasorin were detected in situ using the TUNEL assay. Nuclei were counterstained with DAPI (blue). The apoptotic index was assessed by the ratio of TUNEL-positive cells / total number of cells from eight randomly selected fields. (I) GBM xenografts derived from luciferase-labeled GSCs expressing shNT or shVasorin were tracked by bioluminescence (right). Real-time images from animals on day 26 are shown (left). Error bars represent the mean ± SEM. (J) Kaplan-Meier survival curve of mice implanted with 4121 GSCs (n=6 for each group) or 3691 GSCs (n=8 for each group) expressing shNT or shVasorin. Significance testing by log rank test.
*p < 0.05; **p < 0.01; ***p < 0.001, ****p<0.0001
Data are represented as mean ± SD unless otherwise stated. See also Figure S4.
We next established orthotopic xenografts utilizing GSCs expressing a luciferase reporter gene and either nontargeting or Vasorin shRNA (shNT mice or shVasorin mice, respectively). When the first few shNT mice developed neurologic signs or clinically declined, a subset of mice in each group was sacrificed for histologic analysis. shNT mice developed large tumors that extended to both hemispheres. However, shVasorin mice were clinically asymptomatic and only small tumors were found on necropsy (Figure 4G). We then compared apoptosis in tumors from shNT and shVasorin mice. Consistent with the in vitro results (Figure 4F and S4D), tumors from shVasorin mice exhibited higher levels of apoptosis (Figure 4H). Longitudinal bioluminescence imaging of the mice revealed that Vasorin knockdown significantly impaired tumor growth (Figure 4I). This resulted in extended animal survival in two different orthotopic models of GBM (Figure 4J). By in vivo limiting dilution assay in both 4121 and 387 GSC xenograft models, shVasorin mice consistently survived longer than shNT mice (Figure S4G–S4H). Collectively, these data suggest that Vasorin is needed to maintain the hypoxic GSC population and promote tumor progression.
Vasorin Binds to Membranous Notch1 to Facilitate Notch1 Signaling
To determine how Vasorin might regulate GSC maintenance, we identified putative binding partners by immunoprecipitation of endogenous Vasorin in GSCs and performed mass spectrometry. Through this screen, we identified Notch proteins as candidate binding partners (Table S1). The Notch pathway promotes GSC self-renewal and tumorigenicity (Charles et al., 2010; Fan et al., 2010; Giachino et al., 2015; Liau et al., 2017; Ranganathan et al., 2011) and has been implicated in maintaining the undifferentiated state of stem cells under hypoxic conditions (Gustafsson et al., 2005). We verified interaction between Vasorin and Notch1 by co-immunoprecipitation with anti-Vasorin antibody and immunoblotting for endogenous Vasorin and membranous Notch1 (Notch1™) in three different GSC lines (Figure 5A). The reciprocal co-immunoprecipitation with anti-Notch1 antibody and blotting for Vasorin and Notch1™ further validated interactions between endogenous Vasorin and Notch1 (Figure 5B). Furthermore, silencing Vasorin significantly reduced Notch1™ levels and resulted in a decline in NICD1 levels (Figure 5C) and Notch target gene expression (Figure 5D). In contrast, interactions between Vasorin and Notch2 or Notch3 was weak (Figure S5A), and Vasorin knockdown caused little change in Notch2™ or Notch3™ levels (Figure S5B). We therefore continued analyses on the potential regulation of Notch1 by Vasorin.
Figure 5. Vasorin Binds to Membranous Notch1 to Facilitate Notch Signaling.

(A–B) Co-immunoprecipitation (Co-IP) of Vasorin (A) or Notch1 (B) in 3 different GSC lines (387, 3691 and 4121) and blotted for Notch1™ and Vasorin. IgG was used as a control antibody for IPs.
(C) IB of Notch1™, NICD1 and Vasorin in GSCs transduced with shNT or shVasorin and cultured in 1% O2 for 24 hours.
(D) qRT-PCR of Notch target genes in GSCs (4121) transduced with shNT or shVasorin.
(E) Top: IF staining of Vasorin (green) and Notch1 (red) in human GBM. Scale bar measures 20µm. Middle: IF staining of Vasorin (purple) and Hey-1 (green) in human GBM. Scale bar measures 50µm. Bottom: IF staining of Vasorin (purple) and Hey-2 (green) in human GBM. Scale bar measures 50µm. Nuclei were counterstained with DAPI (blue).
(F) IF staining of Vasorin (green), CA9 (red) and Hes-1 (gray) in human GBM. Nuclei were counterstained with DAPI (blue). Scale bar measures 50µm.
(G) IF staining of Vasorin (red), Hes-1 (gray) in GBM xenografts derived from GSCs expressing HRE-EGFP and shNT or shVasorin. Nuclei were counterstained with DAPI (blue). Scale bar measures 50µm.
*p < 0.05, **p < 0.01
Data are represented as mean ± SD. See also Table S1 and Figure S5.
We next assessed the expression of Vasorin and Notch1 signaling components in 4 different human GBM specimens. By co-immunofluorescence staining, Vasorin was co-expressed with Notch1 (Figure 5E, upper panel) and was also co-expressed with Notch downstream targets Hey-1, Hey-2 (Figure 5E, middle and lower panels) and Hes-1 (Figure 5F). In the TCGA glioma database, Vasorin expression was correlated with Hes-1 (Pearson r=0.50, p<0.001) and Hes-2 expression (Pearson r=0.46, p<0.001; Figure S5C–S5D). We then assessed Vasorin and Hes-1 expression in orthotopic models of GBM derived from GSCs expressing HRE-EGFP and either shNT or shVasorin. In control shNT tumors, Vasorin and Hes-1 were co-expressed in EGFP-positive cells (Figure 5G, upper panel). In tumors in which Vasorin was silenced, Hes-1 was undetectable in EGFP-positive cells, suggesting that loss of Vasorin was sufficient to reduce Hes-1 expression (Figure 5G, lower panel). These data collectively demonstrate that Vasorin promotes Notch signaling in GSCs under hypoxic conditions.
Vasorin Stabilizes Membranous Notch1 By Inhibiting its Lysosomal Degradation
Notch is regulated by endosomal sorting pathways, leading either to its recycling or lysosomal degradation (Bray, 2006; Le Borgne et al., 2005). Because Vasorin knockdown significantly impaired Notch1™ levels to reduce Notch signaling (Figure 5), we hypothesized that Vasorin binds to Notch1 to inhibit its lysosomal degradation. We first performed co-immunofluorescence staining of Vasorin and Notch1 in GSCs. Vasorin and Notch1 co-localized at the cell membrane and in discrete cytoplasmic foci (Figure 6A), suggesting that Vasorin may regulate Notch turnover. To assess the possibility that Vasorin could regulate Notch by the lysosome or proteasome, we treated GSCs with either chloroquine, an inhibitor of lysosome acidification (Gonzalez-Noriega et al., 1980), or MG132, an inhibitor of the proteasome. Treatment of GSCs with chloroquine increased Notch1™ levels, but treatment with MG132 caused no appreciable change in Notch1™ (Figure 6B, S6A). After Vasorin knockdown, control cells exhibited reduced Notch1™ and NICD1 levels (Figure 6B). In contrast, chloroquine treated cells with silenced Vasorin showed minimal change in Notch1™ and NICD1 levels. Treatment of GSCs with the proteasome inhibitor MG132 failed to restore Notch1™ or NICD1 levels upon Vasorin knockdown. Together these data suggest that Notch1™ is largely degraded through the lysosome and that Vasorin regulates its degradation.
Figure 6. Vasorin Reduces Notch1 Lysosomal Degradation.

(A) Co-IF staining of Vasorin (green) and Notch1 (red) in GSCs with stable expression of Vasorin-V5.
(B) IB analysis of Notch1 and Vasorin in GSCs transduced with shNT or shVasorin, then treated with chloroquine or MG132.
(C–D) GSCs (4121 and 3691) were transduced with shNT or shVasorin and treated with chloroquine for 6 hours before harvest. (C) Cell lysates were immunoprecipitated (IP) with anti-Notch1 antibody and the co-precipitated proteins were analyzed by IB with the indicated antibodies. IgG was used as a control antibody for IPs. (D) Cell lysates were immunoprecipitated with an anti-Notch1 antibody and then immunoblotted with anti-Ubiquitin (Ub) or anti-Notch1 antibody.
(E–F) GSCs (4121 and 3691) were stably transduced with control vector or Vasorin-V5. (E) Co-IP assay was performed as described in (C). IgG was used as a control antibody for IPs. (F) Ubiquitylation of Notch1™ in GSCs overexpressing Vasorin-V5 was performed as described in (D).
(G) Co-IF staining of Notch1 (red) and lysosomal marker LAMP1 (green) in GSCs transduced with shNT or shVasorin and then treated with control chloroquine for 6 hours (left). Quantification of the percentage of Notch1 co-localized with LAMP1 (right).
(H) Co-IF staining of Notch1 (red) and LAMP1 (green) in GSCs stably expressing control vector or Vasorin-V5 (left). Quantification of the percentage of Notch1 co-localized with LAMP1 (right). The co-localized pixels were assessed by ImageJ.
*p < 0.05
Data are represented as mean ± SD. See also Figure S6.
Numb is an inhibitor of Notch signaling that regulates membranous Notch expression. Numb is thought to facilitate Notch endocytosis or impair its recycling to the cell membrane (Flores et al., 2014; Kandachar and Roegiers, 2012; McGill et al., 2009; McGill and McGlade, 2003; Santolini et al., 2000). Internalized Notch is then targeted for degradation by the lysosome. To define the role of Vasorin in this process, we silenced Vasorin in GSCs and assessed the degree of interaction between Notch1™ and Numb. Knockdown of Vasorin in 2 different GSCs increased Numb-Notch1™ interaction, as determined by co-immunoprecipitation (Figure 6C), and enhanced Notch1™ ubiquitylation (Figure 6D). Conversely, overexpression of Vasorin disrupted the interaction between Numb and Notch1™ (Figure 6E) and decreased Notch1™ ubiquitylation (Figure 6F). Consistent with these results, immunofluorescence staining revealed an increase the distribution of Notch1 in lysosomes, labeled by LAMP1 (Figure 6G) or CD63 (Figure S5B), in GSCs in which Vasorin was silenced. This process was blocked by chloroquine treatment (Figure 6G and S6B). On the other hand, over-expression of Vasorin reduced the fraction of Notch1 in LAMP1-positive lysosomes (Figure 6H). Collectively, these results suggest that Vasorin competes with Numb for Notch1™ binding to suppress the degradation of Notch1™. In this manner, Vasorin acts as a switch to augment Notch signaling within the hypoxic niche.
NICD1 Expression Rescues the Effects Caused by Silencing Vasorin
Our studies suggest that Vasorin maintains GSCs by stabilizing Notch1™ levels and amplifying Notch1 signaling. To test this possibility, we assessed the ability of vector control or Flag-NICD1 to restore GSC self-renewal in the setting of Vasorin knockdown (Figure 7A, S7A). Flag-NICD1 increased tumorsphere formation (Figure 7A) and Notch target gene expression (Figure 7B) in GSCs in which Vasorin was silenced. Moreover, introduction of Flag-NICD1 in shVasorin mice (shVasorin + NICD1 mice) accelerated tumor growth as seen on bioluminescence imaging (Figure 7C) and reduced in animal survival (Figure 7D). Together, these data demonstrate that Vasorin regulates Notch signaling to enhance the tumorigenic potential of GSCs.
Figure 7. Regulation of Notch Signaling by Vasorin.

(A) Tumorsphere formation from GSCs (4121 and 3691) transduced with Flag-NICD1 in the setting of reduced Vasorin. GSCs were cultured under hypoxic conditions (1% O2). Quantification of tumorspheres (right).
(B) qRT-PCR of Vasorin and Notch target genes in GSCs expressing Flag-NICD1 or vector control in the background of shNT or shVasorin knockdown.
(C) Bioluminescence imaging of GBM xenografts derived from GSCs expressing luciferase and either shNT or shVasorin in combination with vector control or Flag-NICD1. Images from animals on day 26 after GSC intracranial transplantation are shown.
(D) Kaplan-Meier survival curves of mice implanted with GSCs (4121) treated as described in (C). Significance testing by log rank test.
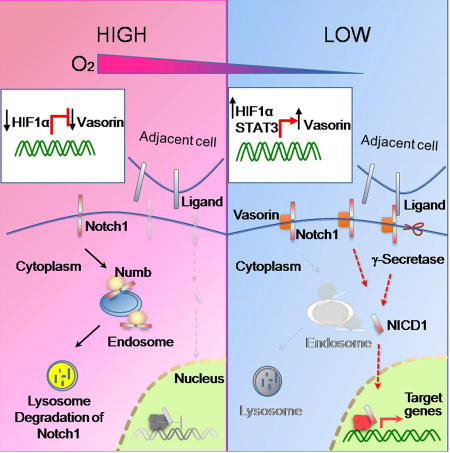
(E) Model of membranous Notch1 regulation by Vasorin. Under normoxic conditions, Vasorin expression is low. Numb binds Notch1™ to facilitate its degradation by the lysosome. Under hypoxic conditions, Vasorin expression is high. Vasorin binds to and stabilizes membranous Notch1 to permit ligand binding, followed by proteolytic cleavage to release the NICD1 and transactivate Notch target genes.
*p < 0.05; **p < 0.01; ***p < 0.001
Data are represented as mean ± SD. See also Figure S7.
Discussion
Notch signaling is an important mediator of stem cell self-renewal and therapeutic resistance, and Notch signaling is augmented under hypoxic conditions (Bar et al., 2010; Charles et al., 2010; Giachino et al., 2015; Gustafsson et al., 2005; Keith and Simon, 2007; Liau et al., 2017; Morrison et al., 2000; Studer et al., 2000). The interplay between hypoxia and Notch signaling occurs on multiple levels. On a transcriptional level, HIF1α binds to the NICD to direct the transactivation of Notch target genes (Gustafsson et al., 2005), and NICD1 activity can be tempered by factor inhibiting HIF1 (FIH1) (Zheng et al., 2008). Our study provides mechanistic data that hypoxia also regulates membranous Notch1 levels, a rate-limiting factor in Notch pathway activation.
In glioblastoma, the hypoxic niche helps to maintain the GSC population. We found elevated expression of Vasorin and Notch signaling components in hypoxic regions of human glioblastoma. Notch levels are dynamically regulated by internalization and lysosomal degradation. The Notch pathway inhibitor Numb regulates this process either by facilitating endocytosis of membranous Notch or impairing Notch recycling. Our data are consistent with both of these models. Vasorin and Numb compete for Notch1 binding to regulate Notch1 turnover (Figure 7E). Under normoxic conditions, Vasorin levels are low. Numb binds Notch1 to facilitate its internalization or prevent its targeting to the membrane, causing intracellular accumulation and eventual degradation. Under hypoxic conditions, Vasorin expression is induced, and Vasorin out-competes Numb for Notch1 binding. Vasorin effectively increases membranous Notch1 levels to amplify Notch1 signaling under hypoxic stress (Figure 7E). Therefore, Vasorin is a critical switch that calibrates Notch signaling under normoxic and hypoxic conditions.
While Vasorin expression was detectable in non-GSCs under standard culture conditions, its expression was significantly lower than in GSCs. When cells were cultured under hypoxic stress, Vasorin was strongly induced in GSCs but remained relatively constant in non-GSCs. This robust induction of Vasorin expression in GSCs led to Notch1™ stabilization and subsequent augmentation of Notch1 signaling. Because the relative expression of Vasorin was induced by hypoxia to a greater extent in GSCs than non-GSCs, Notch signaling was preferentially potentiated in hypoxic GSCs.
The HIF proteins orchestrate cellular responses to hypoxia. The relative roles of HIF1α and HIF2α in GSCs is controversial with HIF2 garnering more attention due to its preferential expression in GSCs compared to non-GSCs (Li et al., 2009b; Seidel et al., 2010; Soeda et al., 2009). Our data reveal that HIF1α target genes can also be selectively induced in GSCs. Induction of Vasorin was dependent upon both HIF1α and STAT3, a transcription factor that is constitutively activated in GSCs (Carro et al., 2010; Li et al., 2009a; Sherry et al., 2009). Inhibition of HIF1α but not HIF2α reduced Vasorin expression, and silencing STAT3 reduced HIF1α binding to the Vasorin promoter. Therefore, both STAT3 and HIF1α are essential to induce efficiently the expression of Vasorin in GSCs. Taken together, these data suggest that a HIF1α/STAT3 complex can confer the selective activation of a distinct suite of genes, including Vasorin, in GSCs under hypoxic conditions. The data urge re-examination of HIF1α in the context of STAT3 activation as an important mediator of GSC properties.
Interestingly, we also found elevated Vasorin expression in CD44-positive and CA9-positive cells in the perivascular region of human glioblastoma. In a mouse model of glioma, the perivascular niche helps to maintain GSCs through Osteopontin-CD44 signaling (Pietras et al., 2014). In that model, CD44 signaling increased HIF2α activity to support the GSC phenotype. As Vasorin is regulated by HIF1α and CA9 is also a selective HIF1-target (Lau et al., 2007), our data suggest that HIF1-mediated pathways may also be activated in the perivascular niche. Previous studies have shown that HIF1 can be activated not just by hypoxia but also by metabolic stress (e.g. low NAD+) or oncogene activation (Denko, 2008). One possibility is that HIF1 is activated through pseudohypoxic mechanisms. Alternatively, a thrombus occluding the vessel proximally could render the area hypoxic. Notch signaling can also be augmented in GSCs by nitric oxide (Charles et al., 2010). Irrespective of the mechanisms driving HIF-induction in the perivascular niche, our data complement these studies and suggest that increased Vasorin expression in CD44-positive cells may further drive Notch signaling. Common mechanisms may be at play in HIF-activated cells in both the hypoxic and perivascular niches to maintain GSCs.
Hypoxia is a key feature of the most aggressive cancers including glioblastoma. Hypoxia reduces the efficacy of radiation and chemotherapy (Brown and Wilson, 2004; Moeller et al., 2007; Rankin and Giaccia, 2008) and supports the intrinsically treatment resistant GSC population (Bao et al., 2006; Chen et al., 2012), rendering these cells even more difficult to eliminate. Drugs that target hypoxic tumor cells have failed clinically (Reddy and Williamson, 2009; Rischin et al., 2010a; Rischin et al., 2010b; Williamson et al., 2005). Similarly, γ-secretase inhibitors which indiscriminately target all Notch isoforms in both normoxic and hypoxic tissues (Andersson and Lendahl, 2014) can cause excessive toxicity that limits their clinical utility (Deangelo DJ, 2006). Vasorin is an attractive therapeutic target. We have found that Vasorin is overexpressed in over 80% of glioblastoma. Our data suggest that targeting Vasorin may help to deplete the hypoxic GSC population by reducing proliferation and inducing apoptosis. In preclinical mouse models of glioblastoma, inhibition of Vasorin extended survival. Combining anti-Vasorin and γ-secretase inhibitors may further diminish Notch signaling by facilitating Notch degradation and inhibiting NICD release, respectively. This strategy may permit dose reduction of γ-secretase inhibitors to maintain Notch inhibition with a high therapeutic index.
STAR*METHODS
CONTACT FOR REAGENT AND RESOURCE SHARING
Further information and requests for resources and reagents should be directed to and will be fulfilled by the Lead Contact, Dr. Jennifer S. Yu (yuj2@ccf.org).
EXPERIMENTAL MODEL AND SUBJECT DETAILS
Cells, Tissues and Cell Culture
GSCs and non-GSCs were isolated and functionally characterized from GBM surgical specimens or xenografts as previously described (Bao et al., 2006; Cheng et al., 2013; Man et al., 2014). Briefly, cells were isolated from tumors using the Papain Dissociation System (Worthington Biochemical) per manufacturer’s instructions and then were recovered in stem cell medium (Neurobasal-A medium with B27 supplement, 10 ng/ml EGF and 10 ng/ml FGF) overnight. GSCs were sorted by magnetic cell sorting using the surface marker CD133 (Miltenyi Biotec.). CD133-positive cells were cultured in stem cell medium as described above and assayed for expression of stem cell markers including Sox2, Olig2, Nestin and absence of GFAP expression (Figure S2A–B). These cells were assessed for sphere-forming ability by in vitro limiting dilution assay (Figure S2C) and tumor formation in immunocompromised mice by in vivo limiting dilution assay (Figure S2D–S2E). CD133-positive cells were differentiated in DMEM with 10% fetal bovine serum (FBS) (Bao et al., 2006; Cheng et al., 2013) and gain of differentiation markers including GFAP and loss of stem cell markers Sox2 and Olig2 were assessed. Cells were grown under standard conditions (21% O2 and 5% CO2) or hypoxia (1% O2 and 5% CO2) at 37°C in specialized multi-gas O2/CO2 incubators (Panasonic MCO-5M-PA). Cells were treated with 200 µM desferoximine (DFX, Sigma), 20 µM chloroquine (Sigma) or 10µM MG132 (Sigma) for the indicated amount of time. For EdU incorporation studies, GSCs were grown as spheres under hypoxic conditions (1% O2) for 48 hrs and incubated with EdU (Click-iT EdU Imaging Kits (Invitrogen)) for 3 hrs. Cells were fixed, permeabilized, and EdU was detected per manufacturer’s directions. GSCs and non-GSCs were from GBM patients of the following age and sex: 3691, 59 year old female; 3832, 75 year old female; 4121, 53 year old male (recurrent GBM); 387, 69 year old, sex not available; 456, 60 year old, sex not available; H2S, age and sex not available. Sex determination of the 387, 456 and H2S cell lines by analyses of X and Y chromosome genes were inconclusive. Details on past medical history, past surgical history and medication and drug use that patients may have had prior to surgery are not available. Cell lines were authenticated by sequence analysis and have no evidence of cross contamination.
GBM surgical specimens were collected for this study in accordance with a Cleveland Clinic Institutional Review Board-approved protocol. GBM tissues were obtained from newly diagnosed patients with the following clinical characteristics: 1283, 81 year old female; 1320, 66 year old male; 1200, 80 year old male; 1924, 67 year old male; 2052, 47 year old female; 2004, 51 year old male; 2694, 68 year old male; 1922, 62 year old female; 2025, 46 year old male; 2726, 53 year old male; 1917, 56 year old female. All patients were sufficiently healthy to undergo surgery. Details on past medical history, past surgical history and medication and drug use that the patients may have had prior to surgery are not available. Analysis of the TCGA diffuse glioma database included 667 adult glioma patients, 152 patients with glioblastoma and 515 patients with low grade gliomas, age range 14 to 89 years old, median age 47.0 years, 254 females and 355 males, 58 patients in whom sex is not available. In the TCGA GBM database, there were 366 patients with GBM in whom IDH mutational status and Vasorin expression was known. 339 patients had IDH wild type tumors, 27 had IDH mutant tumors. Of these patients, 136 patients were female and 226 were male, 4 were of unknown sex. In the TCGA GBM/LGG dataset used for survival analysis, 251 patients had IDH wild-type tumors in whom Vasorin expression was known. For Kaplan-Meier survival analysis, median Vasorin expression was used as a cutoff. 125 patients had high Vasorin expression, and 126 patients had low Vasorin expression. The glioma tissue microarray was purchased from US Biomax. Histologic diagnosis of the tissue microarray cores was reviewed by a pathologist. 8 specimens were re-categorized from grade IV to grade II astrocytoma. The tissue microarray included tumors from 5 patients with grade I astrocytoma, 3 females, 2 males, ages 14–41 years old, median 33 years; 18 patients with grade II astrocytoma, 5 females, 13 males, ages 16–73 years old, median 51.5 years; 32 patients with glioblastoma, 15 females, 17 males, ages 6–71 years old, median 42.5 years; 4 patients with oligoastrocytoma, 2 females, 2 males, ages 45–50 years old, median 47 years; 9 patients with oligodendroglioma, 2 females, 7 males, ages 29–55 years old, median 40 years; normal brain tissue from 2 females and 3 males, ages 30–52 years old, median 39 years.
Mouse Xenografts
All animal experiments were approved by the Institutional Animal Care and Use Committee at Cleveland Clinic. Mice used in these studies were 4-week old, NU/NU nude mice and were housed in the pathogen-free barrier animal facility at Cleveland Clinic Lerner Research Institute, which is accredited by the AAALAC (American Association for Accreditation of Laboratory Animal Care). Animal care was monitored daily by certified veterinary staffs and laboratory personnel. Every effort was made to minimize discomfort, distress, pain, or injury to the mice. All mice were maintained in accordance with the applicable portions of the Animal Welfare Act and the guidelines set by the IACUC. A maximum of 5 mice per cage were allowed. All surgical procedures were performed under anesthesia by either intraperitoneal injection of a ketamine and xylazine cocktail or isofluorane gas. Mice were euthanized by inhalation of carbon dioxide followed by cervical dislocation. Tissues were removed following euthanasia for in vitro analysis. Methods describing the establishment of mouse orthotopic xenograft are described below.
METHOD DETAILS
Immunofluorescence Staining, Immunohistochemistry and Immunoblot
Immunofluorescent staining of cells and tissues sections was performed as previously described (Man et al., 2014). Briefly, 4% paraformaldehyde (PFA, Sigma-Aldrich) was used to fix cultured cells or human surgical specimens for 15 mins. Samples were blocked with 10% normal donkey serum (Vector) with 0.3% Triton X-100 (Bio-Rad) in PBS for 60 min at room temperature, and then incubated with primary antibodies overnight at 4 °C followed b y the appropriate secondary fluorescently labeled antibodies (Invitrogen) for one hour at room temperature. Nuclei were counterstained with DAPI. Images were acquired using a wide-field fluorescence microscope (Leica) or SP-5 confocal microscope (Leica). IF was performed for Vasorin and various combinations of stem cell markers and markers of hypoxia in 11 different human GBM specimens, and Vasorin and CD31, CD44 or CA9 in at least 2 GBM specimens. Details on the specimens used are above. Inclusion criteria were pathologic diagnosis of GBM and consent to donate tissue for research.
Immunohistochemical staining of tissue sections was performed with an ABC kit using DAB (3,30-Diaminobenzine) detection (Vector Lab) as previously described (Man et al., 2014). Tissue microarrays including normal brain, low grade and high grade gliomas were purchased from US Biomax Inc. Presence or absence of Vasorin staining was scored by at least 2 individuals, one of whom is a pathologist, and consensus scores are reported. Descriptive analyses were performed and the percentage of positive staining tissue specimens are reported.
Immunoblotting was performed as previously described (Man et al., 2014). Briefly, cells were lysed in RIPA buffer supplemented with protease and phosphatase inhibitors (Roche). Protein samples were resolved by SDS-PAGE and transferred onto PVDF membranes. Blots were incubated with primary antibodies overnight at 4°C followed by HRP-conjugated species-specific antibodies (Santa-Cruz, 1:5000). All immunoblots were performed at least 3 times.
The following antibodies were used: Vasorin (Millipore for IB, 1:1000; R&D for IHC, 1:200; Santa Cruz for IF, 1:200), CD133 (Miltenyi Biotec for IF, 1:100), Sox2 (Millipore for IB, 1:1000; Santa Cruz for IF, 1:200), CA9 (Cell Signaling for IF, 1:200), HIF1α (Cell Signaling for IF, 1:200; for IB, 1:1000), HIF2α (Cell Signaling for IF, 1:200; for IB, 1:1000), STAT3 (Cell Signaling for IF, 1:200; for IB, 1:1000), phospho-STAT3 (Tyr705) (Cell Signaling for for IB, 1:1000), Cleaved-PARP (Cell Signaling for IB, 1:1000), Cleaved-Caspapse3 (Cell Signaling for IB, 1:1000), NICD1 (Cell Signaling for IB, 1:1000), Notch1 (Cell Signaling for IB, 1:1000; for IF, 1:200), Notch2 (Cell Signaling for IB, 1:1000), Notch3 (Cell Signaling for IB, 1:1000), Hes-1 (Abcam for IF, 1:200), LAMP1 (R&D for IF, 1:200), CD63 (Pierce for IF, 1:200), Numb (Cell Signaling for IB, 1:1000), Ubiquitin and GAPDH (Cell Signaling for IB, 1:1000), V5 (Pierce for IB, 1:1000) and Flag (Sigma for IB, 1:2000).
DNA Constructs and Lentiviral Transfection
The mammalian expression plasmid for Vasorin (pLX304-Vasorin-V5) was purchased from DNASU; human Flag-NICD1 was generated by PCR and cloned into the pCDH-CMV-EF1-GFP lentiviral vector (System Biosciences). The 4XHRE-EGFP reporter was inserted into pCDH-CMV-EF1-Puro lentiviral vector (System Biosciences). Viral particles were produced in 293FT cells with the pPACK set of helper plasmids (System Biosciences) in stem cell media. Lentiviral clones expressing nontargeting NT shRNA, Vasorin, HIF1α, HIF2α and STAT3 shRNAs were acquired from Sigma-Aldrich. Two of five shRNAs for each gene that displayed high knockdown efficiency (>80% reduction) were used for all related experiments. For rescue experiments, GSCs were transduced with Flag-NICD1 lentiviral construct and allowed to recover for 48 hr. Cells were selected by FACS sorting based on IRES-GFP expression, and these stable cells expressing Flag-NICD1 were transduced with shVasorin or non-targeting shRNA via lentiviral infection. 48 hours post infection, cells were plated to assess cell proliferation, tumorsphere formation or used for in vivo experiments. Cell proliferation and tumorsphere formation assays were performed at least in triplicate.
Cell Viability Assays
For cell viability assays, 1×10³ cells were plated into each well of 96-well plates. Cell titers were determined after the indicated number of days using the Cell Titer-Glo Luminescent Cell Viability Assay kit (Promega). All data were performed in triplicate and normalized to day 0 and presented as mean ± standard deviation.
Immunoprecipitation and mass spectrometric analysis
GSCs were collected and lysed in lysis buffer supplemented with protease inhibitors, incubated on ice for 15 min, and cleared by centrifugation at 14,000g at 4°C for 10 min. Protein lysate was subjected to immunoprecipitation with the primary antibody (10 µg of antibody as indicated, or isotype control antibodies) overnight at 4°C. The precipitants were extensively washed with wash buffer, boiled with SDS loading buffer and subjected to SDS-PAGE and immunoblot. Immunoprecipitation was performed at least twice per cell line.
For mass spectrometry, one GSC line was used. Endogenous Vasorin was immunoprecipitated with anti-Vasorin antibody or isotype control overnight at 4°C. The precipitants were extensively washed with wash buffer, boiled with SDS loading buffer and subjected to SDS-PAGE. Gel fragments were excised, washed and destained in 50% ethanol and 5% acetic acid, dehydrated in acetonitrile, dried in a Speed-vac and digested with trypsin or chymotrypsin overnight at room temperature. Peptides were extracted with 50% acetonitrile and 5% formic acid and dried in a Speedvac. Peptides were resuspended in 1% acetic acid and subject to LC-MS/MS using a Finnigan LTQ-Obitrap Elite hybrid mass spectrometer. A Dionex 15 cm × 75 µm id Acclaim Pepmap C18, 2 µM, 100 Angstrom reversed-phase capillary HPLC column was used. Peptides were eluted with acetonitrile/0.1% formic acid gradient at 0.25 µl/min and subject to tandem mass spectrometry with a 2.5 kV microelectrospray ion source. Molecular weights and ion spectra were determined. Mascot and Sequest were used for protein identification. Scaffold software was used to analyze and filter data based on > 2 unique peptides, threshold Mascot peptide ion scores > 40 and Sequest Xcorr scores > 2.0 (+2), 2.5 (+3,+4).
Chromatin immunoprecipitation assay
ChIP assays were performed using the Magna ChIP A Kit (Millipore) according to the manufacturer’s protocol. GSCs were cultured under hypoxic conditions for 12 hr before harvest. 10 µg of pre-immune rabbit IgG, anti-HIF1α (Cell Signaling) or anti-STAT3 (Cell Signaling) antibody was used for each ChIP reaction. Precipitated DNA was analyzed using a 7500 Real-Time PCR System (Applied Biosystems). Primers used for ChIP-PCR assay at Vasorin Promoter are included in Supplemental Table S2. ChIP was performed in three different GSC lines at least three times per line.
In vitro ubiquitylation assay
GSCs were treated with 20µM chloroquine (Sigma) or vehicle control for 6 hr before collection. Cells were washed with cold PBS and then lysed with RIPA buffer by sonication for 10 min. Lysates were immunoprecipitated using 5µg anti-Notch1 antibody (Cell Signaling) and subjected to western blotting with anti-Ub antibody (Cell Signaling, 1:1000) or anti-Notch1 antibody (Cell Signaling, 1:1000) to detect ubiquitylation of Notch1. Ubiquitylation assays were performed at least twice per cell line.
RNA isolation and real-time PCR
Total RNA was isolated from cultured cells using RNeasy Kit (Qiagen). cDNA was synthesized by reverse transcription using oligo (dT) and subjected to real-time PCR with human Vasorin, HIF1α, HIF2α, CD133, Olig2, Sox2, Nestin, Hes-1, Hey-1, Hey-2 and Hes-5 primers in the presence of Cyber green PCR-Mix (Applied Biosystems). Data were analyzed from three independent experiments and are shown as the mean ± S.D. Primer pairs used to detect the mRNA levels of the genes by RT-qPCR are found in Supplemental Table S2.
Flow cytometry analysis
For flow cytometry analysis, GBM cells were dissociated from mouse xenografts and sorted on a BD FACS Aria II based on GFP expression (HRE-EGFP) or using the anti-Vasorin (Santa Cruz, 1:100), anti-CD133 (Miltenyi Biotec, 1:100). Appropriate isotype control antibodies were used to set gates and live/dead cell determination was based on propidium iodide (5µg/ml). Flow cytometry assays were performed at least three times per cell line.
Orthotopic Mouse Xenograft Studies
Intracranial transplantation of GSCs to establish GBM xenografts was performed as described (Man et al., 2014). Briefly, 48 hr after lentiviral infection, 2×10⁴ GSCs were implanted into the right frontal lobes of female NU/NU nude mice. 4-week old littermates were used for transplantation studies and randomized to receive GSCs expressing shNT or shVasorin, or shNT or shVasorin with or without Flag-NICD1 or control vector. For the survival experiments, animals were maintained until manifestation of neurological signs or for 180 days post-transplantation. To monitor tumor growth, mice transplanted with GSCs, which stably expressed firefly luciferase, were monitored by bioluminescence imaging longitudinally using the IVIS100 bioluminescence imaging system. To compare tumor growth, different experimental groups of mice implanted with GSCs were harvested on the same day as indicated after GSC transplantation and H&E staining or TUNEL staining performed. Mice were euthanized and necropsied when exhibiting signs of declining neurologic status or performance status. Animals were anesthetized and underwent cardiac perfusion with PBS. Mouse brains were fixed in 10% formalin or 4% paraformaldehyde overnight, washed with PBS and preserved with 30% sucrose. Brains were placed in OCT compound and stored at −80°C until use. Investigators were not blinded on the identity of the mice.
Bioinformatics Analysis
TCGA diffuse glioma database (Ceccarelli et al., 2016) including RNAseq and patient survival were downloaded from the TCGA Research Network http://cancergenome.nih.gov/. Gene expression of Vasorin and other genes in the TCGA diffuse glioma database were assessed using publicly available platforms including the biostatistics program R Studio v3.2.3 with packages shiny, gplots, dplyr and png and GlioVis (Bowman R, 2017) (http://gliovis.bioinfo.cnio.es). Vasorin promoter analysis for potential HIF and STAT3 binding sites was assessed using ENCODE v3 or BLAT for the binding motif on the Human Genome Browser, December 2009 assembly (hg19), on the Genome Browser website (http://genome.ucsc.edu/).
QUANTIFICATION AND STATISTICAL ANALYSIS DATA
All grouped data are presented as mean ± SD unless otherwise specified. All in vitro experiments were repeated at least three times. Differences in means between groups were analyzed using the Mann-Whitney U test for non-parametric data and two-tailed unpaired Student’s t test for parametric data. A probability value of 0.05 or less was considered significant. Shapiro-Wilk normality testing (SPSS) on Vasorin expression in TCGA dataset showed that the data were not normally distributed, hence we performed a Mann-Whitney U test for differential expression levels of Vasorin in the TCGA dataset (Prism 5). For the survival analysis, the patients were divided into Vasorin high (z-score > median) and Vasorin (VASN) low expressing (z-score < median) group. Kaplan-Meier survival curves were analyzed by using log-rank statistics comparing the different patient or mouse groups. For the correlation between gene expression and patient survival analysis from publicly available datasets, the data were provided by TCGA and downloaded from Gliovis. For all figures presented in box-and-whisker format, the center line represents the median and the lower and upper limits of the box represent the 25th and 75th percentiles. The maximum and minimum are connected to the center box through the vertical lines (whiskers). GraphPad Prism Software (GraphPad Software, Inc.) was used to examine statistical significance. For Figure 1, n refers to the number of patient specimens analyzed. For mouse xenograft studies, Figure 4I and 4J, n=6 mice for each group (e.g., shNT, shVasorin443, shVasorin685) for the 4121 xenograft model and n=8 mice for each group for the 3691 xenograft model. For mouse xenograft studies, Figure 7C and 7D, n=6–7 mice for each group. For in vivo limiting dilution studies, Figure S2D–S2E, n=5–6 mice for each group and Figure S4G–S4H, n=6 mice for each group.
DATA AND SOFTWARE AVAILABILITY
The list of software for data analysis and processing can be found in the Key Resources Table.
Supplementary Material
Highlights.
Vasorin maintains glioma stem-like cells (GSCs) in the hypoxic niche
HIF1α/STAT3 co-activator complex induces Vasorin expression selectively in GSCs
Vasorin binds to and regulates membranous Notch1 turnover
Vasorin expression correlates with glioma aggressiveness
Acknowledgments
We thank the Cleveland Clinic Proteomics Core and Imaging Core for assistance with mass spectrometry and microscopy, respectively. We thank Dr. Jeremy Rich and the Burkhardt Brain Tumor and Neuro-Oncology Center brain tumor bank for GSCs and glioma specimens. This research was supported by the Cleveland Clinic Foundation (JSY), NIH/NCATS KL2TR000440 (JSY), NIH/NINDS R01NS094199 (JSY), NIH/NINDS R01NS092641 (JSY), NIH/NCI R01CA184090 (SB), NIH/NINDS R01NS091080 (SB) and NIH/NINDS NS099175 (SB), National Natural Science Foundation of China (JM) (no. 81521064; no. 81572889) and Cleveland Clinic core facilities (S10RR031537, S10OD019972). Its contents are solely the responsibility of the authors and do not necessarily represent the official views of the NIH.
Footnotes
Publisher's Disclaimer: This is a PDF file of an unedited manuscript that has been accepted for publication. As a service to our customers we are providing this early version of the manuscript. The manuscript will undergo copyediting, typesetting, and review of the resulting proof before it is published in its final citable form. Please note that during the production process errors may be discovered which could affect the content, and all legal disclaimers that apply to the journal pertain.
Author contributions
J.M., X.Y., H.H, C.X., H.H. performed and analyzed the experiments. W.Z, S.B. and Z.L. provided reagents. G.B. assisted with bioinformatics analyses. L.M., Z.L. and S.B. provided technical and scientific advice. J.M., X.Y. and J.S.Y. conceptualized and designed the overall research and wrote the manuscript.
References
- Andersson ER, Lendahl U. Therapeutic modulation of Notch signalling--are we there yet? Nature reviews Drug discovery. 2014;13:357–378. doi: 10.1038/nrd4252. [DOI] [PubMed] [Google Scholar]
- Bao S, Wu Q, McLendon RE, Hao Y, Shi Q, Hjelmeland AB, Dewhirst MW, Bigner DD, Rich JN. Glioma stem cells promote radioresistance by preferential activation of the DNA damage response. Nature. 2006;444:756–760. doi: 10.1038/nature05236. [DOI] [PubMed] [Google Scholar]
- Bar EE, Lin A, Mahairaki V, Matsui W, Eberhart CG. Hypoxia increases the expression of stem-cell markers and promotes clonogenicity in glioblastoma neurospheres. The American journal of pathology. 2010;177:1491–1502. doi: 10.2353/ajpath.2010.091021. [DOI] [PMC free article] [PubMed] [Google Scholar]
- Bleau AM, Hambardzumyan D, Ozawa T, Fomchenko EI, Huse JT, Brennan CW, Holland EC. PTEN/PI3K/Akt pathway regulates the side population phenotype and ABCG2 activity in glioma tumor stem-like cells. Cell stem cell. 2009;4:226–235. doi: 10.1016/j.stem.2009.01.007. [DOI] [PMC free article] [PubMed] [Google Scholar]
- Bowman RL, Wang Q, Carro A, Verhaak RG, Squatrito M. GioVis data protal for visualization and analysis of brain tumor expression datasets. Neuro-oncology. 2017;19:139–141. doi: 10.1093/neuonc/now247. [DOI] [PMC free article] [PubMed] [Google Scholar]
- Bray SJ. Notch signalling: a simple pathway becomes complex. Nature reviews Molecular cell biology. 2006;7:678–689. doi: 10.1038/nrm2009. [DOI] [PubMed] [Google Scholar]
- Brown JM, Wilson WR. Exploiting tumour hypoxia in cancer treatment. Nature reviews Cancer. 2004;4:437–447. doi: 10.1038/nrc1367. [DOI] [PubMed] [Google Scholar]
- Calabrese C, Poppleton H, Kocak M, Hogg TL, Fuller C, Hamner B, Oh EY, Gaber MW, Finklestein D, Allen M, et al. A perivascular niche for brain tumor stem cells. Cancer cell. 2007;11:69–82. doi: 10.1016/j.ccr.2006.11.020. [DOI] [PubMed] [Google Scholar]
- Carro MS, Lim WK, Alvarez MJ, Bollo RJ, Zhao X, Snyder EY, Sulman EP, Anne SL, Doetsch F, Colman H, et al. The transcriptional network for mesenchymal transformation of brain tumours. Nature. 2010;463:318–325. doi: 10.1038/nature08712. [DOI] [PMC free article] [PubMed] [Google Scholar]
- Ceccarelli M, Barthel FP, Malta TM, Sabedot TS, Salama SR, Murray BA, Morozova O, Newton Y, Radenbaugh A, Pagnotta SM, et al. Molecular Profiling Reveals Biologically Discrete Subsets and Pathways of Progression in Diffuse Glioma. Cell. 2016;164:550–563. doi: 10.1016/j.cell.2015.12.028. [DOI] [PMC free article] [PubMed] [Google Scholar]
- Charles N, Ozawa T, Squatrito M, Bleau AM, Brennan CW, Hambardzumyan D, Holland EC. Perivascular nitric oxide activates notch signaling and promotes stem-like character in PDGF-induced glioma cells. Cell stem cell. 2010;6:141–152. doi: 10.1016/j.stem.2010.01.001. [DOI] [PMC free article] [PubMed] [Google Scholar]
- Chen J, Li Y, Yu TS, McKay RM, Burns DK, Kernie SG, Parada LF. A restricted cell population propagates glioblastoma growth after chemotherapy. Nature. 2012;488:522–526. doi: 10.1038/nature11287. [DOI] [PMC free article] [PubMed] [Google Scholar]
- Cheng L, Huang Z, Zhou W, Wu Q, Donnola S, Liu JK, Fang X, Sloan AE, Mao Y, Lathia JD, et al. Glioblastoma stem cells generate vascular pericytes to support vessel function and tumor growth. Cell. 2013;153:139–152. doi: 10.1016/j.cell.2013.02.021. [DOI] [PMC free article] [PubMed] [Google Scholar]
- Choksi S, Lin Y, Pobezinskaya Y, Chen L, Park C, Morgan M, Li T, Jitkaew S, Cao X, Kim YS, et al. A HIF-1 target, ATIA, protects cells from apoptosis by modulating the mitochondrial thioredoxin, TRX2. Molecular cell. 2011;42:597–609. doi: 10.1016/j.molcel.2011.03.030. [DOI] [PMC free article] [PubMed] [Google Scholar]
- Deangelo DJSR, Silverman LB, et al. A phase I clinical trial of the notch inhibitor MK-0752 in patients with T-cell acute lymphoblastic leukemia/lymphoma (T-ALL) and other leukemias. Journal of clinical oncology : official journal of the American Society of Clinical Oncology. 2006;24:6585. [Google Scholar]
- Denko NC. Hypoxia, HIF1 and glucose metabolism in the solid tumour. Nature reviews Cancer. 2008;8:705–713. doi: 10.1038/nrc2468. [DOI] [PubMed] [Google Scholar]
- Eckel-Passow JE, Lachance DH, Molinaro AM, Walsh KM, Decker PA, Sicotte H, Pekmezci M, Rice T, Kosel ML, Smirnov IV, et al. Glioma Groups Based on 1p/19q, IDH, and TERT Promoter Mutations in Tumors. The New England journal of medicine. 2015;372:2499–2508. doi: 10.1056/NEJMoa1407279. [DOI] [PMC free article] [PubMed] [Google Scholar]
- Fan X, Khaki L, Zhu TS, Soules ME, Talsma CE, Gul N, Koh C, Zhang J, Li YM, Maciaczyk J, et al. NOTCH pathway blockade depletes CD133-positive glioblastoma cells and inhibits growth of tumor neurospheres and xenografts. Stem Cells. 2010;28:5–16. doi: 10.1002/stem.254. [DOI] [PMC free article] [PubMed] [Google Scholar]
- Flores AN, McDermott N, Meunier A, Marignol L. NUMB inhibition of NOTCH signalling as a therapeutic target in prostate cancer. Nat Rev Urol. 2014;11:499–507. doi: 10.1038/nrurol.2014.195. [DOI] [PMC free article] [PubMed] [Google Scholar]
- Giachino C, Boulay JL, Ivanek R, Alvarado A, Tostado C, Lugert S, Tchorz J, Coban M, Mariani L, Bettler B, et al. A Tumor Suppressor Function for Notch Signaling in Forebrain Tumor Subtypes. Cancer cell. 2015;28:730–742. doi: 10.1016/j.ccell.2015.10.008. [DOI] [PubMed] [Google Scholar]
- Guryanova OA, Wu Q, Cheng L, Lathia JD, Huang Z, Yang J, MacSwords J, Eyler CE, McLendon RE, Heddleston JM, et al. Nonreceptor tyrosine kinase BMX maintains self-renewal and tumorigenic potential of glioblastoma stem cells by activating STAT3. Cancer cell. 2011;19:498–511. doi: 10.1016/j.ccr.2011.03.004. [DOI] [PMC free article] [PubMed] [Google Scholar]
- Gustafsson MV, Zheng X, Pereira T, Gradin K, Jin S, Lundkvist J, Ruas JL, Poellinger L, Lendahl U, Bondesson M. Hypoxia requires notch signaling to maintain the undifferentiated cell state. Developmental cell. 2005;9:617–628. doi: 10.1016/j.devcel.2005.09.010. [DOI] [PubMed] [Google Scholar]
- Harris AL. Hypoxia--a key regulatory factor in tumour growth. Nature reviews Cancer. 2002;2:38–47. doi: 10.1038/nrc704. [DOI] [PubMed] [Google Scholar]
- Hoogsteen IJ, Lok J, Marres HA, Takes RP, Rijken PF, van der Kogel AJ, Kaanders JH. Hypoxia in larynx carcinomas assessed by pimonidazole binding and the value of CA-IX and vascularity as surrogate markers of hypoxia. Eur J Cancer. 2009;45:2906–2914. doi: 10.1016/j.ejca.2009.07.012. [DOI] [PubMed] [Google Scholar]
- Hovinga KE, Shimizu F, Wang R, Panagiotakos G, Van Der Heijden M, Moayedpardazi H, Correia AS, Soulet D, Major T, Menon J, et al. Inhibition of notch signaling in glioblastoma targets cancer stem cells via an endothelial cell intermediate. Stem Cells. 2010;28:1019–1029. doi: 10.1002/stem.429. [DOI] [PMC free article] [PubMed] [Google Scholar]
- Hu CJ, Wang LY, Chodosh LA, Keith B, Simon MC. Differential roles of hypoxia-inducible factor 1alpha (HIF-1alpha) and HIF-2alpha in hypoxic gene regulation. Molecular and cellular biology. 2003;23:9361–9374. doi: 10.1128/MCB.23.24.9361-9374.2003. [DOI] [PMC free article] [PubMed] [Google Scholar]
- Ikeda Y, Imai Y, Kumagai H, Nosaka T, Morikawa Y, Hisaoka T, Manabe I, Maemura K, Nakaoka T, Imamura T, et al. Vasorin, a transforming growth factor beta-binding protein expressed in vascular smooth muscle cells, modulates the arterial response to injury in vivo. Proceedings of the National Academy of Sciences of the United States of America. 2004;101:10732–10737. doi: 10.1073/pnas.0404117101. [DOI] [PMC free article] [PubMed] [Google Scholar]
- Kandachar V, Roegiers F. Endocytosis and control of Notch signaling. Curr Opin Cell Biol. 2012;24:534–540. doi: 10.1016/j.ceb.2012.06.006. [DOI] [PMC free article] [PubMed] [Google Scholar]
- Keith B, Simon MC. Hypoxia-inducible factors, stem cells, and cancer. Cell. 2007;129:465–472. doi: 10.1016/j.cell.2007.04.019. [DOI] [PMC free article] [PubMed] [Google Scholar]
- Kim Y, Lin Q, Zelterman D, Yun Z. Hypoxia-regulated delta-like 1 homologue enhances cancer cell stemness and tumorigenicity. Cancer research. 2009;69:9271–9280. doi: 10.1158/0008-5472.CAN-09-1605. [DOI] [PMC free article] [PubMed] [Google Scholar]
- Lau KW, Tian YM, Raval RR, Ratcliffe PJ, Pugh CW. Target gene selectivity of hypoxia-inducible factor-alpha in renal cancer cells is conveyed by post-DNA-binding mechanisms. British journal of cancer. 2007;96:1284–1292. doi: 10.1038/sj.bjc.6603675. [DOI] [PMC free article] [PubMed] [Google Scholar]
- Le Borgne R, Bardin A, Schweisguth F. The roles of receptor and ligand endocytosis in regulating Notch signaling. Development. 2005;132:1751–1762. doi: 10.1242/dev.01789. [DOI] [PubMed] [Google Scholar]
- Li GH, Wei H, Chen ZT, Lv SQ, Yin CL, Wang DL. STAT3 silencing with lentivirus inhibits growth and induces apoptosis and differentiation of U251 cells. Journal of neuro-oncology. 2009a;91:165–174. doi: 10.1007/s11060-008-9696-0. [DOI] [PubMed] [Google Scholar]
- Li Z, Bao S, Wu Q, Wang H, Eyler C, Sathornsumetee S, Shi Q, Cao Y, Lathia J, McLendon RE, et al. Hypoxia-inducible factors regulate tumorigenic capacity of glioma stem cells. Cancer cell. 2009b;15:501–513. doi: 10.1016/j.ccr.2009.03.018. [DOI] [PMC free article] [PubMed] [Google Scholar]
- Liau BB, Sievers C, Donohue LK, Gillespie SM, Flavahan WA, Miller TE, Venteicher AS, Hebert CH, Carey CD, Rodig SJ, et al. Adaptive Chromatin Remodeling Drives Glioblastoma Stem Cell Plasticity and Drug Tolerance. Cell stem cell. 2017;20:233–246. e237. doi: 10.1016/j.stem.2016.11.003. [DOI] [PMC free article] [PubMed] [Google Scholar]
- Malapeira J, Esselens C, Bech-Serra JJ, Canals F, Arribas J. ADAM17 (TACE) regulates TGFbeta signaling through the cleavage of vasorin. Oncogene. 2011;30:1912–1922. doi: 10.1038/onc.2010.565. [DOI] [PubMed] [Google Scholar]
- Man J, Shoemake J, Zhou W, Fang X, Wu Q, Rizzo A, Prayson R, Bao S, Rich JN, Yu JS. Sema3C Promotes the Survival and Tumorigenicity of Glioma Stem Cells through Rac1 Activation. Cell reports. 2014;9:1812–1826. doi: 10.1016/j.celrep.2014.10.055. [DOI] [PMC free article] [PubMed] [Google Scholar]
- McGill MA, Dho SE, Weinmaster G, McGlade CJ. Numb regulates post-endocytic trafficking and degradation of Notch1. The Journal of biological chemistry. 2009;284:26427–26438. doi: 10.1074/jbc.M109.014845. [DOI] [PMC free article] [PubMed] [Google Scholar]
- McGill MA, McGlade CJ. Mammalian numb proteins promote Notch1 receptor ubiquitination and degradation of the Notch1 intracellular domain. The Journal of biological chemistry. 2003;278:23196–23203. doi: 10.1074/jbc.M302827200. [DOI] [PubMed] [Google Scholar]
- Miele L. Notch signaling. Clinical cancer research : an official journal of the American Association for Cancer Research. 2006;12:1074–1079. doi: 10.1158/1078-0432.CCR-05-2570. [DOI] [PubMed] [Google Scholar]
- Moeller BJ, Cao Y, Li CY, Dewhirst MW. Radiation activates HIF-1 to regulate vascular radiosensitivity in tumors: role of reoxygenation, free radicals, and stress granules. Cancer cell. 2004;5:429–441. doi: 10.1016/s1535-6108(04)00115-1. [DOI] [PubMed] [Google Scholar]
- Moeller BJ, Richardson RA, Dewhirst MW. Hypoxia and radiotherapy: opportunities for improved outcomes in cancer treatment. Cancer metastasis reviews. 2007;26:241–248. doi: 10.1007/s10555-007-9056-0. [DOI] [PubMed] [Google Scholar]
- Moretti J, Brou C. Ubiquitinations in the notch signaling pathway. International journal of molecular sciences. 2013;14:6359–6381. doi: 10.3390/ijms14036359. [DOI] [PMC free article] [PubMed] [Google Scholar]
- Morrison SJ, Csete M, Groves AK, Melega W, Wold B, Anderson DJ. Culture in reduced levels of oxygen promotes clonogenic sympathoadrenal differentiation by isolated neural crest stem cells. The Journal of neuroscience : the official journal of the Society for Neuroscience. 2000;20:7370–7376. doi: 10.1523/JNEUROSCI.20-19-07370.2000. [DOI] [PMC free article] [PubMed] [Google Scholar]
- Noushmehr H, Weisenberger DJ, Diefes K, Phillips HS, Pujara K, Berman BP, Pan F, Pelloski CE, Sulman EP, Bhat KP, et al. Identification of a CpG island methylator phenotype that defines a distinct subgroup of glioma. Cancer cell. 2010;17:510–522. doi: 10.1016/j.ccr.2010.03.017. [DOI] [PMC free article] [PubMed] [Google Scholar]
- Park NI, Guilhamon P, Desai K, McAdam RF, Langille E, O’Connor M, Lan X, Whetstone H, Coutinho FJ, Vanner RJ, et al. ASCL1 Reorganizes Chromatin to Direct Neuronal Fate and Suppress Tumorigenicity of Glioblastoma Stem Cells. Cell stem cell. 2017;21:209–224. e207. doi: 10.1016/j.stem.2017.06.004. [DOI] [PubMed] [Google Scholar]
- Pastrana E, Silva-Vargas V, Doetsch F. Eyes wide open: a critical review of sphere-formation as an assay for stem cells. Cell stem cell. 2011;8:486–498. doi: 10.1016/j.stem.2011.04.007. [DOI] [PMC free article] [PubMed] [Google Scholar]
- Patel AP, Tirosh I, Trombetta JJ, Shalek AK, Gillespie SM, Wakimoto H, Cahill DP, Nahed BV, Curry WT, Martuza RL, et al. Single-cell RNA-seq highlights intratumoral heterogeneity in primary glioblastoma. Science. 2014;344:1396–1401. doi: 10.1126/science.1254257. [DOI] [PMC free article] [PubMed] [Google Scholar]
- Pawlus MR, Wang L, Hu CJ. STAT3 and HIF1alpha cooperatively activate HIF1 target genes in MDA-MB-231 and RCC4 cells. Oncogene. 2014;33:1670–1679. doi: 10.1038/onc.2013.115. [DOI] [PMC free article] [PubMed] [Google Scholar]
- Pawlus MR, Wang L, Murakami A, Dai G, Hu CJ. STAT3 or USF2 contributes to HIF target gene specificity. PloS one. 2013;8:e72358. doi: 10.1371/journal.pone.0072358. [DOI] [PMC free article] [PubMed] [Google Scholar]
- Pietras A, Katz AM, Ekstrom EJ, Wee B, Halliday JJ, Pitter KL, Werbeck JL, Amankulor NM, Huse JT, Holland EC. Osteopontin-CD44 signaling in the glioma perivascular niche enhances cancer stem cell phenotypes and promotes aggressive tumor growth. Cell stem cell. 2014;14:357–369. doi: 10.1016/j.stem.2014.01.005. [DOI] [PMC free article] [PubMed] [Google Scholar]
- Purow BW, Sundaresan TK, Burdick MJ, Kefas BA, Comeau LD, Hawkinson MP, Su Q, Kotliarov Y, Lee J, Zhang W, et al. Notch-1 regulates transcription of the epidermal growth factor receptor through p53. Carcinogenesis. 2008;29:918–925. doi: 10.1093/carcin/bgn079. [DOI] [PMC free article] [PubMed] [Google Scholar]
- Qiang L, Wu T, Zhang HW, Lu N, Hu R, Wang YJ, Zhao L, Chen FH, Wang XT, You QD, et al. HIF-1alpha is critical for hypoxia-mediated maintenance of glioblastoma stem cells by activating Notch signaling pathway. Cell death and differentiation. 2012;19:284–294. doi: 10.1038/cdd.2011.95. [DOI] [PMC free article] [PubMed] [Google Scholar]
- Raman V, Artemov D, Pathak AP, Winnard PT, Jr, McNutt S, Yudina A, Bogdanov A, Jr, Bhujwalla ZM. Characterizing vascular parameters in hypoxic regions: a combined magnetic resonance and optical imaging study of a human prostate cancer model. Cancer research. 2006;66:9929–9936. doi: 10.1158/0008-5472.CAN-06-0886. [DOI] [PubMed] [Google Scholar]
- Ranganathan P, Weaver KL, Capobianco AJ. Notch signalling in solid tumours: a little bit of everything but not all the time. Nature reviews Cancer. 2011;11:338–351. doi: 10.1038/nrc3035. [DOI] [PubMed] [Google Scholar]
- Rankin EB, Giaccia AJ. The role of hypoxia-inducible factors in tumorigenesis. Cell death and differentiation. 2008;15:678–685. doi: 10.1038/cdd.2008.21. [DOI] [PMC free article] [PubMed] [Google Scholar]
- Reddy SB, Williamson SK. Tirapazamine: a novel agent targeting hypoxic tumor cells. Expert opinion on investigational drugs. 2009;18:77–87. doi: 10.1517/13543780802567250. [DOI] [PubMed] [Google Scholar]
- Rischin D, Narayan K, Oza AM, Mileshkin L, Bernshaw D, Choi J, Hicks R, McClure B, Fyles A. Phase 1 study of tirapazamine in combination with radiation and weekly cisplatin in patients with locally advanced cervical cancer. International journal of gynecological cancer : official journal of the International Gynecological Cancer Society. 2010a;20:827–833. doi: 10.1111/IGC.0b013e3181dc827e. [DOI] [PubMed] [Google Scholar]
- Rischin D, Peters LJ, O’Sullivan B, Giralt J, Fisher R, Yuen K, Trotti A, Bernier J, Bourhis J, Ringash J, et al. Tirapazamine, cisplatin, and radiation versus cisplatin and radiation for advanced squamous cell carcinoma of the head and neck (TROG 02.02, HeadSTART): a phase III trial of the Trans-Tasman Radiation Oncology Group. Journal of clinical oncology : official journal of the American Society of Clinical Oncology. 2010b;28:2989–2995. doi: 10.1200/JCO.2009.27.4449. [DOI] [PubMed] [Google Scholar]
- Rosenbloom KR, Sloan CA, Malladi VS, Dreszer TR, Learned K, Krikip VM, Wong MC, Maddren M, Fang R, Heitner SG, et al. ENCODE data in the UCSC Genome Browser: year 5 update. Nucleic Acids Research. 2013;41:D56–D63. doi: 10.1093/nar/gks1172. [DOI] [PMC free article] [PubMed] [Google Scholar]
- Santolini E, Puri C, Salcini AE, Gagliani MC, Pelicci PG, Tacchetti C, Di Fiore PP. Numb is an endocytic protein. J Cell Biol. 2000;151:1345–1352. doi: 10.1083/jcb.151.6.1345. [DOI] [PMC free article] [PubMed] [Google Scholar]
- Seidel S, Garvalov BK, Wirta V, von Stechow L, Schanzer A, Meletis K, Wolter M, Sommerlad D, Henze AT, Nister M, et al. A hypoxic niche regulates glioblastoma stem cells through hypoxia inducible factor 2 alpha. Brain. 2010;133:983–995. doi: 10.1093/brain/awq042. [DOI] [PubMed] [Google Scholar]
- Semenza GL. Intratumoral hypoxia, radiation resistance, and HIF-1. Cancer cell. 2004;5:405–406. doi: 10.1016/s1535-6108(04)00118-7. [DOI] [PubMed] [Google Scholar]
- Sherry MM, Reeves A, Wu JK, Cochran BH. STAT3 is required for proliferation and maintenance of multipotency in glioblastoma stem cells. Stem Cells. 2009;27:2383–2392. doi: 10.1002/stem.185. [DOI] [PMC free article] [PubMed] [Google Scholar]
- Singh SK, Hawkins C, Clarke ID, Squire JA, Bayani J, Hide T, Henkelman RM, Cusimano MD, Dirks PB. Identification of human brain tumour initiating cells. Nature. 2004;432:396–401. doi: 10.1038/nature03128. [DOI] [PubMed] [Google Scholar]
- Soeda A, Park M, Lee D, Mintz A, Androutsellis-Theotokis A, McKay RD, Engh J, Iwama T, Kunisada T, Kassam AB, et al. Hypoxia promotes expansion of the CD133-positive glioma stem cells through activation of HIF-1alpha. Oncogene. 2009;28:3949–3959. doi: 10.1038/onc.2009.252. [DOI] [PubMed] [Google Scholar]
- Son MJ, Woolard K, Nam DH, Lee J, Fine HA. SSEA-1 is an enrichment marker for tumor-initiating cells in human glioblastoma. Cell stem cell. 2009;4:440–452. doi: 10.1016/j.stem.2009.03.003. [DOI] [PMC free article] [PubMed] [Google Scholar]
- Studer L, Csete M, Lee SH, Kabbani N, Walikonis J, Wold B, McKay R. Enhanced proliferation, survival, and dopaminergic differentiation of CNS precursors in lowered oxygen. The Journal of neuroscience : the official journal of the Society for Neuroscience. 2000;20:7377–7383. doi: 10.1523/JNEUROSCI.20-19-07377.2000. [DOI] [PMC free article] [PubMed] [Google Scholar]
- Wang J, Wakeman TP, Lathia JD, Hjelmeland AB, Wang XF, White RR, Rich JN, Sullenger BA. Notch promotes radioresistance of glioma stem cells. Stem Cells. 2010;28:17–28. doi: 10.1002/stem.261. [DOI] [PMC free article] [PubMed] [Google Scholar]
- Williamson SK, Crowley JJ, Lara PN, Jr, McCoy J, Lau DH, Tucker RW, Mills GM, Gandara DR, Southwest Oncology Group Trial, S Phase III trial of paclitaxel plus carboplatin with or without tirapazamine in advanced non-small-cell lung cancer: Southwest Oncology Group Trial S0003. Journal of clinical oncology : official journal of the American Society of Clinical Oncology. 2005;23:9097–9104. doi: 10.1200/JCO.2005.01.3771. [DOI] [PubMed] [Google Scholar]
- Wilson WR, Hay MP. Targeting hypoxia in cancer therapy. Nature reviews Cancer. 2011;11:393–410. doi: 10.1038/nrc3064. [DOI] [PubMed] [Google Scholar]
- Yahyanejad S, King H, Iglesias VS, Granton PV, Barbeau LM, van Hoof SJ, Groot AJ, Habets R, Prickaerts J, Chalmers AJ, et al. NOTCH blockade combined with radiation therapy and temozolomide prolongs survival of orthotopic glioblastoma. Oncotarget. 2016;7:41251–41264. doi: 10.18632/oncotarget.9275. [DOI] [PMC free article] [PubMed] [Google Scholar]
- Zheng X, Linke S, Dias JM, Zheng X, Gradin K, Wallis TP, Hamilton BR, Gustafsson M, Ruas JL, Wilkins S, et al. Interaction with factor inhibiting HIF-1 defines an additional mode of cross-coupling between the Notch and hypoxia signaling pathways. Proceedings of the National Academy of Sciences of the United States of America. 2008;105:3368–3373. doi: 10.1073/pnas.0711591105. [DOI] [PMC free article] [PubMed] [Google Scholar]
- Zhu TS, Costello MA, Talsma CE, Flack CG, Crowley JG, Hamm LL, He X, Hervey-Jumper SL, Heth JA, Muraszko KM, et al. Endothelial cells create a stem cell niche in glioblastoma by providing NOTCH ligands that nurture self-renewal of cancer stem-like cells. Cancer research. 2011;71:6061–6072. doi: 10.1158/0008-5472.CAN-10-4269. [DOI] [PMC free article] [PubMed] [Google Scholar]
Associated Data
This section collects any data citations, data availability statements, or supplementary materials included in this article.