Abstract
The effects of thermal oxidation at 60 °C on tocopherols (α, β, γ) and phenolic compounds (hydroxytyrosol and tyrosol) of olive oil were studied. Tocopherols were determined by HPLC and phenolic compounds by HPLC and GC–MS. Peroxide value of olive oil increased with treatment time until it reached to 56.6 meq/kg. α-Tocopherol, β-tocopherol and γ-tocopherol contents of olive oil decreased with treatment time. α-Tocopherol in olive oil was decomposed after 63 days of treatment. β-Tocopherol in olive oil was depleted after 33 days of treatment. The reduction in γ-tocopherol of olive oil was 75% after 63 days of treatment. The degradation of hydroxytyrosol in olive oil was 91% after 63 days of treatment. Tyrosol was more stable than hydroxytyrosol in olive oil. Inverse correlations of peroxide value with hydroxytyrosol, α-Tocopherol, β-tocopherol and γ-tocopherol were observed.
Keywords: Olive oil, Tocopherol, Phenolic compound, Thermal treatment, Oxidation
Introduction
Virgin olive oil contains a great variety of minor compounds, some of which are valuable functional components (Chen et al. 2011; Tsimidou 2010). Olive oil contains monoacylglycerols, diacylglycerols, triacylglycerols, free fatty acids, hydrocarbons, sterols, tocopherols and phenolic compounds (Boskou et al. 2006a, b). It has high amount of α-tocopherol and low amount of β-tocopherol and γ-tocopherol (Parcerisa et al. 2000). α-Tocopherol comprises 90% of the total tocopherol in virgin olive oil (Boskou et al. 2006a, b). Beside the highly fat soluble tocopherols, olive oil contains a variety of more polar phenolic compounds, which contribute significantly to the stability of olive oil. Among these, tyrosol and hydroxytyrosol are the most important (Boskou et al. 2006a, b).
Oxidation of vegetable oils during storage changes their organoleptic properties and affects the shelf life of these products. This process depends on fatty acid composition, availability of oxygen, temperature and antioxidant content of oils (Mateos et al. 2003). Oil must be stored in dark, well closed and filled almost completely to ensure the lowest head space for preventing rancidity (Rastrelli et al. 2002). Tocopherols and phenolic compounds are responsible for the oxidative stability of olive oil (Mateos et al. 2003). Tocopherols provide oxidative stability to olive oil stored in the dark (autoxidation) and under light (photo-oxidation) (Tsimidou 2010). Also the more polar phenolic compounds contribute to the stability of olive oil (Baccouri et al. 2008). Some phenolic compounds have synergic effect with α-tocopherol, which contributes to further stabilization (Deiana et al. 2002). Pellegrini et al. (2001) reported that certain polyphenols are effective stabilizers of α-tocopherol during heating of olive oil.
Tyrosol is the major phenolic compound in virgin olive oil (comprising 71% of total phenols), followed by hydroxytyrosol (comprising 18% of total phenols) (Kalogeropoulos et al. 2007). Hydroxytyrosol has a strong antioxidant effect and the addition of hydroxytyrosol to virgin olive oil decreases oxidation progress of the olive oil (Mancebo-Campos et al. 2014). Tyrosol has lower antioxidant activity than hydroxytyrosol (Mateos et al. 2003). Thus, hydroxytyrosol is decomposed before tyrosol during oxidation of olive oil (Gómez-Alonso et al. 2002). The level of tyrosol in olive oil remains steady in contrast to hydroxytyrosol (Hrncirik and Fritsche 2005). α-Tocopherol has lower antioxidant activity than hydroxytyrosol (Mateos et al. 2003). γ-Tocopherol shows high resistance to oxidation (Hrncirik and Fritsche 2005).
Baccouri et al. (2008) reported that virgin olive oils showed good correlation between the oxidative stability and α-tocopherol concentration. Aparicio et al. (1999) investigated the effect of various compounds on virgin olive oil stability and observed that phenolic content contributes around 50% of stability, while tocopherol content especially α-tocopherol contributes around 9% to stability of virgin olive oil. Şahin et al. (2017 ) reported that olive leaf extract which contains oleuropein improved antioxidant capacity of the olive oil and increased the stability. Okogeri and Tasioula-Margari (2002) reported that peroxide value of virgin olive oil was 34.7 meq/kg after storage under light for 6 months, while 25.8 meq/kg after storage in the dark for 12 months. Gómez-Alonso et al. (2007) investigated the effects of storage (21 months) at room temperature in darkness on α-tocopherol content of olive oil and observed that total reduction in α-tocopherol content after storage ranged from 12 to 23%. Deiana et al. (2002) investigated the depletion of α-tocopherol and formation of hydroperoxides in virgin olive oil stored at room temperature (20–25 °C) for 7 months in dark and observed a decrease in α-tocopherol and increase in peroxide value of virgin olive oil during storage. Bešter et al. (2008) reported that hydroxytyrosol contents of olive oils were reduced to while tyrosol content increased after thermal treatment at 100 °C for 142 h. The degradation rate of hydroxytyrosol was higher than tyrosol in olive oil during heating.
To the best of our knowledge, in literature, there is no study investigating the change in β-tocopherol content of virgin olive oil during thermal oxidation at 60 °C has not been reported so far. The changes in phenolic compounds and tocopherols (α, γ) at different oxidative stages of virgin olive oil have been studied by some researchers. In contrast to these studies, the different surface area of oil during thermal oxidation was used in this study. The objective of this study was to investigate the changes in tocopherols (α, β, γ) and phenolic compounds (hydroxytyrosol, tyrosol) of virgin olive oil during thermal oxidation at 60 °C in order to detect correlations between minor components and peroxide value during accelerated oxidation.
Materials and methods
Material
Olive oil sample was purchased from local market (Vienna) and was stored at 4 °C until analysis. The oil was declared as “extra virgin” and fulfilled the quality criteria laid down in EU regulation (EEC) No 2568/91.
Storage stability test
Olive oil sample (700 mL) was stored in darkness at 60 °C in open transparent glass vessel (1000 mL, 105 mm i.d.). Certain amount of sample was taken out of the oven at regular intervals. The process of oxidation was followed by peroxide value analysis. The remainder of the sample was stored in a freezer at −20 °C for subsequent analysis of tocopherols and phenolic compounds.
Oxidative stability
The induction time for oxidation was measured by Rancimat apparatus (Metrohm, Herisau, Switzerland). Determinations were performed at 100 and 120 °C. The results were expressed as induction time (hours).
Peroxide value
Peroxide value was determined according to the method described in Regulation European Economic Commission (1992). Oil (1 g) was mixed with chloroform/acetic acid (10 mL/15 mL) solution. After addition of saturated potassium iodide solution (1 mL) to the mixture, it was left for 5 min in darkness. After reaction, the mixture was diluted with 75 mL of water. The free iodide was then titrated with a sodium thiosulphate solution (0.002M). The peroxide value was expressed in milliequivalents of oxygen per kg of oil. Samples were analysed in duplicate.
HPLC analysis of tocopherols
Sample preparation and calibration were performed according to DGF standard method F-II 4a (Deutsche_Gesellschaft_für_Fettwissenschaft, e.V., Standardmethode F-II 4a (00), in Deutsche Einheitsmethoden 2000, Wissenschaftliche Verlagsgesellschaft mbH: Stuttgart). Virgin olive oil samples (1 g) were dissolved in hexane (25 mL). This solution was analysed by a Shimadzu HPLC on a Supelco NH2–NP column (25 cm × 4.6 mm, 5 μm) by using a fluorescence detector (RF 535), set to 295 nm (Ex) and 340 nm (Em). The mobile phase was hexane/ethyl acetate (70:30, v/v) at a flow rate of 1.6 mL/min. The run time was 7 min. The sample injection volume was 20 μL.
Concentrations of tocopherols (α, β, γ) were calculated from integral areas of the samples and the corresponding calibration curves of external standards (Sigma–Aldrich, St. Louis, MO, USA). Samples were analysed in duplicate.
Extraction of phenolic compounds
Extraction of phenolic compounds was performed following procedure described by Pirisi et al. (2000). Briefly, 2 mL of methanol/water (60:40, v/v) and 1 mL of hexane were added to 2 g of olive oil and mixed with a vortex for 2 min. The mixture was centrifuged (1100 rpm, 5 min). The methanolic phase was separated from the oily phase. The extraction was repeated twice. The methanolic extracts were combined and dried under argon. Samples were dissolved in 2 mL of methanol and filtered through a 0.49 μm nylon filter for HPLC analysis.
HPLC analysis of phenolic compounds
Quantification of phenolic compounds was carried out by HPLC (Accela, Germany) with diode array detector (DAD) at 280 nm according to the method reported by Selvaggini et al. (2006). The column used was Intersil ODS-2 (250 mm × 4 mm i.d.) with a particle size of 5 μm. The mobile phase consisted of 0.2% acetic acid in water (pH 3.1) (solvent A) and methanol (solvent B). The flow rate was 0.5 mL/min. The gradient programme of solvent was: solvent B increased from 10 to 70% in 100 min.
Concentrations of tyrosol and hydroxytyrosol were calculated from integral areas of the samples and the corresponding calibration curves of external standards (Sigma–Aldrich, St. Louis, MO, USA). Samples were analysed in duplicate.
GC–MS analysis of phenolic compounds
The dry sample was derivatized with 100 μL of pyridine and 100 µL of bis-(trimethylsilyl) trifluoracetamide and trimethylchlorosilane (BSTFA:TMCS 99:1, Sigma). The mixture was shaken and heated at 60 °C for 60 min. (Owen et al. 2000). After derivatization, the sample was re-dissolved in 1 mL of hexane.
The analysis of phenolic compounds by GC–MS was performed according to the method of Tasioula-Margari and Okogeri (2001). GC–MS analysis was performed with a Thermo DSQ II GC–MS (Thermo Fisher Scientific, Inc. USA) equipped with mass selective detector, split/splitless injector and a HP-5 fused silica capillary column (Agilent, Santa Clara, CA, USA; 30 m × 0.25 mm i.d., 0.25 μm film thickness). The carrier gas was helium. Injector temperature was set at 315 °C. The temperature programme used was; 70–135 °C at 2 °C/min and 10 min at 135 °C, 135–220 °C at 4 °C/min and 10 min at 220 °C, 220–270 °C at 3.5 °C/min and 20 min at 270 °C.
Regression analysis
Regression analysis was established between treatment time and variables (peroxide value, α-tocopherol, β-tocopherol, γ-tocopherol, hydroxytyrosol, tyrosol) by using Excel.
Results and discussion
Oxidative stability
Stability data can be used to deduce information about the shelf life of an oil and provide a general estimation on oil quality (Aparicio et al. 1999). The stabilities of olive oil were found as 85.8 h at 100 °C and 17.6 h at 120 °C. The oxidative stability of olive oil at 100 °C is in agreement with literature. Bešter et al. (2008) reported that the oxidative stabilities of olive oils at 100 °C were 114.3 h (cv. Istrska belica) and 78.4 h (cv. Leccina). The oxidative stability of olive oil at 120 °C was higher than that obtained by Malheiro et al. (2012). The authors reported that oxidative stability of unheated olive oil at 120 °C was 11.47 h. This could be due to the difference in the content of antioxidants. Del Carlo et al. (2004) reported that oxidative stabilities of olive oils were influenced by total polyphenol content.
Peroxide value
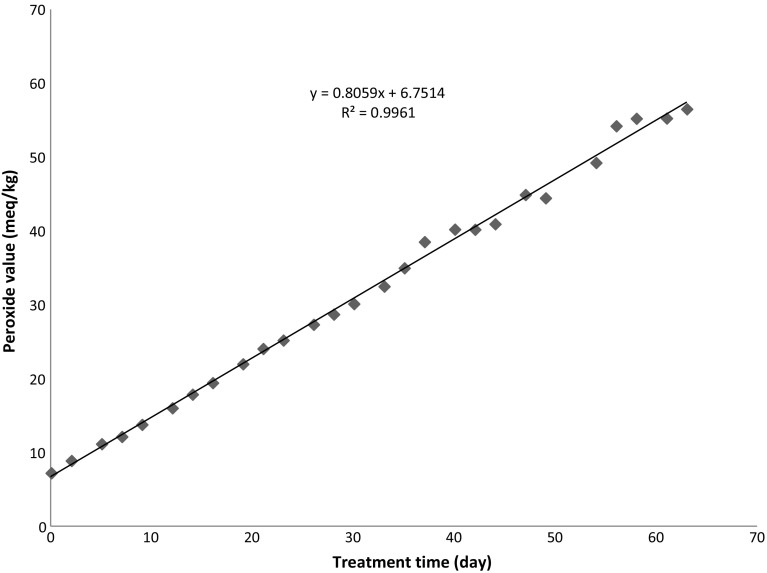
Figure 1 shows change in peroxide value of the olive oil sample during thermal treatment at 60 °C. Degree of oxidation during thermal treatment of olive oil was determined by the formation of hydroperoxides which expresses as peroxide value. The peroxide value of olive oil sample before thermal treatment was 7.2 meq/kg which was below maximum permitted limit (20 meq/kg). During thermal treatment at 60 °C for 63 days, the increase in the peroxide value was linear (Fig. 1), so the reaction kinetics followed a pseudo-zero-order (r2 = 1.00). Peroxide value of olive oil increased with treatment time until it reached to maximum value (56.6 meq/kg). The results obtained are similar to those of Hrncirik and Fritsche (2005). The authors reported that peroxide value of virgin olive oil subjected to accelerated storage conditions at 60 °C increased with increasing of oxidation time and reached to a maximum value due to hydroperoxide formation.
Fig. 1.
Changes in the peroxide value of olive oil during treatment
Tocopherols
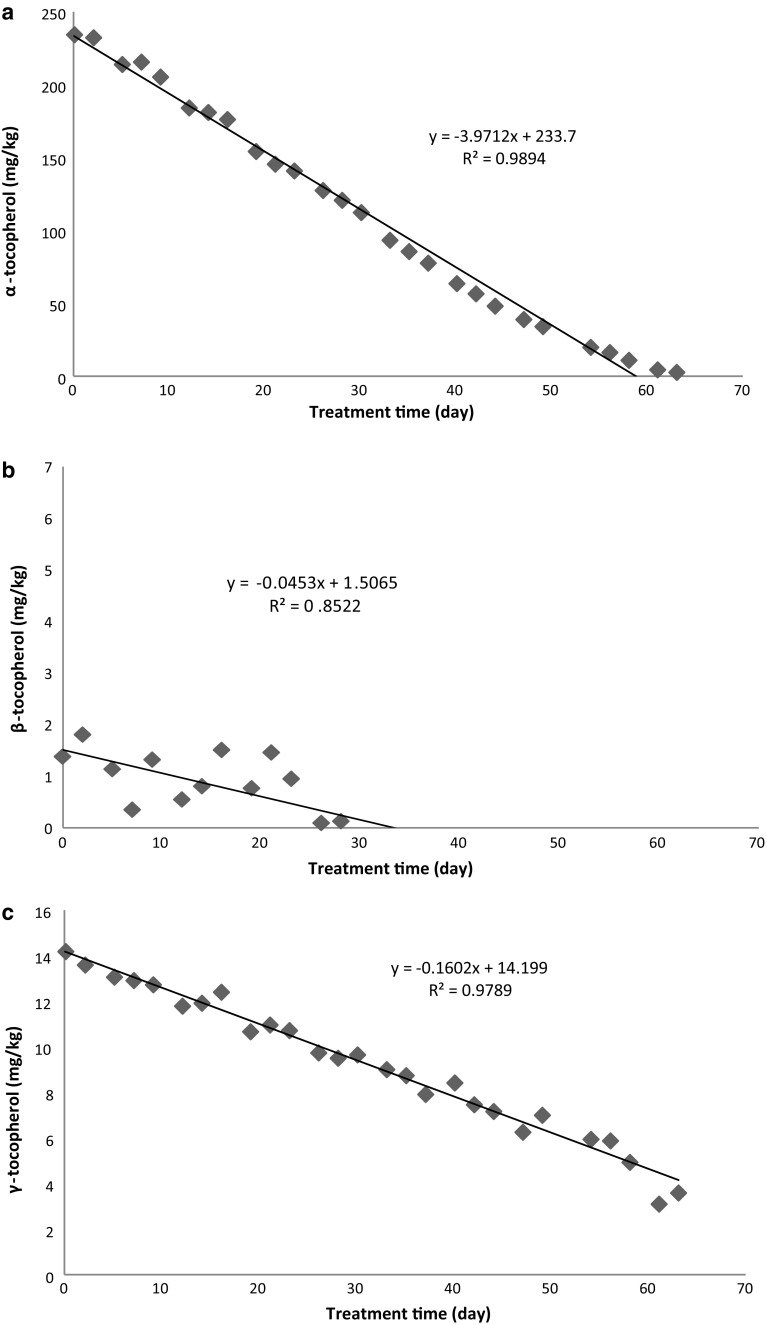
Figure 2 shows changes in α-, β-, and γ-tocopherol of olive oil during thermal treatment at 60 °C. The initial levels of α-tocopherol, β-tocopherol and γ-tocopherol were 235, 1.4 and 15.0 mg/kg, respectively. The results were similar to those reported by Ballus et al. (2014). The authors reported α-tocopherol, β-tocopherol and γ-tocopherol content of virgin olive oil as 29–233 mg/kg, ND-9.6 mg/kg and ND-19 mg/kg, respectively. During thermal treatment, tocopherol content decreased gradually in sample. The decrease of the α-tocopherol during thermal treatment at 60 °C for 63 days was linear (r2 = 0.99). During thermal treatment, the decrease in β-tocopherol was also roughly linear (r2 = 0.85). γ-Tocopherol decreased also linearly (r2 = 0.98) during thermal treatment. The final values of α-tocopherol, and γ-tocopherol were found as 2.95 and 3.61 mg/kg, respectively, whereas β tocopherol could not be detected any more. α-Tocopherol in olive oil decreased by 99% at peroxide value of 56.6 meq/kg. At this peroxide value, 25% of γ-tocopherol remained in olive oil. β-Tocopherol in olive oil was depleted after 33 days. The treatment time, at which γ-tocopherol would have been depleted, can be estimated from the equation of linear regression. This time is approximately 89 days. These results are compatible with those from the literature. Bešter et al. (2008) reported that α-tocopherol contents of virgin olive oils were reduced below the limit of quantification (2 mg/kg) after thermal treatment (100 °C for 142 h). Hrncirik and Fritsche (2005) investigated the effect of storage conditions on antioxidant system in virgin olive oil. The authors observed that degradation of α-tocopherol was completed at about 70% of the induction period, while γ-tocopherol was depleted by the end of the induction period at 60 °C.
Fig. 2.
Changes in α-tocopherol (a), β-tocopherol (b) and γ-tocopherol (c) contents of olive oil during treatment
Phenolic compounds of olive oil by HPLC
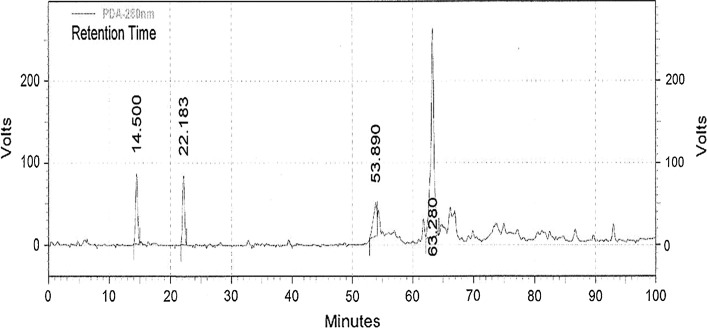
Figure 3 shows a HPLC chromatogram of phenolic compounds of olive oil. The main phenolic compounds found in olive oil were hydroxytyrosol and tyrosol. Hydroxytyrosol (peak 1) had a retention time of 14.5 min and tyrosol (peak 2) eluted at 22.18 min. The concentration of tyrosol (23.8 mg/kg) in untreated olive oil was higher than that of hydroxytyrosol (2.7 mg/kg). These results were in agreement with those of Laincer et al. (2014). The authors reported that the concentration of tyrosol in olive oil ranged from 2 to 28 mg/kg, while that of hydroxytyrosol ranged from 0.5 to 5 mg/kg.
Fig. 3.
HPLC chromatogram of phenolic compounds in olive oil. Retention times: (14.500 min) Hydroxytyrosol; (22.183 min) Tyrosol
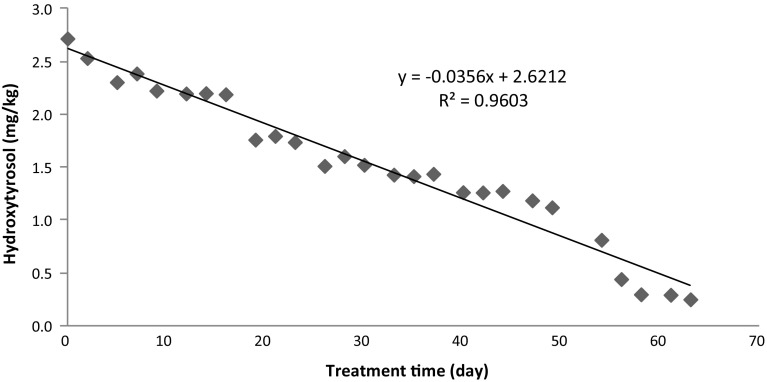
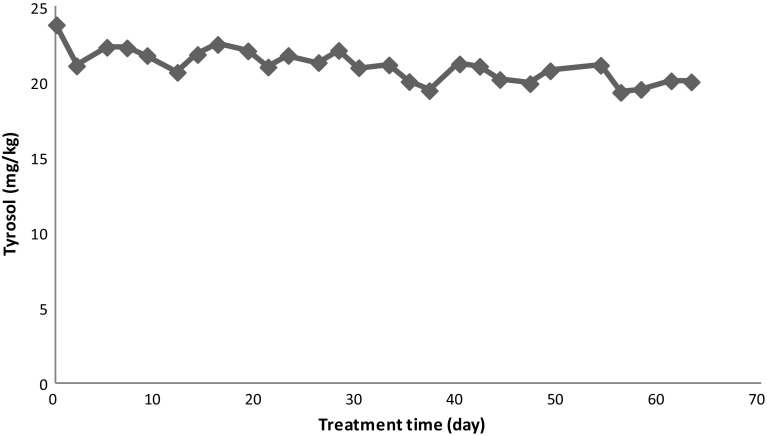
Changes in the contents of hydroxytyrosol and tyrosol are given in Figs. 4 and 5. The content of hydroxytyrosol decreased with increase in treatment time, while tyrosol remained stable. There was a linear relationship between hydroxytyrosol and treatment time, confirmed by the high value of r2 (0.96). Hydroxytyrosol content of olive oil was reduced from 2.72 to 0.25 mg/kg, while tyrosol content was reduced from 23.81 to 20.02 mg/kg after treatment at 60 °C for 63 days. The decrease in hydroxytyrosol with treatment time at 60 °C after 63 days was 91%. The lower decrease (16%) was observed for tyrosol at the same conditions. This means that hydroxytyrosol provides high oxidative stability to olive oil at 60 °C, while tyrosol has less antioxidant effect to olive oil. This indicated that antioxidant power of hydroxytyrosol was higher than tyrosol (Cheikhousman et al. 2005). Gómez-Alonso et al. (2002) reported that the high antioxidant activity of hydroxytyrosol favours its degradation and disappearance. Hrncirik and Fritsche (2005) reported that hydroxytyrosol was reduced during accelerated storage (60 °C), while tyrosol showed high stability against oxidation.
Fig. 4.
Changes in hydroxytyrosol content of olive oil during treatment
Fig. 5.
Changes in tyrosol content of olive oil during treatment
Phenolic compounds of olive oil by GC–MS
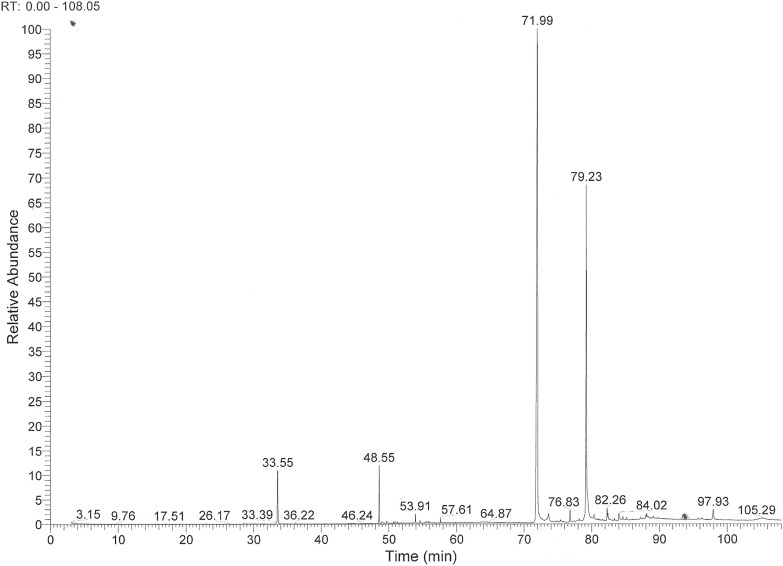
Figure 6 shows a GC–MS chromatogram of phenolic compounds of virgin olive oil. Tyrosol with retention time of 33.55 min and hydroxytyrosol with retention time of 48.55 min were identified by their mass spectra. The peaks with retention times between 71.99 and 79.23 min correspond to complex phenols linked to tyrosol and hydroxytyrosol. Mass spectra of these peaks were determined by the presence of a main peak at m/z 192 corresponding to compound containing tyrosol and at m/z 280 corresponding to compound containing hydroxytyrosol. These results were identical to those reported by Tasioula-Margari and Okogeri (2001).
Fig. 6.
GC–MS chromatogram of phenolic compounds in olive oil. Retention times: (33.55 min) Tyrosol; (48.55 min) Hydroxytyrosol; (71.99–79.23 min) Compounds linked to tyrosol and hydroxytyrosol
Correlation
A positive correlation (r = 0.99) was established between treatment time and peroxide value. Inverse correlations were obtained between treatment time and α-tocopherol (r = −0.99), between treatment time and β-tocopherol (r = −0.92), between treatment time and γ-tocopherol (r = −0.98). A good inverse correlation between treatment time and hydroxytyrosol (r = −0.97) was also observed. The inverse correlation between treatment time and tyrosol (r = −0.75) was low.
Inverse correlations of peroxide value with hydroxytyrosol, α-Tocopherol, β-tocopherol and γ-tocopherol were observed. Tyrosol did not show a correlation with peroxide value due to lack of antioxidant activity. This result is in agreement with the result reported by Arslan et al. (2013).
There were positive correlation of hydroxytyrosol with α-tocopherol (r = 0.90), β-tocopherol (r = 0.89) and γ-tocopherol (r = 0.97).
Conclusion
Olive oil contains functional minor compounds which are, beside tocopherols, more polar phenolic compounds. This study was performed to investigate the effects of thermal oxidation at 60 °C on tocopherols (α, β, γ) and phenolic compounds (hydroxytyrosol, tyrosol) in olive oil. Peroxide values of olive oil increased with increasing of treatment time due to the formation of hydroperoxides. Tocopherol content decreased gradually during thermal treatment. α-Tocopherol and β-tocopherol were decomposed after thermal treatment, while some of γ-tocopherol remained in olive oil. This result indicated that the stability of γ-tocopherol to oxidation was higher than that of α-tocopherol and β-tocopherol. The amount of β-tocopherol in olive oil was low, so it quickly fell below the detection limit. Tyrosol content in untreated olive oil was higher than hydroxytyrosol content. After treatment at 60 °C for 63 days 91% of hydroxytyrosol in olive oil was destroyed, whereas most of tyrosol (84%) remained. Most of hydroxytyrosol was destroyed after 63 days, while tyrosol was more stable compound. This indicates that hydroxytyrosol is first phenolic compound to be oxidized during thermal treatment, providing high oxidative stability to the olive oil. Tyrosol is phenolic compound that decreased with the lowest rate during thermal treatment. So it provides low oxidative stability to the olive oil with less antioxidant activity. Phenolic compounds of olive oil have an antioxidant effect which decreases in the order: hydroxytyrosol > tyrosol. All tocopherols and also hydroxytyrosol were decomposed in a rather similar fashion (linear). There were good correlations between hydroxytyrosol and tocopherols (α, β, γ).
Acknowledgements
The research was supported by the post doctorate research scholarship from the Turkish Council of Higher Education (YÖK).
References
- Aparicio R, Roda L, Albi MA, Gutiérrez F. Effect of various compounds on virgin olive oil stability measured by Rancimat. J Agric Food Chem. 1999;47:4150–4155. doi: 10.1021/jf9812230. [DOI] [PubMed] [Google Scholar]
- Arslan D, Karabekir Y, Schreiner M. Variations of phenolic compounds, fatty acids and some qualitative characteristics of Sarıulak olive oil as induced by growing area. Food Res Int. 2013;54:189–1906. doi: 10.1016/j.foodres.2013.06.016. [DOI] [Google Scholar]
- Baccouri O, Guerfel M, Baccouri B, Cerretani L, Bendini A, Lercker G, Zarrouk M, Ben Miled DD. Chemical composition and oxidative stability of Tunisian monovarietal virgin olive oils with regard to fruit ripening. Food Chem. 2008;109:743–754. doi: 10.1016/j.foodchem.2008.01.034. [DOI] [PubMed] [Google Scholar]
- Ballus CA, Meinhart AD, Campos FASJ, Silva LFO, Oliveira AF, Godoy HT. A quantitative study on the phenolic compound, tocopherol and fatty acid contents of monovarietal virgin olive oils produced in the southeast region of Brazil. Food Res Int. 2014;62:74–83. doi: 10.1016/j.foodres.2014.02.040. [DOI] [Google Scholar]
- Bešter E, Butinar B, Bučar-Miklavčič M, Golob T. Chemical changes in extra virgin olive oils from Slovenian Istra after thermal treatment. Food Chem. 2008;108:446–454. doi: 10.1016/j.foodchem.2007.10.061. [DOI] [PubMed] [Google Scholar]
- Boskou D, Blekas G, Tsimidou M. Olive oil composition. In: Boskou D, editor. Olive oil: chemistry and technology. 2. Champaign, Illinois: AOCS Publishing; 2006. pp. 41–72. [Google Scholar]
- Boskou D, Tsimidou M, Blekas G. Polar phenolic compounds. In: Boskou D, editor. Olive oil chemistry and technology. 2. Champaign, Illinois: AOCS Publishing; 2006. pp. 73–92. [Google Scholar]
- Cheikhousman R, Zude M, Bouveresse DJR, Leger CL, Rutledge DN, Birlouez-Aragon I. Fluorescence spectroscopy for monitoring deterioration of extra virgin olive oil during heating. Anal Bioanal Chem. 2005;382(6):1438–1443. doi: 10.1007/s00216-005-3286-1. [DOI] [PubMed] [Google Scholar]
- Chen H, Angiuli M, Ferrari C, Tombari E, Salvetti G, Bramanti E. Tocopherol speciation as first screening for the assessment of extra virgin olive oil quality by reversed-phase high-performance liquid chromatography/fluorescence detector. Food Chem. 2011;125:1423–1429. doi: 10.1016/j.foodchem.2010.10.026. [DOI] [Google Scholar]
- Deiana M, Rosa A, Cao CF, Pirisi FM, Bandino G, Dessi MA. Novel approach to study oxidative stability of extra virgin olive oils: importance of α-tocopherol concentration. J Agric Food Chem. 2002;50:4342–4346. doi: 10.1021/jf020033t. [DOI] [PubMed] [Google Scholar]
- Del Carlo M, Sacchetti G, Di Mattia C, Compagnone D, Mastrocola D, Liberatore L, Cichelli A. Contribution of the phenolic fraction to the antioxidant activity and oxidative stability of olive oil. J Agric Food Chem. 2004;52:4072–4079. doi: 10.1021/jf049806z. [DOI] [PubMed] [Google Scholar]
- European Economic Commission (EEC) Regulation EEC/1429/92 amending Regulation EEC2568/91 on the characteristics of olive oil and olive residue oil and on the relevant methods of analysis. Off J Eur Commun. 1992;35:17–20. [Google Scholar]
- Gómez-Alonso S, Salvador MD, Fregapane G. Phenolic compounds profile of Cornicabra virgin olive oil. J Agric Food Chem. 2002;50:6812–6817. doi: 10.1021/jf0205211. [DOI] [PubMed] [Google Scholar]
- Gómez-Alonso S, Mancebo-Campos V, Salvodor MD, Fregapane G. Evaluation of major and minor components and oxidation indices of virgin olive oil during 21 months storage at room temperature. Food Chem. 2007;100:36–42. doi: 10.1016/j.foodchem.2005.09.006. [DOI] [Google Scholar]
- Hrncirik K, Fritsche S. Relation between the endogenous antioxidant system and the quality of extra virgin olive oil under accelerated storage conditions. J Agric Food Chem. 2005;53:2103–2110. doi: 10.1021/jf048363w. [DOI] [PubMed] [Google Scholar]
- Kalogeropoulos N, Mylona A, Chiou A, Ioannou MS, Andrikopoulos NK. Retention and distribution of natural antioxidants (α-tocopherol, polyphenols and terpenic acids) after shallow frying of vegetables in virgin olive oil. LWT Food Sci Technol. 2007;40:1008–1017. doi: 10.1016/j.lwt.2006.07.003. [DOI] [Google Scholar]
- Laincer F, Laribi R, Tamendjari A, Arrar L, Rovellini P, Venturini S. Olive oils from Algeria: phenolic compounds, antioxidant and antibacterial activities. Grasas Aceites. 2014;65(1):1–10. [Google Scholar]
- Malheiro R, Casal S, Lamas H, Bento A, Pereira JA. Can tea extracts protect extra virgin olive oil from oxidation during microwave heating? Food Res Int. 2012;48:148–154. doi: 10.1016/j.foodres.2012.03.005. [DOI] [Google Scholar]
- Mancebo-Campos V, Salvodor MD, Fregapane G. Antioxidant capacity of individual and combined virgin olive oil minor compounds evaluated at mild temperature (25 and 40 °C) as compared to accelerated and antiradical assays. Food Chem. 2014;150:374–381. doi: 10.1016/j.foodchem.2013.10.162. [DOI] [PubMed] [Google Scholar]
- Mateos R, Dominguez MM, Espartero JL, Cert A. Antioxidant effect of phenolic compounds, α-tocopherol, and other minor components in virgin olive oil. J Agric Food Chem. 2003;51:7170–7175. doi: 10.1021/jf034415q. [DOI] [PubMed] [Google Scholar]
- Okogeri O, Tasioula-Margari M. Changes occuring in phenolic compounds and α-tocopherol of virgin olive oil during storage. J Agric Food Chem. 2002;50:1077–1080. doi: 10.1021/jf010895e. [DOI] [PubMed] [Google Scholar]
- Owen RW, Mier W, Giacosa A, Hull WE, Spiegelhalder B, Bartsch H. Identification of lignans as major components in the phenolic fraction of olive oil. Clin Chem. 2000;46:976–988. [PubMed] [Google Scholar]
- Parcerisa J, Casals I, Boatella J, Codony R, Rafecas M. Analysis of olive and hazelnut oil mixtures by high-performance liquid chromatography-atmospheric pressure chemical ionisation mass spectrometry of triacylglycerols and gas-liquid chromatography of non-saponifiable compounds (tocopherols and sterols) J Chromatogr A. 2000;881:149–158. doi: 10.1016/S0021-9673(00)00352-6. [DOI] [PubMed] [Google Scholar]
- Pellegrini N, Visioli F, Buratti S, Brighenti F. Direct analysis of total antioxidant activity of olive oil and studies on the influence of heating. J Agric Food Chem. 2001;49:2532–2538. doi: 10.1021/jf001418j. [DOI] [PubMed] [Google Scholar]
- Pirisi FM, Cabras P, Cao CF, Migliorini M, Magelli M. Phenolic compounds in virgin olive oil. 2. Reappraisal of the extraction. HPLC separation, and quantification procedures. J Agric Food Chem. 2000;48(4):1191–1196. doi: 10.1021/jf991137f. [DOI] [PubMed] [Google Scholar]
- Rastrelli L, Passi S, Ippolito F, Vacca G, De Simone F. Rate of degradation of α-tocopherol, squalene, phenolics, and polyunsaturated fatty acids in olive oil during different storage conditions. J Agric Food Chem. 2002;50:5566–5570. doi: 10.1021/jf011063j. [DOI] [PubMed] [Google Scholar]
- Şahin S, Sayım S, Bilgin M. Effect of olive leaf extract rich in oleuropein on the quality of virgin olive oil. J Food Sci Technol. 2017;54(6):1721–1728. doi: 10.1007/s13197-017-2607-7. [DOI] [PMC free article] [PubMed] [Google Scholar]
- Selvaggini R, Servili M, Urbani S, Esposto S, Taticchi A, Montedoro GF. Evaluation of phenolic compounds in virgin olive oil by direct injection in high-performance liquid chromatography with fluorometric detection. J Agric Food Chem. 2006;54:2832–2838. doi: 10.1021/jf0527596. [DOI] [PubMed] [Google Scholar]
- Tasioula-Margari M, Okogeri O. Isolation and characterization of virgin olive oil phenolic compounds by HPLC/UV and GC–MS. J Food Sci. 2001;66(4):530–534. doi: 10.1111/j.1365-2621.2001.tb04597.x. [DOI] [Google Scholar]
- Tsimidou MZ. Squalene and tocopherols in olive oil: importance and methods of analysis. In: Preedy VR, Watson RR, editors. Olives and olive oil in health and disease prevention. London: Academic press; 2010. pp. 561–567. [Google Scholar]


