

Abstract
Objective
Inflammation is key risk factor for several conditions in the elderly. However, the relationship between inflammation and frailty is still unclear. We investigated whether higher dietary inflammatory index (DII) scores were associated with higher incidence of frailty in a cohort of North Americans.
Design
Longitudinal with a follow-up of 8 years.
Setting
Osteoarthritis Initiative.
Participants
4,421 participants with knee osteoarthritis or at high risk.
Measurements
DII scores were calculated using the validated Block Brief 2000 Food-Frequency Questionnaire and categorized into sex-specific quartiles. Frailty was defined as two out of three of the criteria of the Study of Osteoporotic Fracture study (i.e. weight loss, inability to rise from a chair five times, and poor energy). The strength of the association between baseline DII score and incident frailty was assessed through a Cox’s regression analysis, adjusted for potential baseline confounders, and reported as hazard ratios (HRs).
Results
A total of 4,421 community-dwelling participants (2,564 females; mean age: 61.3 years) without frailty at baseline were identified from the Osteoarthritis Initiative. During 8 years of follow-up, 356 individuals developed frailty (=8.2%). Using Cox’s regression analysis, adjusting for 11 potential confounders, participants with the highest DII score (Quartile 4) had a significantly higher risk of experiencing frailty (HR: HR: 1.37; 95% CI: 1.01–1.89; p=0.04) compared to participants with the lowest DII score (Quartile 1). The association between DII score and frailty was significant only in men.
Conclusion
Higher DII scores, indicating a more pro-inflammatory diet, are associated with higher incidence of frailty, particularly in men.
Keywords: aged, dietary inflammatory index, frailty, inflammation
INTRODUCTION
Frailty is typically defined as an age-associated decline in reserve and function that result in a reduced ability to cope with acute or external stressors faced every day.1 Frailty is a common condition in the elderly, with a prevalence of 10% for those older than 65 years and 30% for those older than 80 years.2,3 Frailty is significantly associated with several deleterious outcomes in the elderly, including depression4,5, cardiovascular disease6, hospitalization7 and, in some instances, mortality.8 Consequently, understanding, preventing and managing frailty in older adults is of high importance.
Despite this increasing interest in frailty, the pathophysiological changes underlying and preceding frailty are still largely unknown. Serum markers of inflammation linearly increase with age9 probably due to a combination of factors, such as decline in immune function10 and increase in medical conditions (e.g. osteoarthritis, dementia, cardiovascular disease) associated with inflammation11. Inflammation is also associated with low muscular performance12 and it has been proposed that this condition may be closely linked with frailty.13 From a molecular point of view, pro-inflammatory cytokines may influence frailty either directly by promoting protein degradation, or indirectly, by affecting important metabolic pathways.14 However, the evidence regarding inflammation and frailty is human beings is still conflicting. In a recent systematic review and meta-analysis, we found that in 32 cross-sectional studies both frail and pre-frail participants had significantly higher levels of inflammatory markers.15 However, in four longitudinal studies16–19, higher inflammatory markers were not associated with any increased risk of frailty at follow-up, suggesting that additional findings from longitudinal studies are needed.
Diet is a key source of inflammation and the Dietary Inflammatory Index (DII) is a literature-derived dietary tool, useful for assessing the overall inflammatory potential of individual’s diet.20 Higher DII values are strongly correlated with serum inflammatory markers, suggesting a close relationship between this index and bio-humoral inflammatory parameters.21 The DII has also has been used to assessed the relationship between diet quality related to inflammation and several chronic inflammation-related outcomes, such as metabolic and respiratory diseases, cancer and fractures.22–25 However, no study has yet explored the association between DII and frailty. Therefore, the purpose of this study was to investigate whether increasing DII scores are associated with increased incidence of frailty, using a large cohort of North American adults.
MATERIALS AND METHODS
Data source and subjects
Data were included from the Osteoarthritis Initiative (OAI) database. The OAI is freely available (http://www.oai.ucsf.edu/). Within the OAI, potential participants were recruited across four clinical sites in the United States of America (Baltimore, MD; Pittsburgh, PA; Pawtucket, RI; and Columbus, OH) between February 2004 and May 2006. In this database, we identified people who either: (1) had knee OA with knee pain for a 30-day period in the past 12 months or (2) were at high risk of developing knee OA26 with data collected during baseline and screening evaluations in November 2008. All participants provided informed written consent.
The OAI study was given full ethical approval by the institutional review board of the OAI Coordinating Center, at University of California in San Francisco.
Dietary data and Dietary inflammatory index (exposure)
Dietary intake was assessed using a validated tool, the Block Brief 2000 Food Frequency Questionnaire (FFQ) during the baseline visit.27 Seventy items were assessed to determine an individual’s typical food and beverage consumption over the past year. The frequency of consumption was reported at nine levels of intake from “never” to “every day”. In addition, seven dietary behavior questions were asked regarding food preparation methods and fat intake, one question on fiber intake, and 13 questions on vitamin and mineral intakes.
The details of development of DII is described by Shivappa et al. elsewhere.20 High sensitivity CRP measurements were used to examine construct validity of the DII in a longitudinal cohort using multiple (up to 15) 24-hour dietary recall interviews and up to five 7-day dietary recalls. The DII was subsequently validated in four studies among different populations with a variety of inflammatory biomarkers (i.e., interleukin, IL-6, hs-CRP, fibrinogen, homocysteine and TNF-α).21,28–32 In this updated version of the DII, 1943 articles were reviewed and scored. Forty-five food parameters, including foods, nutrients, and other bioactive compounds, were identified based on their inflammatory effect on six specific inflammatory markers, including CRP, IL-1β, IL-4, IL-6, IL-10 and tumor necrosis factor (TNF)-α. A regionally representative world database representing diet surveys from 11 countries was used as a comparative standard for each of the 45 parameters (i.e. foods, nutrients, and other food components). Intake values from this database were used to calculate the DII scores. This is explained in more detail in the DII Methods paper.20 Briefly, a standard mean for each parameter from the representative world database was subtracted from the actual individual exposure and divided by its standard deviation to generate Z scores. These Z scores were converted to proportions (thus minimizing effects of outliers/right-skewing). These values were then doubled and 1 was subtracted to achieve symmetrical distribution with values centered on 0. The resulting value was then multiplied by the corresponding inflammatory score for each food parameter and summed across all food parameters, to obtain the overall DII score. Using the FFQ, we calculated the DII based on energy-adjusted intake of the 24 single food parameters of the 45 possible food parameters that were available from the FFQ using the energy density approach, which calculated the DII per 4184 kJ (1000 kcal) of energy.33 The 24 food parameters available for DII calculation in this study were vitamin B12, vitamin B6, β-carotene, carbohydrate, cholesterol, fat, fibre, folic acid, iron, magnesium, monounsaturated fat acids (MUFA), niacin, protein, polyunsaturated fatty acids (PUFA), riboflavin, saturated fat acids(SFA), selenium, thiamin, vitamin A, vitamin C, vitamin E, vitamin D, zinc, niacin, and caffeine.
Outcome
The study’s outcome of interest was incident frailty. In accordance with the Study of Osteoporotic Fracture (SOF) index34,35 frailty was defined as the presence of ≥2 out of three of the following criteria: (i) weight loss ≥5% taking place between baseline and the follow-up examinations (at the baseline examination a body mass index, BMI, of less than 20 Kg/m2, a common cut-off for identifying underweight people the elderly36, was used, since no information regarding weight changes were recorded); (ii) the inability to rise from a chair five times without arm support (hereafter referred to as inability to carry out chair stands); and (iii) poor energy based on the SF12 questionnaire response of “little at a time” or “none at a time” to the question “in the past 4 weeks, did you have a lot of energy?” The assessment of the outcome was made at the baseline and during the V01 (12 months), V03 (24 months), V05 (36 months), V06 (48 months), V08 (72 months) and V10 (96 months).
Covariates
Ten covariates (other than the number of frailty indexes at baseline) were identified a priori as potential confounding factors. These included: body mass index (BMI); physical activity evaluated using the total score for the Physical Activity Scale for the Elderly scale (PASE)37; race; smoking habit; educational attainment level (college or higher vs. others); yearly income (< or ≥ $50,000 or missing data); depressive symptoms assessed with the Center for Epidemiologic Studies Depression Scale (CES-D)38; and a validated general health measure of self-reported comorbidities assessed through the modified Charlson Comorbidity Index score.39
Statistical analyses
Data on continuous variables were normally distributed according to the Kolmogorov-Smirnov test. Data were presented as means and standard deviation values (SD) for quantitative measures, and frequency and percentages for all discrete variables. For descriptive purposes, only the data regarding the lowest and the highest quartiles are reported. Since the interaction sex by DII scores was significant (p<0.05) in predicting frailty at follow-up, the data are presented also by gender. Levene’s test was used to test the homoscedasticity of variances and, if its assumption was violated, Welch’s ANOVA was used. P-values were calculated using the Jonckheere-Terpstra test40 for continuous variables and the Mantel-Haenszel Chi-square test for categorical variables.
To assess the relationship between DII score and incident frailty, a Cox’s regression analysis was conducted where the incident frailty was defined as the discrete ‘outcome,’ time-to-event was the temporal factor, and the DII score was the ‘exposure’. Deceased people were censored. DII also was categorized into gender-specific quartiles, with Quartile 1 (=lowest DII) representing the reference group. The basic model was not adjusted for any confounders. The fully adjusted model included the following covariates: age (as continuous); sex (only for the analyses for the sample as whole); race (Whites vs. others); BMI (as continuous); education (≥college degree vs. others); smoking habits (current and previous vs. others); yearly income (categorized as ≥ or < US$50,000 or missing data); Charlson Comorbidity Index; PASE score (as continuous); CES-D (as continuous); number of frailty indexes at baseline (one vs. none).
Multi-collinearity among covariates was assessed through variance inflation factor (VIF)41, taking a cut-off of 2 as the criterion for exclusion. No covariates met this criterion and therefore none was excluded for this reason. Adjusted hazard ratios (HR) and 95% confidence intervals (CI) were calculated to estimate the strength of the associations between DII score (reported as quartiles) and incident frailty. P values for trend were calculated across DII groups using the Wald test, based on a score derived from the median value of each baseline DII group. We finally modelled DII as continuos variable, reporting the association between increase in one SD as exposure variable.
Several sensitivity analyses were conducted evaluating the interaction between DII score and selected factors [i.e., age below or more/equal than 65 years, overweight/obese (≥25kg/m2) vs. normal weight (18.5kg/m2<BMI ≥25kg/m2), yearly income, gender, race, education, smoking habits, yearly income, number of frailty index at baseline categorized as one vs. none) in the association with frailty, but only sex emerged as moderator of our findings (p<0.05 for the interaction).
A p<0.05 was deemed statistically significant. All analyses were performed using SPSS® software version 21.0 for Windows (SPSS Inc., Chicago, Illinois).
RESULTS
Sample selection
The OAI dataset initially included a total of 4,796 individuals. For 129 participants, there was insufficient data to calculate DII or an unreliable caloric intake was recorded (<500 or >5000 Kcal/day) (n=62). Finally, data from another 184 participants were lost during follow-up (they did not have sufficient information regarding frailty items). Accordingly, 4,421 participants were included in analyses.
Descriptive characteristics
The cohort consisted of 2,564 females (58.0%). Mean age was 61.3 years (±9.3 years; range: 45–79 years) and mean DII was −3.17 (±1.67 points; range: −5.65 to 3.70).
Table 1 illustrates the baseline characteristics by DII quartiles in the sample as whole and by gender. Those in the highest DII quartile (reflecting the most pro-inflammatory diets) were significantly younger and have lower educational attainment than other participants. Participants with higher DII levels were more likely to be smokers (only in women), non-White, obese (as shown by higher BMI values), and depressed compared to individuals in other quartiles (Table 1). Individuals with higher DII values had a significantly higher prevalence of poor physical performance (p for trend<0.0001), but lower presence of weight loss (p for trend=0.002), even if this last finding was limited only in women (p for trend<0.0001). There no differences across DII groups with respect to poor chair stands time.
Table 1.
Characteristics of the participants classified according to their baseline dietary inflammatory index.
| All sample | Men | Women | |||||
|---|---|---|---|---|---|---|---|
|
| |||||||
| Q1 (n=1106) DII |
Q4 (n=1105) DII |
Q1 (n=464) DII |
Q4 (n=464) DII |
Q1 (n=1106) DII |
Q4 (n=1105) DII |
||
| General characteristics | |||||||
| Age (years) | 63.1 (8.9) | 58.8 (9.0)*** | 63.1 (9.2) | 58.6 (9.4)*** | 63.2 (8.7) | 59.0 (8.7)*** | |
| PASE (points) | 165.9 (82.6) | 158.7 (80.8) | 180.0 (89.6) | 169.9 (81.2) | 156.0 (76.0) | 150.7 (79.2) | |
| White race (n, %) | 906 (82.1) | 821 (74.4)*** | 400 (86.4) | 370 (79.9)*** | 506 (79.1) | 451 (70.4)*** | |
| Smoking (previous/current) (n, %) | 490 (44.5) | 569 (51.7)** | 228 (49.4) | 245 (53.1) | 262 (41.1) | 324 (50.7)*** | |
| Graduate degree (n, %) | 412 (37.3) | 275 (25.0)*** | 215 (46.3) | 134 (29.1)*** | 197 (30.7) | 141 (22.0)*** | |
| Yearly income (≥ $50,000) | 686 (62.1) | 603 (54.6)** | 332 (71.6) | 305 (65.7)* | 354 (55.2) | 298 (46.5)* | |
|
| |||||||
| Medical conditions | |||||||
| BMI (Kg/m2) | 27.4 (4.4) | 29.8 (5.1)*** | 27.7 (3.8) | 29.4 (4.2)*** | 27.2 (4.7) | 30.1 (5.7)*** | |
| CES-D (points) | 5.5 (5.6) | 8.2 (8.3)*** | 5.2 (5.4) | 7.2 (7.6)*** | 5.7 (5.8) | 8.9 (8.8)*** | |
| Charlson co-morbidity index (points) | 0.4 (0.9) | 0.4 (0.9) | 0.5 (1.1) | 0.4 (0.8) | 0.3 (0.7) | 0.4 (0.9) | |
| Frailty items | |||||||
| Poor physical performance (n, %) | 66 (6.0) | 176 (15.9)*** | 27 (5.8) | 64 (13.8)*** | 39 (6.1) | 112 (17.5)*** | |
| Poor chair stands time (n, %) | 7 (0.6) | 5 (0.5) | 1 (0.2) | 3 (0.6) | 6 (0.9) | 2 (0.3) | |
| Weight loss (n, %) | 42 (3.8) | 22 (2.0)** | 3 (0.6) | 6 (1.3) | 39 (6.1) | 1.6 (2.5)*** | |
Notes: The data are presented as means (with standard deviations) for continuous variables and number (with percentage) for the first and the fourth quartile.
P values for trends were calculated using the Jonckheere-Terpstra test for continuous variables and the Mantel-Haenszel Chi-square test for categorical ones.
: p for trend<0.0001;
: p for trend <0.001;
: p for trend <0.05.
Abbreviations: CES-D: Center for Epidemiologic Studies Depression Scale; PASE: Physical Activity Scale for the Elderly; BMI: body mass index.
Dietary inflammatory index and incident frailty
Over a mean follow-up of 8 years, 356 individuals (118 men and 238 women; =8.2% of the baseline population) became frail; for a global incidence of 12 (95%CI: 10–14) people for 1,000 persons-years.
Cox’s regression analysis, adjusting for 11 potential confounders at baseline, with the lowest DII as reference (=Q1), showed that participants with the highest DII score (=Q4) had a significantly higher probability of incident frailty (HR: 1.37; 95% CI: 1.01–1.89; p=0.04; Table 2). However, the p for trend did not reach the statistical significance (p for trend=0.27). In the multivariate analysis, other factors significantly associated with the onset of frailty were: BMI (HR: 1.05; 95% CI: 1.03 to 1.07; p=<0.0001), CES-D (HR: 1.06; 95% CI: 1.05 to 1.07; p<0.0001), Charlson co-morbidity index (HR: 1.20; 95% CI: 1.10 to 1.31; p<0.0001); presence of one frailty item at baseline (HR=2.76; 95%CI: 2.15 to 3.56; p<0.0001). Increase in one SD of DII (=1.67 points) did not increase the risk of frailty at follow-up (adjusted HR=1.04; 95%CI: 0.93–1.15; p=0.51).
Table 2.
Association between dietary inflammatory index and incidence of frailty.
| Unadjusted HR (95%CI) |
P value | Fully adjusteda HR (95%CI) |
P value | |
|---|---|---|---|---|
| All sample | ||||
|
| ||||
| Q1 | 1 [reference] | 1 [reference] | ||
| Q2 | 1.36 (0.99–1.86) | 0.06 | 1.22 (0.88–1.67) | 0.23 |
| Q3 | 1.39 (1.02–1.91) | 0.04 | 1.24 (0.90–1.71) | 0.20 |
| Q4 | 1.77 (1.30–2.40) | <0.0001 | 1.37 (1.01–1.89) | 0.04 |
|
| ||||
| Men | ||||
|
| ||||
| Q1 | 1 [reference] | 1 [reference] | ||
| Q2 | 3.08 (1.33–7.11) | 0.009 | 3.24 (1.38–7.57) | 0.007 |
| Q3 | 3.21 (1.42–7.22) | 0.005 | 3.21 (1.41–7.31) | 0.006 |
| Q4 | 4.23 (1.92–9.32) | <0.0001 | 4.03 (1.78–9.09) | 0.001 |
|
| ||||
| Women | ||||
|
| ||||
| Q1 | 1 [reference] | 1 [reference] | ||
| Q2 | 1.23 (0.87–1.74) | 0.30 | 1.12 (0.79–1.59) | 0.86 |
| Q3 | 1.30 (0.90–1.86) | 0.16 | 1.03 (0.71–1.49) | 0.88 |
| Q4 | 1.41 (0.97–2.04) | 0.07 | 0.96 (0.65–1.42) | 0.84 |
Notes:
All the data are presented as hazard ratios (HRs) with their 95% confidence intervals.
Fully adjusted model included as covariates: age (as continuous); sex (only for the sample as whole); race (whites vs. others); body mass index (as continuous); education (degree vs. others); smoking habits (current and previous vs. others); yearly income (categorized as ≥ or < 50,000$ and missing data); Physical Activity Scale for Elderly score (as continuous); Charlson co-morbidity index; CES-D: Center for Epidemiologic Studies Depression Scale; number of frailty indexes at baseline (one vs. none).
Abbreviations: CI: confidence intervals; HR: hazard ratio.
Because the interaction of sex by DII in predicting frailty at follow-up was significant (p for interaction=0.03), the results also are reported by gender in Table 2. In men, all the higher quartiles of DII were associated with incident frailty (HR=3.24; 95%CI. 1.38–7.57; p=0.007 for the second quartile; HR=3.21; 95%CI. 1.41–7.31; p=0.006 for the third quartile; HR=4.03; 95%CI. 1.78–9.09; p<0.0001 for the highest quartile; p for trend <0.0001). No association was, on the contrary, observed in women (p for trend=0.24). These results are graphically reported for men in Figure 1. Each increase in one SD in DII score increased the risk of frailty in men (adjusted HR=1.24; 95%CI: 1.06–1.46; p=0.008), but not in women (HR=0.92; 95%CI: 0.80–1.05; p=0.22).
Figure 1.
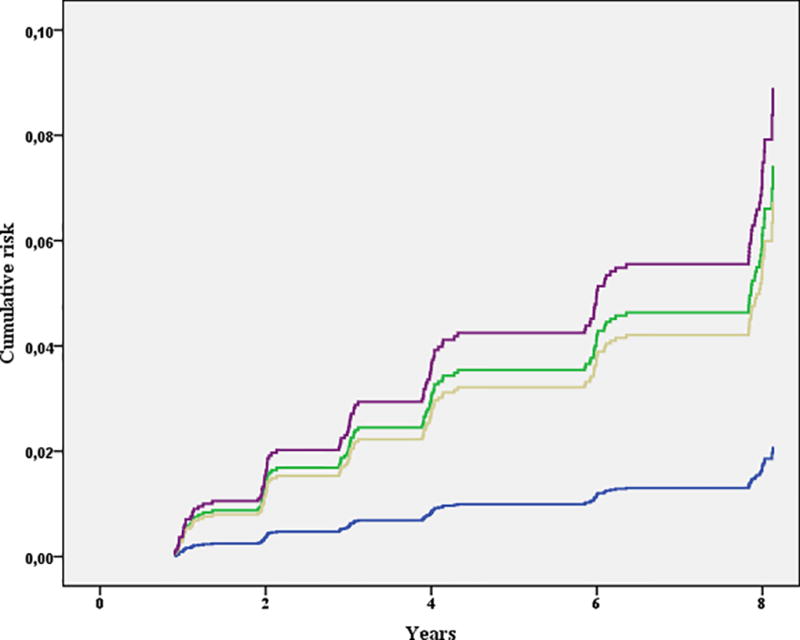
Association between dietary inflammatory index and incident frailty in men.
blue line indicates the first quartile (i.e., participants with lower DII); yellow line those in the second, green those in the third and violet line participants with the highest DII values.
DISCUSSION
In this longitudinal study, we found that higher DII values were associated with greater incidence of frailty. During a follow-up period of 8 years, after adjusting for several potential confounders at baseline, individuals with the highest DII score (i.e. having a more pro-inflammatory diet) had a 37% higher risk of frailty. This association, however, was significant only in men, suggesting important gender differences.
The relationship between inflammation and frailty is complex, since both increase exponentially with advancing age and because both higher levels of inflammation and frailty are associated with several chronic disease outcomes in the elderly.42–44 These findings suggest that common pathways are present in frailty and inflammation. Compared to healthy participants, frail people seem to have a significant reduction in both innate and acquired immunity.45 Additionally, an increase in mitochondrial activity is seen with an increase in oxidative stress products46, ultimately leading to an increase in serum inflammatory levels.
Previous longitudinal studies did not globally show a significant association between higher levels of inflammatory and endocrine markers and the onset of frailty.16–19 The absence of an unified operational definition for frailty makes the development of measurable biomarkers of particular importance.47 The ability of higher inflammatory parameters to predict the onset of frailty could be important because higher levels of these inflammatory markers significantly contribute to transitions from frailty to disability.8 We can hypothesize that previous longitudinal studies did not report any significant association because they used biohumoral estimates of inflammation that are very sensitive to acute and sub-acute diseases. Therefore, unlike DII scores, which may better reflect long-term habitual exposure, they may not be sufficiently stable for use in epidemiologic studies.
Another important finding of our study is that higher DII scores are associated with incident frailty in men, but not in women. In men, for example, participants in the highest quartile had four times higher risk of developing frailty during follow-up period. We also observed men to have higher DII scores compared to women. We can hypothesize that inflammation has a differential effect in predicting chronic disease outcomes between genders in agreement with the current literature. For example, the prognosis for females suffering from inflammatory conditions seems to be better than in males, even if inflammatory markers are usually higher in females than in males, particularly after menopause.48,49 It also has been shown in the past that women consume healthier diets rich in fruits and vegetables compared to men; so, there could be other factors which influence development of frailty in women.50 However, future research is needed to explore the significant difference between genders in this study.
Our findings might have important clinical consequences. Inflammation is known to be a significant risk factor for several medical conditions typical of older people, a phenomenon recently called “inflammaging”.51 Since DII is linearly associated with serum markers of inflammation21,28–32, the possibility of modulating inflammation with a healthier diet might provide important benefits for preventing frailty, particularly in men for which, as mentioned before, unhealthier diets are probably more common than in women.50 Unfortunately, very few randomized controlled trials regarding the possible role of anti-inflammatory diets are available and, where available, these interventions are usually associated with a physical exercise regimen.52,53 Future studies with diets with a strong anti-inflammatory meaning (such as Mediterranean diet) are needed in this sense.
The findings of our research should be considered in the light of its limitations. The principal shortcoming is that we used a different definition of frailty between baseline and follow-up, because weight loss was defined in different ways. This could introduce an important bias in our results. Second, the comorbid medical conditions assessed in this study were self-reported, introducing a possible recall bias. Another limitation could be the non-availability of data on the remaining 21 food parameters of the DII. Some components such as turmeric, saffron and eugenol are not consumed in high quantity in this population, so non-availability of these food parameters may not have played major role in this association. However, inclusion of parameters such as flavonoids, which are commonly consumed, may influence the results. Finally, the findings deriving from the OAI are not fully generalizable to other populations because this database includes only people having or at high risk of knee OA. Despite these limitations, this study is one of the few reporting data on the association between inflammation and frailty. It also is the first assessing the role of DII in this condition.
CONCLUSION
Higher dietary inflammatory index scores were associated with a higher incidence of frailty, even after considering several potentially important confounders measured at baseline. These findings were particularly strong in men suggesting important differences between genders. Future randomized controlled trials with diets rich in anti-inflammatory compounds are needed to confirm our findings.
Acknowledgments
Funding sources: The OAI is a public-private partnership comprised of five contracts(N01-AR-2-2258; N01-AR-2-2259; N01-AR-2-2260; N01-AR-2-2261; N01-AR-2-2262) funded by the National Institutes of Health, a branch of the Department of Health and Human Services, and conducted by the OAI Study Investigators. Private funding partners include Merck Research Laboratories; Novartis Pharmaceuticals Corporation, GlaxoSmithKline; and Pfizer, Inc. Private sector funding for the OAI is managed by the Foundation for the National Institutes of Health. This manuscript was prepared using an OAI public use data set and does not necessarily reflect the opinions or views of the OAI investigators, the NIH, or the private funding partners. NS and JRH were supported by the United States National Institute for Diabetes, Digestive and Kidney Diseases (grant no. R44DK103377). Sponsor’s role: the sponsors had no role in the design, methods, subject recruitment, data collection, analysis or preparation of this paper.
Footnotes
Conflict of interest: Dr. JRH owns controlling interest in Connecting Health Innovations LLC (CHI), a company planning to license the right to his invention of the dietary inflammatory index (DII) from the University of South Carolina to develop computer and smart phone applications for patient counseling and dietary intervention in clinical settings. Dr. NS is an employee of CHI.
References
- 1.Clegg A, Young J, Iliffe S, Rikkert MO, Rockwood K. Frailty in elderly people. Lancet (London, England) 2013;381(9868):752–762. doi: 10.1016/S0140-6736(12)62167-9. [DOI] [PMC free article] [PubMed] [Google Scholar]
- 2.Fried LP, Tangen CM, Walston J, et al. Frailty in older adults: evidence for a phenotype. The journals of gerontology Series A, Biological sciences and medical sciences. 2001;56(3):M146–156. doi: 10.1093/gerona/56.3.m146. [DOI] [PubMed] [Google Scholar]
- 3.Kojima G. Prevalence of Frailty in Nursing Homes: A Systematic Review and Meta-Analysis. Journal of the American Medical Directors Association. 2015;16(11):940–945. doi: 10.1016/j.jamda.2015.06.025. [DOI] [PubMed] [Google Scholar]
- 4.Soysal P, Veronese N, Thompson T, et al. Relationship between depression and frailty in older adults: A systematic review and meta-analysis. Ageing research reviews. 2017;36:78–87. doi: 10.1016/j.arr.2017.03.005. [DOI] [PubMed] [Google Scholar]
- 5.Veronese N, Solmi M, Maggi S, et al. Frailty and incident depression in communityd-welling older people: results from the ELSA study. International journal of geriatric psychiatry. 2017 doi: 10.1002/gps.4673. [DOI] [PubMed] [Google Scholar]
- 6.Veronese N, Cereda E, Stubbs B, et al. Risk of cardiovascular disease morbidity and mortality in frail and pre-frail older adults: results from a meta-analysis and exploratory meta-regression analysis. Ageing research reviews. 2017 doi: 10.1016/j.arr.2017.01.003. [DOI] [PMC free article] [PubMed] [Google Scholar]
- 7.Fugate Woods N, LaCroix AZ, Gray SL, et al. Frailty: Emergence and Consequences in Women Aged 65 and Older in the Women's Health Initiative Observational Study. Journal of the American Geriatrics Society. 2005;53(8):1321–1330. doi: 10.1111/j.1532-5415.2005.53405.x. [DOI] [PubMed] [Google Scholar]
- 8.Zaslavsky O, Cochrane BB, Thompson HJ, Woods NF, Herting JR, LaCroix A. Frailty: a review of the first decade of research. Biological research for nursing. 2013;15(4):422–432. doi: 10.1177/1099800412462866. [DOI] [PubMed] [Google Scholar]
- 9.Chung HY, Cesari M, Anton S, et al. Molecular inflammation: underpinnings of aging and age-related diseases. Ageing research reviews. 2009;8(1):18–30. doi: 10.1016/j.arr.2008.07.002. [DOI] [PMC free article] [PubMed] [Google Scholar]
- 10.Bruunsgaard H, Pedersen BK. Age-related inflammatory cytokines and disease. Immunology and allergy clinics of North America. 2003;23(1):15–39. doi: 10.1016/s0889-8561(02)00056-5. [DOI] [PubMed] [Google Scholar]
- 11.Woods JA, Wilund KR, Martin SA, Kistler BM. Exercise, Inflammation and Aging. Aging and Disease. 2012;3(1):130–140. [PMC free article] [PubMed] [Google Scholar]
- 12.Bano G, Trevisan C, Carraro S, et al. Inflammation and sarcopenia: A systematic review and meta-analysis. Maturitas. 2017;96:10–15. doi: 10.1016/j.maturitas.2016.11.006. [DOI] [PubMed] [Google Scholar]
- 13.Chen X, Mao G, Leng SX. Frailty syndrome: An overview. 92014:433–441. doi: 10.2147/CIA.S45300. [DOI] [PMC free article] [PubMed] [Google Scholar]
- 14.Lang PO, Michel JP, Zekry D. Frailty syndrome: A transitional state in a dynamic process. 552009:539–549. doi: 10.1159/000211949. [DOI] [PubMed] [Google Scholar]
- 15.Soysal P, Stubbs B, Lucato P, et al. Inflammation And Frailty In The Elderly: A Systematic Review And Meta-analysis. Ageing research reviews. 2016 doi: 10.1016/j.arr.2016.08.006. [DOI] [PubMed] [Google Scholar]
- 16.Gale CR, Baylis D, Cooper C, Sayer AA. Inflammatory markers and incident frailty in men and women: The english longitudinal study of ageing. Age. 2013;35(6):2493–2501. doi: 10.1007/s11357-013-9528-9. [DOI] [PMC free article] [PubMed] [Google Scholar]
- 17.Baylis D, Bartlett DB, Syddall HE, et al. Immune-endocrine biomarkers as predictors of frailty and mortality: A 10-year longitudinal study in community-dwelling older people. Age. 2013;35(3):963–971. doi: 10.1007/s11357-012-9396-8. [DOI] [PMC free article] [PubMed] [Google Scholar]
- 18.Puts MTE, Visser M, Twisk JWR, Deeg DJH, Lips P. Endocrine and inflammatory markers as predictors of frailty. Clinical Endocrinology. 2005;63(4):403–411. doi: 10.1111/j.1365-2265.2005.02355.x. [DOI] [PubMed] [Google Scholar]
- 19.Reiner AP, Aragaki AK, Gray SL, et al. Inflammation and Thrombosis Biomarkers and Incident Frailty in Postmenopausal Women. American Journal of Medicine. 2009;122(10):947–954. doi: 10.1016/j.amjmed.2009.04.016. [DOI] [PMC free article] [PubMed] [Google Scholar]
- 20.Shivappa N, Steck SE, Hurley TG, Hussey JR, Hebert JR. Designing and developing a literature-derived, population-based dietary inflammatory index. Public health nutrition. 2014;17(8):1689–1696. doi: 10.1017/S1368980013002115. [DOI] [PMC free article] [PubMed] [Google Scholar]
- 21.Tabung FK, Steck SE, Zhang J, et al. Construct validation of the dietary inflammatory index among postmenopausal women. Annals of epidemiology. 2015;25(6):398–405. doi: 10.1016/j.annepidem.2015.03.009. [DOI] [PMC free article] [PubMed] [Google Scholar]
- 22.Orchard T, Yildiz V, Steck SE, et al. Dietary Inflammatory Index, Bone Mineral Density, and Risk of Fracture in Postmenopausal Women: Results From the Women's Health Initiative. Journal of bone and mineral research : the official journal of the American Society for Bone and Mineral Research. 2016 doi: 10.1002/jbmr.3070. [DOI] [PMC free article] [PubMed] [Google Scholar]
- 23.Tabung FK, Steck SE, Ma Y, et al. The association between dietary inflammatory index and risk of colorectal cancer among postmenopausal women: results from the Women's Health Initiative. Cancer causes & control : CCC. 2015;26(3):399–408. doi: 10.1007/s10552-014-0515-y. [DOI] [PMC free article] [PubMed] [Google Scholar]
- 24.Wood LG, Shivappa N, Berthon BS, Gibson PG, Hebert JR. Dietary inflammatory index is related to asthma risk, lung function and systemic inflammation in asthma. Clinical and experimental allergy : journal of the British Society for Allergy and Clinical Immunology. 2015;45(1):177–183. doi: 10.1111/cea.12323. [DOI] [PMC free article] [PubMed] [Google Scholar]
- 25.Wirth MD, Burch J, Shivappa N, et al. Association of a dietary inflammatory index with inflammatory indices and metabolic syndrome among police officers. Journal of occupational and environmental medicine. 2014;56(9):986–989. doi: 10.1097/JOM.0000000000000213. [DOI] [PMC free article] [PubMed] [Google Scholar]
- 26.Eby GA, Eby KL. Rapid recovery from major depression using magnesium treatment. Medical Hypotheses. 2006;67(2):362–370. doi: 10.1016/j.mehy.2006.01.047. [DOI] [PubMed] [Google Scholar]
- 27.Block G, Hartman AM, Naughton D. A reduced dietary questionnaire: development and validation. Epidemiology (Cambridge, Mass) 1990;1(1):58–64. doi: 10.1097/00001648-199001000-00013. [DOI] [PubMed] [Google Scholar]
- 28.Shivappa N, Steck SE, Hurley TG, et al. A population-based dietary inflammatory index predicts levels of C-reactive protein in the Seasonal Variation of Blood Cholesterol Study (SEASONS) Public health nutrition. 2014;17(8):1825–1833. doi: 10.1017/S1368980013002565. [DOI] [PMC free article] [PubMed] [Google Scholar]
- 29.Wirth MD, Shivappa N, Davis L, et al. Construct validation of the Dietary Inflammatory Index among African Americans. J Nutr Health Aging. 2016:1–5. doi: 10.1007/s12603-016-0775-1. [DOI] [PMC free article] [PubMed] [Google Scholar]
- 30.Wirth MD, Burch J, Shivappa N, et al. Association of a Dietary Inflammatory Index With Inflammatory Indices and Metabolic Syndrome Among Police Officers. J Occup Environ Med. 2014;56(9):986–989. doi: 10.1097/JOM.0000000000000213. [DOI] [PMC free article] [PubMed] [Google Scholar]
- 31.Ramallal R, Toledo E, Martinez-Gonzalez MA, et al. Dietary Inflammatory Index and Incidence of Cardiovascular Disease in the SUN Cohort. PloS one. 2015;10(9) doi: 10.1371/journal.pone.0135221. [DOI] [PMC free article] [PubMed] [Google Scholar]
- 32.Shivappa N, Hebert JR, Rietzschel ER, et al. Associations between dietary inflammatory index and inflammatory markers in the Asklepios Study. The British journal of nutrition. 2015;113(4):665–671. doi: 10.1017/S000711451400395X. [DOI] [PMC free article] [PubMed] [Google Scholar]
- 33.Willett WC, Howe GR, Kushi LH. Adjustment for total energy intake in epidemiologic studies. The American journal of clinical nutrition. 1997;65(4 Suppl):1220S–1228S. doi: 10.1093/ajcn/65.4.1220S. discussion 1229S–1231S. [DOI] [PubMed] [Google Scholar]
- 34.Ensrud KE, Ewing SK, Taylor BC, et al. Frailty and risk of falls, fracture, and mortality in older women: the study of osteoporotic fractures. The journals of gerontology Series A, Biological sciences and medical sciences. 2007;62(7):744–751. doi: 10.1093/gerona/62.7.744. [DOI] [PubMed] [Google Scholar]
- 35.Veronese N, Stubbs B, Noale M, et al. Polypharmacy Is Associated With Higher Frailty Risk in Older People: An 8-Year Longitudinal Cohort Study. Journal of the American Medical Directors Association. 2017 doi: 10.1016/j.jamda.2017.02.009. [DOI] [PMC free article] [PubMed] [Google Scholar]
- 36.Veronese N, Cereda E, Solmi M, et al. Inverse relationship between body mass index and mortality in older nursing home residents: a meta-analysis of 19,538 elderly subjects. Obesity reviews : an official journal of the International Association for the Study of Obesity. 2015;16(11):1001–1015. doi: 10.1111/obr.12309. [DOI] [PubMed] [Google Scholar]
- 37.Washburn RA, McAuley E, Katula J, Mihalko SL, Boileau RA. The physical activity scale for the elderly (PASE): evidence for validity. Journal of clinical epidemiology. 1999;52(7):643–651. doi: 10.1016/s0895-4356(99)00049-9. [DOI] [PubMed] [Google Scholar]
- 38.Lewinsohn PM, Seeley JR, Roberts RE, Allen NB. Center for Epidemiologic Studies Depression Scale (CES-D) as a screening instrument for depression among community-residing older adults. Psychology and aging. 1997;12(2):277–287. doi: 10.1037//0882-7974.12.2.277. [DOI] [PubMed] [Google Scholar]
- 39.Katz JN, Chang LC, Sangha O, Fossel AH, Bates DW. Can comorbidity be measured by questionnaire rather than medical record review? Medical care. 1996;34(1):73–84. doi: 10.1097/00005650-199601000-00006. [DOI] [PubMed] [Google Scholar]
- 40.Jonckheere AR. A distribution-free k-sample test against ordered alternatives. Biometrika. 1954;41(1/2):133–145. [Google Scholar]
- 41.Miles J. Tolerance and variance inflation factor. Wiley StatsRef: Statistics Reference Online. 2009 [Google Scholar]
- 42.Sergi G, Veronese N, Fontana L, et al. Pre-frailty and risk of cardiovascular disease in elderly men and women: the pro.v.a. study. Journal of the American College of Cardiology. 2015;65(10):976–983. doi: 10.1016/j.jacc.2014.12.040. [DOI] [PubMed] [Google Scholar]
- 43.Piggott DA, Varadhan R, Mehta SH, et al. Frailty, Inflammation, and Mortality Among Persons Aging With HIV Infection and Injection Drug Use. The journals of gerontology Series A, Biological sciences and medical sciences. 2015;70(12):1542–1547. doi: 10.1093/gerona/glv107. [DOI] [PMC free article] [PubMed] [Google Scholar]
- 44.Zunszain PA, Hepgul N, Pariante CM. Inflammation and depression. Current topics in behavioral neurosciences. 2013;14:135–151. doi: 10.1007/7854_2012_211. [DOI] [PubMed] [Google Scholar]
- 45.Hubbard RE, Woodhouse KW. Frailty, inflammation and the elderly. Biogerontology. 2010;11(5):635–641. doi: 10.1007/s10522-010-9292-5. [DOI] [PubMed] [Google Scholar]
- 46.Soysal P, Isik AT, Carvalho AF, et al. Oxidative Stress And Frailty: A Systematic Review And Best Evidence Synthesis. Maturitas. 2017 doi: 10.1016/j.maturitas.2017.01.006. in press. [DOI] [PubMed] [Google Scholar]
- 47.Calvani R, Marini F, Cesari M, et al. Biomarkers for physical frailty and sarcopenia: State of the science and future developments. Journal of Cachexia, Sarcopenia and Muscle. 2015;6(4):278–286. doi: 10.1002/jcsm.12051. [DOI] [PMC free article] [PubMed] [Google Scholar]
- 48.Casimir GJA, Duchateau J. Gender Differences in Inflammatory Processes Could Explain Poorer Prognosis for Males. Journal of Clinical Microbiology. 2011;49(1):478–479. doi: 10.1128/JCM.02096-10. [DOI] [PMC free article] [PubMed] [Google Scholar]
- 49.Losonczy G, Kriston T, Szabó A, et al. Male gender predisposes to development of endotoxic shock in the rat. Cardiovascular research. 2000;47(1):183–191. doi: 10.1016/s0008-6363(00)00075-4. [DOI] [PMC free article] [PubMed] [Google Scholar]
- 50.Kiefer I, Rathmanner T, Kunze M. Eating and dieting differences in men and women. Journal of Men's Health and Gender. 2005;2(2):194–201. [Google Scholar]
- 51.Franceschi C, Campisi J. Chronic inflammation (inflammaging) and its potential contribution to age-associated diseases. The journals of gerontology Series A, Biological sciences and medical sciences. 2014;69(Suppl 1):S4–9. doi: 10.1093/gerona/glu057. [DOI] [PubMed] [Google Scholar]
- 52.Lee P-H, Lee Y-S, Chan D-C. Interventions targeting geriatric frailty: A systemic review. Journal of Clinical Gerontology and Geriatrics. 2012;3(2):47–52. [Google Scholar]
- 53.Manal B, Suzana S, Singh DK. Nutrition and Frailty: A Review of Clinical Intervention Studies. The Journal of frailty & aging. 2015;4(2):100–106. doi: 10.14283/jfa.2015.49. [DOI] [PubMed] [Google Scholar]