

Abstract
There is growing recognition that the gut microbial community regulates a wide variety of important functions in its animal hosts, including host health. However, the complex interactions between gut microbes and environment are still unclear. Honey bees are ecologically and economically important pollinators that host a core gut microbial community that is thought to be constant across populations. Here, we examined whether the composition of the gut microbial community of honey bees is affected by the environmental landscape the bees are exposed to. We placed honey bee colonies reared under identical conditions in two main landscape types for 6 weeks: either oilseed rape farmland or agricultural farmland distant to fields of flowering oilseed rape. The gut bacterial communities of adult bees from the colonies were then characterized and compared based on amplicon sequencing of the 16S rRNA gene. While previous studies have delineated a characteristic core set of bacteria inhabiting the honey bee gut, our results suggest that the broad environment that bees are exposed to has some influence on the relative abundance of some members of that microbial community. This includes known dominant taxa thought to have functions in nutrition and health. Our results provide evidence for an influence of landscape exposure on honey bee microbial community and highlight the potential effect of exposure to different environmental parameters, such as forage type and neonicotinoid pesticides, on key honey bee gut bacteria. This work emphasizes the complexity of the relationship between the host, its gut bacteria, and the environment and identifies target microbial taxa for functional analyses.
Keywords: amplicon sequencing, bacterial microbiota, honey bee, landscape exposure, oilseed rape
1. INTRODUCTION
Individual animals are often considered discrete entities; however, the microbial symbionts they host are increasingly recognized as key components in their evolutionary and ecological success (Bosch & McFall‐Ngai, 2011; Brucker & Bordenstein, 2012; Franchini, Fruciano, Frickey, Jones, & Meyer, 2014; Gibson & Hunter, 2010; Hildebrand et al., 2012; Moran, McCutcheon, & Nakabachi, 2008; Moya, Peretó, Gil, & Latorre, 2008). Insects harbor bacteria with diverse roles ranging from nutrition to defense, and with influences on reproduction and speciation (e.g. Brucker & Bordenstein, 2013; Feldhaar, 2011; Jaenike, Unckless, Cockburn, Boelio, & Perlman, 2010). Many of these symbionts are part of the gut bacterial community and in social insects in general, the gut microbial community has been reported to be associated with a range of traits including invasive behaviors, nest sanitation, longevity, fecundity, and health (Cox‐Foster et al., 2007; Engel et al., 2016; Ishak et al., 2011; Martinson et al., 2011; Rosengaus, Zecher, Schultheis, Brucker, & Bordenstein, 2011).
Social insects, and specifically honey bees, are important models for further determining the extraordinary range of influences of microbial communities on their hosts. Recent honey bee colony losses worldwide call for a more in‐depth understanding of the pathogenic and mutualistic components of the microbial communities of this ecologically and economically important pollinator (Gallai, Salles, Settele, & Vaissière, 2009; Ollerton, Winfree, & Tarrant, 2011), and specifically the association between the environment and microbial community (Engel et al., 2016). Importantly, the ecological and evolutionary processes shaping the microbial community and host associations, ranging along a spectrum from tightly coevolved obligate relationships to facultative relationships, are as yet not well understood.
Losses of honey bees and other pollinators are thought to be due to exposure to multiple interacting stressors, including disease, pesticide exposure, flower availability, and the importation of nonnative bees (Goulson, Nicholls, Botías, & Rotheray, 2015). One factor that is likely shaped by these different stressors, and is critical to the health and success of colonies, is the composition and function of their microbial community (e.g. Engel, Martinson, & Moran, 2012; Koch & Schmid‐Hempel, 2011b; Moran, 2015). In recent surveys, adult honey bees and bumblebees have been shown to harbor a relatively simple and unique gut microbiota that is not present in solitary bees (Cox‐Foster et al., 2007; Jeyaprakash, Hoy, & Allsopp, 2003; Koch & Schmid‐Hempel, 2011a; Martinson et al., 2011; Mohr & Tebbe, 2006). Sociality has therefore been suggested to facilitate the vertical transmission of gut bacteria and allow for the coevolution of the host and gut bacteria that may be critical to bee health (Koch & Schmid‐Hempel, 2011b; Kwong et al., 2017; Martinson et al., 2011; Moran, 2015; Olofsson & Vásquez, 2008). Genomic and metagenomic analyses suggest that different taxa within this core microbial community are likely involved in different functions (Ellegaard et al., 2015; Engel, Bartlett, & Moran, 2015; Engel, Stepanauskas, & Moran, 2014; Engel et al., 2012; Kwong, Engel, Koch, & Moran, 2014; Lee, Rusch, Stewart, Mattila, & Newton, 2015), and therefore host exposure to different ecological pressures may select for flexibility in the abundance of the different gut microbial taxa. Specifically, a combination of 16S rRNA community surveys and metagenomics studies has shown that the gut community of worker honey bees is dominated by nine bacterial species clusters that make up 95%–98% of the community (Babendreier, Joller, Romeis, Bigler, & Widmer, 2006; Corby‐Harris, Maes, & Anderson, 2014; Jeyaprakash et al., 2003; Martinson et al., 2011; Moran, Hansen, Powell, & Sabree, 2012; Sabree, Hansen, & Moran, 2012). These include five core species clusters, two abundant and ubiquitous gram‐negative species clusters from the Proteobacteria phylum, Snodgrasssella alvi and Gilliamella apicola (Kwong & Moran, 2013), two abundant and ubiquitous gram‐positive species clusters in the Firmicutes Phylum referred to as Lactobacillus Firm‐4, and Lactobacillus Firm‐5 clades (Babendreier et al., 2006; Martinson et al., 2011), and the species cluster Bifidobacterium asteroides from the Actinobacterium phylum (Bottacini et al., 2012; Scardovi & Trovatelli, 1969). Four additional species clusters that are prevalent but can occur at lower frequencies are the proteobacteria – Frischella perrara, Bartonella apis, and two Acetobacteraceae, Alpha2.1, and Alpha 2.2 (Parasaccharibacter apium) (Corby‐Harris, Synder, et al., 2014; Engel, Kwong, & Moran, 2013; Kešnerová, Moritz, & Engel, 2016; Martinson et al., 2011). These four species clusters have been found to be either restricted in their niches in the bee gut, or are more generalists that are also found in the hive environment, as in Alpha 2.2 in particular (Corby‐Harris, Synder, et al., 2014; Kwong & Moran, 2016).
Importantly, the current paradigm is that the core bacterial community of honey bees is relatively constant across populations and geographical areas (Cox‐Foster et al., 2007; Jeyaprakash et al., 2003; Martinson et al., 2011; Mohr & Tebbe, 2006; Moran et al., 2012; Sabree et al., 2012). Here, we test this by comparing the gut microbial communities of honey bees in two landscapes using 16S rRNA gene profiling. We focus on exposure to the mass‐flowering crop oilseed rape (OSR, also known as canola). OSR is one of the most important crops worldwide occupying 3% of the land area in the United Kingdom (DEFRA 2013), and often dominating the local landscape. It has also been a focus of recent debate over the application of neonicotinoid pesticides that have been implicated in pollinator declines (Suryanarayanan, 2015). We therefore compared the gut bacterial communities of honey bees exposed to OSR farms with those from agricultural environments distant to fields of flowering OSR.
2. MATERIALS AND METHODS
2.1. Sites and sampling
Thirty‐six honey bee colonies were maintained using standard beekeeping methods by the same beekeeper at the University of Sussex for 1 year prior to the experiment. As detailed in Balfour et al. (2017), colonies were equalized on 31 March and 1 April 2014 during unfavorable foraging conditions to ensure that the vast majority of foragers were within the hive and worker population could be assessed. Each colony had a marked laying queen, four frames of brood, six frames of adult worker bees, two–three frames of honey, 0.5–1 frames of pollen, and two frames of empty wax foundation comb. Visual inspection suggested all colonies were disease free. Colonies differed in genetic background but were randomly allocated to landscapes so differences in genetic background would not confound results. The honey bee colonies were then placed at six different locations in two landscape types in the southern UK (on 2–4 April 2014; Figure 1): (i) farmland areas immediately adjacent to (<5 m) large (≥0.38 km2) oilseed rape (OSR) fields that were in flower and had been seed‐treated with thiamethoxam (Cruiser, Syngenta Ltd.); (ii) agricultural land distant to OSR (Distant) with the nearest OSR field boundaries being located ≥1.25 km from hives, and therefore little visited as average foraging distances are short, <1.1 km, during the OSR blooming period (April–May) (Couvillon, Schürch, & Ratnieks, 2014). All study sites were selected to be as similar as possible in other landscape factors, including elevation, soil type, exposure, and land use. Information on pesticide usage was supplied by local agronomists and farm owners. Adult forager bees found on the exterior of the colony were sampled from each apiary just after peak OSR flowering time when workers at the OSR farms had been foraging and storing nectar and pollen from the OSR. Adult forager bee samples were immediately frozen and stored for extraction and sequencing after collection (each of the samples analyses is a pool of three bees per colony, see Table S1 for sampling details). Pollen pellets, collected from returning foragers during early and full OSR bloom using a trap fitted to each hive, were identified to determine the average amount of OSR pollen per apiary. This was conducted for both landscape categories. The average neonicotinoid residues (thiamethoxam + clothianidin) were quantified in pollen and honey samples for both landscape types in order to determine residues in each landscape (OSR; Distant). Stored honey samples were taken from each hive on May 15, near the end of OSR bloom to reflect foraging during the bloom, and pooled across colonies per apiary. Specifically, sealed honey was collected from multiple previously empty frames and locations within each colony to provide a representative sample from the OSR bloom period.
Figure 1.
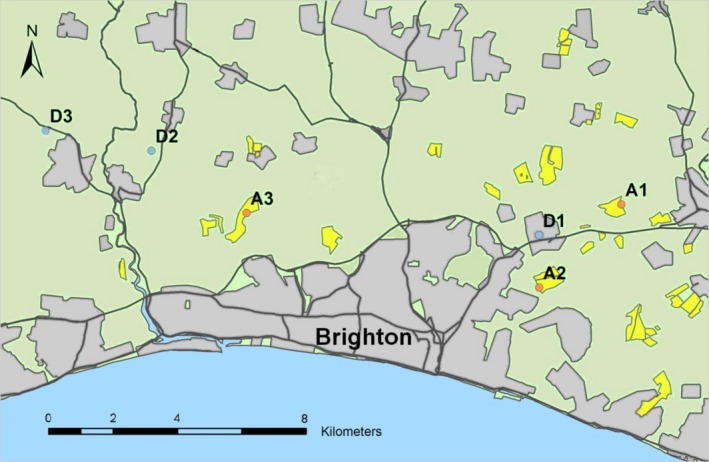
Apiary locations in two different landscape types in Sussex, United Kingdom. Oilseed rape (OSR) fields are highlighted in yellow. Apiaries are labelled and colored by their landscape exposure type (orange, OSR farmland; blue, areas distant from OSR farmland)
As outlined in Balfour et al. (2017), samples were analyzed for neonicotinoid concentrations (thiamethoxam and its metabolite clothianidin) by SAL (Scientific Analysis Laboratory Ltd., Cambridge), an accredited (UK Accreditation Service) contract analytical laboratory. SAL's extraction method is based on the QuEChERS extraction technique which uses water and acidified acetonitrile as an extraction solvent (Kamel, 2010). Magnesium sulfate and ammonium acetate (as a buffer) were added to induce solvent partitioning. Quantitation was assessed against a series of known calibration standards dissolved in a methanol:water solution. Deuterated clothianidin (Clothianidin‐d3) was used as an internal standard preextraction, to correct for losses during extraction and to compensate for matrix effects (suppression or enhancement) during analysis. The limit of quantification (LOQ) and detection (LOD) were 0.1 μg/kg for both thiamethoxam and clothianidin and for both pollen and honey.
2.2. DNA extraction, amplification, and sequencing
After thawing for 1–2 min, the gut of each individual, from the midgut to the hindgut, and not including the crop, was dissected under sterile conditions. DNA extractions of individual guts were performed immediately after dissection using the Zymo Research Tissue and Insect DNA MiniPrep (Cambridge Biosciences, Cambridge, UK) following the manufacturer's protocol. Illumina libraries were prepared following the method outlined by Caporaso et al., 2012 (Caporaso et al., 2012). Briefly, the bacterial V4 region of the 16S ribosomal gene was amplified from each DNA template in triplicate using the universal primers 515F and 806R tailed with Illumina barcoded adapters using the PCR conditions 95°C for 10 min, 35 cycles of 95°C for 30 s, 59°C for 30 s, 72°C for 1 min, and a final extension of 72°C for 7 min. PCR products were sent to the Plateforme d'Analyses Génomiques of the Institut de Biologie Intégrative et des Systèmes (IBIS, Université Laval, Quebec City, Canada, http://www.ibis.ulaval.ca/?pg=sequencage). The amplicons were purified using the Axygen Axyprep Mag PCR clean‐up kit (Corning). The quality of the products was assessed using a DNA7500 chip on a Bioanalyser 2100 (Agilent Technologies), quantified using a nanodrop (Thermo Scientific) and then pooled in an equimolar ratio. The quality of the final amplicon pool was rechecked as previously described, quantified using Quant‐iT picogreen ds DNA Assay (Thermo Scientific) and sequenced on an Illumina MiSeq (Illumina) using a v3 600 cycle kit. All sequences have been deposited in NCBI's Sequence Read Archive (SRA PRJEB23223).
2.3. Sequence processing and characterization of microbial communities
The LotuS pipeline was used for amplicon sequence processing (Hildebrand, Tadeo, Voigt, Bork, & Raes, 2014) using the following optional LotuS command line options: “‐p miSeq derepMin 8:1,4:2,3:3 –simBasedTaxo 2 –refDB SLV thr 8.” The pipeline was used to demultiplex reads with modified quality filtering to accommodate for the increased MiSeq sequence length, trimming reads to 220 bp, and rejecting reads with an accumulated error <1, requiring unique reads to be present at least eight times in one sample, four times in two, or three times in three separate samples.
In total, 11,636,723 reads were clustered at sequence level with UPARSE (Edgar, 2013), creating a set of de novo OTUs that can later be compared to databases of known sequences. Chimeric OTUs were removed against a specialized database of high‐quality reference sequences (http://drive5.com/uchime/rdp_gold.fa) using uchime (Edgar, Haas, Clemente, Quince, & Knight, 2011). High‐quality paired seed sequences were subsequently extracted for each OTU, merged with FLASH (Magoč & Salzberg, 2011), and aligned with Lambda (Hauswedell, Singer, & Reinert, 2014) against a custom 16S rRNA gene database that included representatives of all major known bacterial taxa associated with honey bees (developed by P. Engel, publicly available online on the LotuS website). Additionally, all sequences were aligned against the Greengenes and Silva SSU databases using Lambda (Hauswedell et al., 2014) as well as classified with RDP classifier (Wang, Garrity, & Tiedje, 2007) in order to detect and exclude any chloroplast or mitochondrial sequences in downstream analyses. The LotuS least common ancestor algorithm was used to assign a taxonomic identity based on the alignments to known bee taxa. OTUs were summed to genus, family, class, and phylum level per sample, according to their taxonomic classification.
2.4. Statistical analyses and comparisons of microbial communities
All analyses, unless otherwise specified, were conducted using the LotuS outputs in R with the packages vegan, phyloseq, phangorn, and ggplot2 (Castro‐Conde & de Uña Álvarez, 2014; McMurdie & Holmes, 2013; Oksanen et al., 2016; Paradis, Claude, & Strimmer, 2004; Schliep, 2011; Wickham, 2009). To reduce errors in estimation and false positives due to different numbers of sequences per individual, samples were rarefied to the smallest number of sequences per individual observed. To test for the consistency of the rarefaction, samples for each dataset were rarefied five times. For each of the rarefied matrices, pairwise sample dissimilarity matrices (Bray‐Curtis, UniFrac distances) among individuals were computed. Finally, the dissimilarity matrix obtained from the first rarefied dataset was compared with each of the dissimilarity matrices obtained from the other rarefied datasets by computing their correlation and testing its significance with a Mantel test (Mantel, 1967). Both the exploratory analyses and the tests of hypotheses described below were also performed on all the rarefied samples and inspected for consistency. Comparisons between rarefied samples using pairwise distances were found to be globally concordant (correlation 0.69–1; Mantel test significant in all cases). The results of the analyses were also always consistent across different rarefactions. For these reasons, only the results based on the first rarefied sample will be presented here.
To investigate patterns of microbial community diversity, we computed dissimilarity matrices using Bray–Curtis dissimilarity and Unifrac weighted and unweighted distances. Bray–Curtis dissimilarity reflects community composition, while UniFrac distances take into account the phylogenetic relationships among members of the bacterial communities (Lozupone & Knight, 2005). UniFrac distances are then either weighted by OTU abundance or unweighted, where only the presence/absence of taxa/OTUs is considered. These dissimilarity matrices were used to produce exploratory ordinations using nonmetric multidimensional scaling (nMDS) (Kruskal, 1964a,1964b). Hypothesis testing was carried out using permutational MANOVA (PERMANOVA) (Anderson, 2001). This approach is analogous to multivariate analysis of variance (MANOVA) but uses a dissimilarity matrix as the dependent variable (as opposed to a set of continuous variables as in MANOVA). Being analogous to a MANOVA, in PERMANOVA variation in distances is partitioned in terms (two factors – landscape type and site in our case, with site nested in landscape type) and tested for significance using a permutational procedure (1,000 permutations). In addition, we calculated the Shannon diversity index, a commonly used metric where both taxon richness and evenness of OTUs in each sample is accounted for, for each individual with the “diversity” function in vegan and tested for differences between groups using ANOVA.
To identify variation in bacterial taxa in honey bees exposed to different landscapes, we used the raw counts of the number of sequences that were assigned to the different OTUs. To test which OTUs were differentially represented between the two groups, we used two different procedures (Weiss et al., 2017). First, we used the procedure suggested by McMurdie & Holmes, (2014) on a dataset of nonrarefied samples where taxa with <500 reads were excluded. This procedure overcomes the need for rarefaction and uses the method implemented in the software DESeq2 (Love, Huber, & Anders, 2014), which is normally used to detect differential gene expression in RNAseq data. The DESeq2 method fits a model based on negative binomial distribution to test for differences in gene expression (in this case read counts) between two a priori defined groups. We then controlled for false discovery rate using the Benjamini and Hochberg procedure (Benjamini & Hochberg, 1995). It has recently been shown that the procedure based on DESeq2 has the advantage of increased sensitivity on smaller datasets (<20 samples per group) but tends toward a higher false discovery rate with more samples, very uneven (>10×) library sizes and or compositional effects (Weiss et al., 2017). Because of these potential limitations, we also used the analysis of composition of microbiomes (ANCOM) (Mandal, Van Treuren, & White, 2015). This procedure has recently been found to appropriately control for false discovery rate (Weiss et al., 2017). ANCOM compares the log ratio of the abundance of each taxon to the abundance of all the remaining taxa one at a time, and the Mann–Whitney U test is then calculated on each log ratio (Mandal et al., 2015; Weiss et al., 2017). Here, we used the R implementation of the procedure (version 1.1‐3).
3. RESULTS
3.1. Bacterial sequences and classification
We obtained a total of 11,636,723 16S rRNA V4 region sequences from the 108 sampled bees from the two landscape exposure conditions. After quality filtering, the number of sequences obtained per sample ranged from 236,463 to 400,075 reads which clustered in a total of 449 different OTUs. Unsurprisingly, the major bacterial taxa previously found to dominate the gut community of honey bees were represented in high proportions in the samples studied here (Figure 2). Using a custom honey bee bacterial database of currently available genomes of bee gut bacteria, we were able to assign 92% of the sequence reads to species level (99.93% to phylum level, 98% to family, and 95% to genus level) and verify that the major previously identified taxa or strains were present in our data (Neisseriaceae, S. alvi; Orbaceae, G. apicola and F. perrara; Lactobacillaceae, Firm‐4 and Firm‐5 species groups (genus Lactobacillus) and Lactobacillus kunkeei); Bifidobacteriaceae; Rhizobiales, Bartonellaceae (Alpha 1; including B. apis); Acetobacteraceae (Alpha 2.1 and 2.2), see also (Moran, 2015) and Figure 2).
Figure 2.
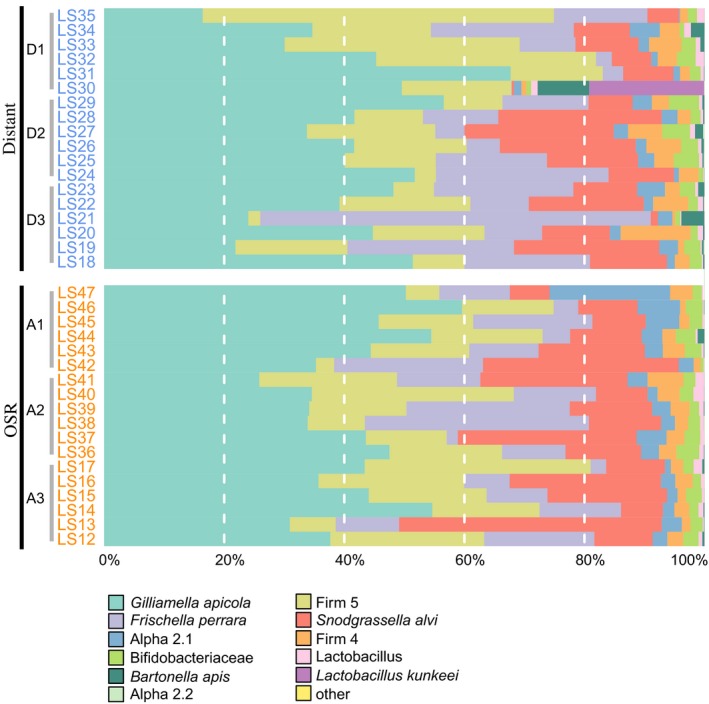
Taxonomic composition of the gut microbiome of honey bees exposed to different landscapes. The proportion of each taxa in the total microbiome is represented as the proportion of the colored bar. OSR, oilseed rape (OSR) farmland; Distant, areas distant from OSR farms. Individual apiaries are indicated with a gray bar and label
3.2. Landscape exposure and microbiomes
In honey bee colonies placed on OSR farms, 49% of the pollen collected was oilseed rape. Colonies located distant from OSR farms collected significantly less oilseed rape pollen than colonies adjacent to OSR farms (9%; ANOVA, F 1,5 = 14.1, p = .020; see also Balfour et al., 2017). Further, pollen analysis also showed that the main alternative forage source across all six study sites were Prunus spinosa (~15%) and Salix spp. (~15%). Other less common species (<5% across study sites) included as follows: Allium ursinum (site D3), Crocus spp. (A1), Endymion nonscriptus (A1, D1, D2), Taraxacum officinale (ubiquitous), Malus domestica (A2), Pyrus communis (A1), and Vicia faba (A3, D2). The average neonicotinoid residues (thiamethoxam + clothianidin) of the stored pollen and honey samples in the colonies during OSR bloom were on the low side of the range previously reported (Botías et al., 2015; Cutler & Scott‐Dupree, 2014; Pilling, Campbell, Coulson, Ruddle, & Tornier, 2013; Rolke, Fuchs, Grünewald, Gao, & Blenau, 2016; Thompson & Harrington, 2013). The average residues from colonies maintained on OSR farms was 0.76 ppb, significantly greater than residues found at apiaries distant to OSR farms where the majority of samples collected were below detection levels (<0.1 ppb) with an average of 0.21 ppb (ANOVA, F 1,5 = 8.1, p = .048; see also Balfour et al., 2017).
Honey bees from the two landscape types showed significant differences in their gut microbial communities using two comparisons (PERMANOVA: p = .004 using Bray–Curtis dissimilarity indices, p = .042 using unweighted UniFrac distances, Table 1), the PERMANOVA comparison using weighted UniFrac distances was not significant (p = .642). We also find substantial – and significant – variation among sites and a substantial proportion of residual variance (Table 1). In fact differences between landscape types accounted for 1%–6% of total variance, depending on the dissimilarity used, while differences between individual sites accounted for a higher percentage of the total variance (17%–27%; Table 1). The nonmetric multidimensional scaling (nMDS) plot shows a degree of separation, but also overlap, in the microbial communities of bees exposed to OSR farms and regions distant from OSR farms (Figure 3). Gut microbiome diversity was not significantly different in bees exposed to the different landscape types (ANOVA: F 1,34 = 0.07, p = .79).
Table 1.
Comparison of variation in taxa/OTUs diversity among different landscape types and sites (as a factor nested in landscape type; PERMANOVA based on Bray–Curtis dissimilarity indices and UniFrac weighted and unweighted distances)
| PERMANOVA | df | SS | MS | F | R 2 | p |
|---|---|---|---|---|---|---|
| Landscape (Bray–Curtis) | ||||||
| Landscape type | 1 | 0.08 | 0.08 | 2.46 | 0.06 | .004 |
| Site | 4 | 0.26 | 0.06 | 2.01 | 0.20 | .001 |
| Residuals | 30 | 0.97 | 0.03 | 0.74 | ||
| Total | 35 | 1.30 | 1.00 | |||
| Landscape (Unifrac, unweighted) | ||||||
| Landscape type | 1 | 0.08 | 0.08 | 2.19 | 0.06 | .042 |
| Site | 4 | 0.24 | 0.06 | 1.60 | 0.17 | .042 |
| Residuals | 30 | 1.12 | 0.04 | 0.78 | ||
| Total | 35 | 1.44 | 1.00 | |||
| Landscape (Unifrac, weighted) | ||||||
| Landscape type | 1 | 0.01 | 0.01 | 0.53 | 0.01 | .642 |
| Site | 4 | 0.12 | 0.03 | 2.88 | 0.27 | .016 |
| Residuals | 30 | 0.30 | 0.01 | 0.71 | ||
| Total | 35 | 0.43 | 1.00 | |||
Figure 3.
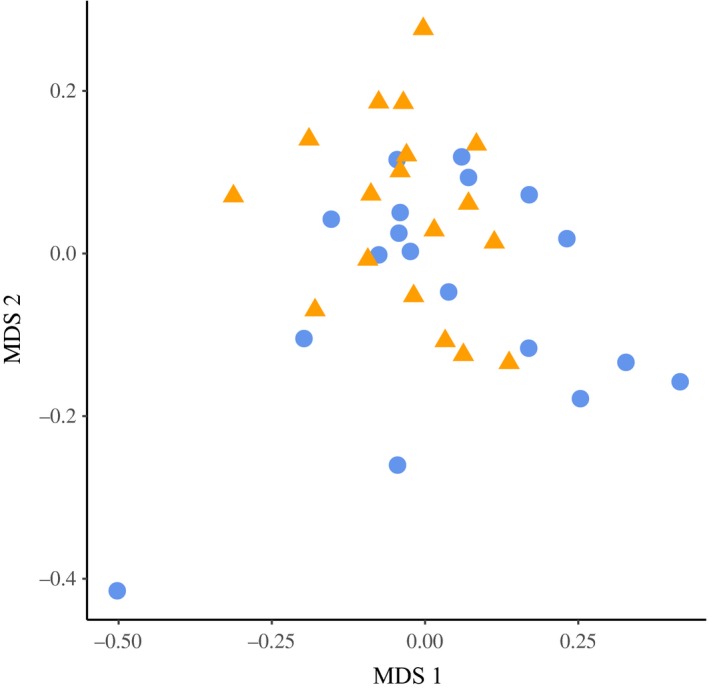
Nonmetric multidimensional scaling plot (based on Bray–Curtis distances) of OTU frequency for the gut microbial communities of honey bees in oilseed rape farmland (triangles) or farmland distant from oilseed rape (circles)
3.3. Which gut bacteria differ in bees exposed to different landscapes?
To identify which gut bacterial taxa differed between bees exposed to the two different landscape types focussed on in this study, we used the test implemented in DESeq2 (Table S2, Figure 2) and the ANCOM procedure. Notably, bacterial taxa belonging to the phylum Proteobacteria (the recently described species B. apis (Kešnerová et al., 2016), were found to be significantly different between bees foraging on OSR farms and those from areas distant to OSR farms under both ANCOM‐ and the DESeq2‐based procedure. Specifically, one of the nine dominant species clusters of the bee gut microbiota, B. apis, (Kwong & Moran, 2016) was higher in relative abundance in bees exposed to agricultural landscapes distant to OSR (Distant) than bees exposed to OSR farms (OSR; Table S2, Figure 2). In contrast, taxa assigned to the same Class (Alphaproteobacteria) as B. apis were found at higher relative abundance in bees exposed to OSR farms using the DESeq2 test only (although we note that very few sequence reads were assigned to the Alphaproteobacteria, ≪0.05%).
Under the DESeq2 test, taxa belonging to the Acetobacteraceae, Alpha 2.1, were also found at a higher relative abundance in bees foraging on OSR. Acetobacteraceae, Alpha 2.2, were in contrast higher in relative abundance in bees foraging in agricultural landscapes distant to OSR farms, and much lower in abundance overall compared to Alpha 2.1 (Table S2). Again using DESeq2, bacteria belonging to the Lactobacillaceae Family, Phylum Firmicutes (L. kunkeei), known to be a dominant crop (foregut) bacteria, also common in hive materials and nectar (Corby‐Harris, Maes, et al., 2014; Kwong & Moran, 2016) were also found to be higher in relative abundance in bees exposed to agricultural landscapes distant to OSR compared to bees exposed to OSR farms. However, although included in our more stringent dataset (where taxa with <500 reads were excluded), very few sequence reads were assigned to L. kunkeei (≪0.05%) with the exception of one sample (~10%; LS30, Distant). In contrast, taxa belonging to the recently described bee associated species Apibacter adventoris were found at higher relative abundance in bees exposed to OSR farms. However, we note that similar to what was found in L. kunkeei, A. adventoris read numbers were zero or very low in most bee samples (<0.05% total reads), only a very small number of samples had read numbers in the hundreds (>0.05% total reads), and one single sample had over 2,000 reads (~0.5% of total reads). Under the ANCOM test, bacteria assigned to the Lactobacillales Order (Phylum Firmicutes) were found to be higher in bees exposed to OSR farms. However, again read numbers in this taxa were very low (under 10) in almost all bee samples and show a severely skewed distributions and a few outliers.
4. DISCUSSION
In this study, we investigate the association between the gut microbiome and environmental landscape. We find that bees exposed to different landscape types and apiary sites exhibit significant differences in their gut microbial communities, although the variance explained by landscape type is relatively low. Specifically, we find that some taxa belonging to dominant members of the bee gut microbiota are differentially represented in bees foraging on the mass‐flowering crop oilseed rape, compared to those not foraging on this crop.
Our results lend further support to the presence of a core gut microbial community in honey bees with the main taxa previously characterized also being found in our samples (Moran, 2015). High consistency in the honey bee microbiome suggests that mutualistic relationships exist between the host and at least some members of the community, and comparative analysis of gene contents conducted in previous studies suggest beneficial roles in nutrition and digestion, while experiments with bumblebees have shown gut bacterial taxa offer protection from pathogens (Engel et al., 2012; Koch & Schmid‐Hempel, 2011b, 2012; Martinson et al., 2011; Moran, 2015). This may then imply that factors causing deviations from the normal microbial community in social bees are detrimental.
4.1. Microbial association with landscape exposure
We found that some members of the dominant microbial community of honey bee workers differ in relative abundance according to landscape exposure. These results are concordant across two different metrics (Bray–Curtis dissimilarities, Unifrac unweighted distances). We also find no difference in microbial community diversity (Shannon diversity index) between landscape types. Further, we also find differences in honey bee microbial diversity depending on site differences. Overall these results suggest that the environment that bees are exposed to, including environmental differences between individual sites, may affect their microbial community, particularly the relative abundance of some key taxa.
Specifically, here, we focus on reporting taxa found to be different in abundance between bees foraging on landscape types where landscape differences are known (i.e. OSR vs. not foraging on OSR), rather than between individual sites. Both tests of abundance we used show that honey bee workers foraging on OSR farms had a lower relative abundance of a dominant member of the bee gut community, an Alphaproteobacteria species B. apis, than bees not foraging on OSR. Bartonella apis shares >95% 16S rRNA sequence similarity with other species of the genus Bartonella which are a group of mammalian pathogens transmitted by bloodsucking arthropods (Kešnerová et al., 2016). Further, potentially key in the context of different environments, it has recently been shown that B. apis encodes genes which may be involved in the degradation of secondary plant metabolites (Segers et al. 2017). By contrast, taxa assigned to the same Class as B. apis (Alphaproteobacteria) were higher in relative abundance in bees foraging on OSR than those not foraging on OSR (supported singly by DESeq2 and therefore reported more cautiously). Also under the DESeq2 analysis only, taxa assigned to the Acetobacteraceae, Alpha 2.1, (also Class Alphaproteobacteria) were also found at higher relative abundances in bees foraging on OSR. The Alpha 2.1 group are predominantly found in the adult gut of several bee species, but also in nectar, pollen, hive materials, and larvae (reviewed in (Kwong & Moran, 2016). Alpha 2.2 (Acetobacteraceae) on the other hand were found in higher relative abundance in bees exposed to agricultural landscapes distant to OSR farms. Unsurprisingly, Alpha 2.2 were low in abundance overall in the foraging worker gut communities studied here as this taxa has been designated as a core hive bacterium that is specific to bees that feed the brood with royal jelly secreted from nurse hypopharyngeal glands (Corby‐Harris, Synder, et al., 2014). This taxa has also been reported to have a positive effect on honey bee larval survival (Corby‐Harris, Synder, et al., 2014), thus in future it may be interesting to determine whether the trend observed here in foragers is reflected in nurse workers and the hive environment.
Using DESeq2, we also find different abundances under the different environments of the Firmicutes bacteria, L. kunkeei, a dominant crop (foregut) species rare in the gut, but also common in materials in the honey bee environment, and A. adventoris. The crop microbial environment has been suggested to be functional in inoculation and decontamination of food resources (Corby‐Harris, Maes, et al., 2014), however trends observed here in L. kunkeei and also A. adventoris require further investigation as these species were represented in very low read numbers, there was large read number variation in some samples, and we did not include the crop in our analysis of the gut.
What do such differences in a bee's microbial community mean? To date, the most abundant gene function category (Clusters of Orthologous Groups – COG) found to be enriched in the honey bee metagenome, in a metagenome sequencing study (Engel et al., 2012), is the category carbohydrate metabolism and transport (20%). A further carbohydrate‐related function enriched in the honey bee, and detected across all major gut bacterial taxa, is the family arabinose efflux permease with many of these proteins showing homology to drug resistance efflux pumps (Engel et al., 2012). Importantly, these efflux pump functions may therefore be further selected upon when honey bees are exposed to pesticides or antimicrobial compounds (Engel et al., 2012). Interestingly, a recent study of the gut microbiome of bees exposed to commonly used in‐hive pesticides (coumaphos, tau‐fluvalinate, and chlorothalonil) found that pesticide exposure affected the impact of environment site on the honey bee bacterial community (Kakumanu, Reeves, Anderson, Rodrigues, & Williams, 2016). Furthermore, it has been shown in Riptortus pedestris stinkbugs that gut bacterial symbionts confer resistance to chemical insecticides (fenitrothion), with exposure to the insecticide enriching the insecticide‐degrading bacteria (Burkholderia) in the agroecosystem, that are then environmentally acquired by insect hosts (Kikuchi et al., 2012). We note that the concentrations of neonicotinoid pesticides detected in our studies are on the low end of the scale compared to those reported in other studies, and 15 times lower than those reported by Rundlöf et al., (2015) where negative impacts on colony growth and reproduction were found for bumblebee colonies, but not honey bee colonies (see also Balfour et al., 2017). There are a number of reasons for these differences including the fact that neonicotinoids are readily leached from seed dressings leaving a variable amount of the active ingredient to be absorbed by the plant's root system, and that winter (the OSR farm sites in our study were “winter‐sown” crops) is the season where the maximum transport of agrochemical pollutants to watercourses occurs (Sur & Stork, 2003; Wilson, Ball, & Hinton, 1999). However, interestingly, Balfour et al. (2017) showed that under the low neonicotinoid concentrations, there was a small but significant negative relationship between pollen and honey contamination, and colony weight gain.
Additionally, pollen from different plant species differs in the composition of secondary metabolites such as polyphenols and other aromatic compounds. In a recent comparative genomics study of Bartonella, it was shown that B. apis possess pathways for the degradation of aromatic compounds and that these pathways may facilitate the breakdown of specific pollen components (Segers et al. 2017). It is therefore plausible that some of the differences found here between gut bacterial communities of bees exposed to different landscapes, and between individual apiary sites, relate to differences in diet and pesticide exposure, however direct experimental tests are required to confirm this. Also noteworthy, is that the taxa represented in different relative abundances in the different landscape types in the current study do not overlap with taxa suggested to trend toward increased prevalence and diversity in more productive colonies (e.g. Lactobacillus species such as Firm‐4) (Horton, Oliver, & Newton, 2015). Interestingly, Horton et al., (2015) also suggest that overall colony productivity is not consistently correlated with forager gut microbial community.
Mass‐flowering crops such as OSR have been shown to enhance pollinator abundance because they provide additional pollen and nectar resources (Holzschuh, Dormann, Tscharntke, & Steffan‐Dewenter, 2013; Riedinger, Renner, Rundlöf, Steffan‐Dewenter, & Holzschuh, 2014; Schürch, Couvillon, & Ratnieks, 2016; Westphal, Steffan‐Dewenter, & Tscharntke, 2003). Therefore, greater abundance of forage and of a specific forage type may drive microbial community composition. The nutritional quality of pollen, also including the alternative pollen resources detected for different sites, may also affect community composition. For example, if bees need to consume more pollen to acquire sufficient nutrients, more pollen may potentially accumulate in the rectum and in turn more bacteria may be able to colonize the rectum. In addition, higher stress levels have been found to cause a reduction in microbial community diversity in other systems (Stothart et al., 2016) and could potentially cause a reduction in the ability of worker bees to combat infections. Honey bees exposed to the neonicotinoid imidacloprid, for example, have been reported to show an increase in infection of Nosema spp gut parasites (Pettis, vanEngelsdorp, Johnson, & Dively, 2012). We found no difference in microbial community diversity between the different environments, but it is important to note that the interaction between infection and microbial community is complex and can operate in both directions.
To date, host environmental habitat and the ecological conditions shaping the microbial community in the field (as opposed to lab reared hosts) has received comparatively little attention. However, habitat type (seminatural vs. cranberry farm agricultural sites in the USA) was found to have little effect on bumblebee gut microbiota (Cariveau, Powell, Koch, Winfree, & Moran, 2014). By comparison, in a recent characterization of a large number of insects and their associated gut bacteria, relative bacterial abundances in the gut were found to vary according to the environmental habitats of the insects (Yun et al., 2014). This variation was suggested to be most likely associated with the levels of oxygen available in the habitat of the insects (Yun et al., 2014).
We provide evidence for some influence of environmental exposure, broad landscape type, and also different individual apiary sites, on honey bee microbial community. Our results underscore the possibility that different landscape parameters, such as forage type and neonicotinoid pesticide exposure, may influence dominant honey bee gut bacteria and that future laboratory‐based studies are imperative for understanding what is driving these differences. This work highlights the complex interplay of the host, its gut bacteria, and the environment, and identifies focal bacteria taxa as targets for functional analyses.
CONFLICT OF INTEREST
None declared.
AUTHOR CONTRIBUTION
JCJ conducted study design, fieldwork, laboratory work, analyses, and wrote the paper. CF conducted analyses and wrote the paper. FH conducted analyses and wrote the paper. HAT conducted fieldwork and analyses. NJB conducted fieldwork and analyses. PB contributed to writing and editing the paper. PE developed the custom honey bee bacterial database and contributed to writing the paper. FLWR conducted study design. WOHH conducted study design and wrote the paper.
Supporting information
ACKNOWLEDGMENTS
We thank Luciano Scandian for beekeeping assistance. We are grateful to Thierry Gosselin for bioinformatics support in the initial stages of this project. This work was funded by a Marie Curie IEF (SoDoLS ‐ 626555) (JCJ) and the C.B. Dennis British Beekeepers’ Research Trust (JCJ, WOHH).
Jones JC, Fruciano C, Hildebrand F, et al. Gut microbiota composition is associated with environmental landscape in honey bees. Ecol Evol. 2018;8:441–451. https://doi.org/10.1002/ece3.3597
REFERENCES
- Anderson, M. J. (2001). A new method for non‐parametric multivariate analysis of variance. Austral Ecology, 26, 32–46. https://doi.org/10.1111/j.1442-9993.2001.01070.pp.x [Google Scholar]
- Babendreier, D. , Joller, D. , Romeis, J. R. , Bigler, F. , & Widmer, F. (2006). Bacterial community structures in honeybee intestines and their response to two insecticidal proteins. FEMS Microbiology Ecology, 59, 600–610. https://doi.org/10.1111/j.1574-6941.2006.00249.x [DOI] [PubMed] [Google Scholar]
- Balfour, N. J. , Al Toufailia, H. , Scandian, L. , Blanchard, H. E. , Jesse, M. P. , Carreck, N. L. , & Ratnieks, F. L. W. (2017). Landscape scale study of the net effect of proximity to a neonicotinoid‐treated crop on bee colony health. Environmental Science & Technology, 51, 10825–10833. https://doi.org/10.1021/acs.est.7b02236 [DOI] [PubMed] [Google Scholar]
- Benjamini, Y. , & Hochberg, Y. (1995). Controlling the false discovery rate: A practical and powerful approach to multiple testing. Journal of the Royal Statistical Society Series B, 57, 289–300. http://www.jstor.org/stable/2346101 [Google Scholar]
- Bosch, T. C. G. , & McFall‐Ngai, M. J. (2011). Metaorganisms as the new frontier. Zoology, 114, 185–190. https://doi.org/10.1016/j.zool.2011.04.001 [DOI] [PMC free article] [PubMed] [Google Scholar]
- Botías, C. , David, A. , Horwood, J. , Abdul‐Sada, A. , Nicholls, E. , Hill, E. , & Goulson, D. (2015). Neonicotinoid residues in wildflowers, a potential route of chronic exposure for bees. Environmental Science & Technology, 49, 12731–12740. https://doi.org/10.1021/acs.est.5b03459 [DOI] [PubMed] [Google Scholar]
- Bottacini, F. , Milani, C. , Turroni, F. , Sánchez, B. , Foroni, E. , Duranti, S. , … Ventura, M. (2012). Bifidobacterium asteroides PRL2011 genome analysis reveals clues for colonization of the insect gut. PLoS ONE, 7, e44229 https://doi.org/10.1371/journal.pone.0044229 [DOI] [PMC free article] [PubMed] [Google Scholar]
- Brucker, R. M. , & Bordenstein, S. R. (2012). Speciation by symbiosis. Trends in Ecology & Evolution, 27, 443–451. https://doi.org/10.1016/j.tree.2012.03.011 [DOI] [PubMed] [Google Scholar]
- Brucker, R. M. , & Bordenstein, S. R. (2013). The hologenomic basis of speciation: Gut bacteria cause hybrid lethality in the genus Nasonia. Science, 341, 667–669. https://doi.org/10.1126/science.1240659 [DOI] [PubMed] [Google Scholar]
- Caporaso, J. G. , Lauber, C. L. , Walters, W. A. , Berg‐Lyons, D. , Huntley, J. , Fierer, N. , … Knight, R. (2012). Ultra‐high‐throughput microbial community analysis on the Illumina HiSeq and MiSeq platforms. The ISME Journal, 6, 1621–1624. https://doi.org/10.1038/ismej.2012.8 [DOI] [PMC free article] [PubMed] [Google Scholar]
- Cariveau, D. P. , Powell, J. E. , Koch, H. , Winfree, R. , & Moran, N. A. (2014). Variation in gut microbial communities and its association with pathogen infection in wild bumble bees (Bombus). The ISME Journal, 8, 2369–2379. https://doi.org/10.1038/ismej.2014.68 [DOI] [PMC free article] [PubMed] [Google Scholar]
- Castro‐Conde, I. , & de Uña Álvarez, J. (2014). sgof: Multiple hypothesis testing. R package version 2.1. 1. https://crantastic.org/packages/sgof/versions/35516
- Corby‐Harris, V. , Maes, P. , & Anderson, K. E. (2014). The bacterial communities associated with honey bee (Apis mellifera) foragers. PLoS ONE, 9, e95056‐13 https://doi.org/10.1371/journal.pone.0095056 [DOI] [PMC free article] [PubMed] [Google Scholar]
- Corby‐Harris, V. , Snyder, L. A. , Schwan, M. R. , Maes, P. , McFrederick, Q. S. , & Anderson, K. E. (2014). Origin and effect of Alpha 2.2 Acetobacteraceae in honey bee larvae and description of Parasaccharibacter apium gen. nov., sp. nov. Applied and Environmental Microbiology, 80, 7460–7472. https://doi.org/10.1128/AEM.02043-14 [DOI] [PMC free article] [PubMed] [Google Scholar]
- Couvillon, M. J. , Schürch, R. , & Ratnieks, F. L. W. (2014). Waggle dance distances as integrative indicators of seasonal foraging challenges. PLoS ONE, 9, e93495 https://doi.org/10.1371/journal.pone.0093495 [DOI] [PMC free article] [PubMed] [Google Scholar]
- Cox‐Foster, D. L. , Conlan, S. , Holmes, E. C. , Palacios, G. , Evans, J. D. , Moran, N. A. , … Lipkin, W. I. (2007). A metagenomic survey of microbes in honey bee colony collapse disorder. Science, 318, 283–287. https://doi.org/10.1126/science.1146498 [DOI] [PubMed] [Google Scholar]
- Cutler, G. C. , & Scott‐Dupree, C. D. (2014). A field study examining the effects of exposure to neonicotinoid seed‐treated corn on commercial bumble bee colonies. Ecotoxicology, 23, 1755–1763. https://doi.org/10.1007/s10646-014-1340-5 [DOI] [PubMed] [Google Scholar]
- DEFRA Pesticide Usage Report 263 : Arable Crops in the United Kingdom; https://secure.fera.defra.gov.uk/pusstats/surveys/2014surveys.cfm. Accessed September 2015.
- Edgar, R. C. (2013). UPARSE: Highly accurate OTU sequences from microbial amplicon reads. Nature Methods, 10, 996–998. https://doi.org/10.1038/nmeth.2604 [DOI] [PubMed] [Google Scholar]
- Edgar, R. C. , Haas, B. J. , Clemente, J. C. , Quince, C. , & Knight, R. (2011). UCHIME improves sensitivity and speed of chimera detection. Bioinformatics, 27, 2194–2200. https://doi.org/10.1093/bioinformatics/btr381 [DOI] [PMC free article] [PubMed] [Google Scholar]
- Ellegaard, K. M. , Tamarit, D. , Javelind, E. , Olofsson, T. C. , Andersson, S. G. , & Vásquez, A. (2015). Extensive intra‐phylotype diversity in lactobacilli and bifidobacteria from the honeybee gut. BMC Genomics, 16, 284 https://doi.org/10.1186/s12864-015-1476-6 [DOI] [PMC free article] [PubMed] [Google Scholar]
- Engel, P. , Bartlett, K. D. , & Moran, N. A. (2015). The bacterium Frischella perrara causes scab formation in the gut of its honeybee host. mBio, 6, e00193‐15 https://doi.org/10.1128/mBio.00193-15 [DOI] [PMC free article] [PubMed] [Google Scholar]
- Engel, P. , Kwong, W. K. , McFrederick, Q. , Anderson, K. E. , Barribeau, S. M. , Chandler, J. A. , … Dainat, B.. (2016). The bee microbiome: Impact on bee health and model for evolution and ecology of host‐microbe interactions. mBio, 7, e02164‐15 https://doi.org/10.1128/mBio.02164-15 [DOI] [PMC free article] [PubMed] [Google Scholar]
- Engel, P. , Kwong, W. K. , & Moran, N. A. (2013). Frischella perrara gen. nov., sp. nov., a gammaproteobacterium isolated from the gut of the honeybee, Apis mellifera . International Journal of Systematic and Evolutionary Microbiology, 63, 3646–3651. https://doi.org/10.1099/ijs.0.049569-0 [DOI] [PubMed] [Google Scholar]
- Engel, P. , Martinson, V. G. , & Moran, N. A. (2012). Functional diversity within the simple gut microbiota of the honey bee. Proceedings of the National Academy of Sciences, 109, 11002–11007. https://doi.org/10.1073/pnas.1202970109 [DOI] [PMC free article] [PubMed] [Google Scholar]
- Engel, P. , Stepanauskas, R. , & Moran, N. A. (2014). Hidden diversity in honey bee gut symbionts detected by single‐cell genomics. PLoS Genetics, 10, e1004596 https://doi.org/10.1371/journal.pgen.1004596 [DOI] [PMC free article] [PubMed] [Google Scholar]
- Feldhaar, H. (2011). Bacterial symbionts as mediators of ecologically important traits of insect hosts. Ecological Entomology, 36, 533–543. https://doi.org/10.1111/een.2011.36.issue-5 [Google Scholar]
- Franchini, P. , Fruciano, C. , Frickey, T. , Jones, J. C. , & Meyer, A. (2014). The gut microbial community of midas cichlid fish in repeatedly evolved limnetic‐benthic species pairs. PLoS ONE, 9, e95027‐7 https://doi.org/10.1371/journal.pone.0095027 [DOI] [PMC free article] [PubMed] [Google Scholar]
- Gallai, N. , Salles, J.‐M. , Settele, J. , & Vaissière, B. E. (2009). Economic valuation of the vulnerability of world agriculture confronted with pollinator decline. Ecological Economics, 68, 810–821. https://doi.org/10.1016/j.ecolecon.2008.06.014 [Google Scholar]
- Gibson, C. M. , & Hunter, M. S. (2010). Extraordinarily widespread and fantastically complex: Comparative biology of endosymbiotic bacterial and fungal mutualists of insects. Ecology Letters, 13, 223–234. https://doi.org/10.1111/ele.2010.13.issue-2 [DOI] [PubMed] [Google Scholar]
- Goulson, D. , Nicholls, E. , Botías, C. , & Rotheray, E. L. (2015). Bee declines driven by combined stress from parasites, pesticides, and lack of flowers. Science, 347, 1255957 https://doi.org/10.1126/science.1255957 [DOI] [PubMed] [Google Scholar]
- Hauswedell, H. , Singer, J. , & Reinert, K. (2014). Lambda: The local aligner for massive biological data. Bioinformatics, 30, i349–i355. https://doi.org/10.1093/bioinformatics/btu439 [DOI] [PMC free article] [PubMed] [Google Scholar]
- Hildebrand, F. , Ebersbach, T. , Nielsen, H. B. , Li, X. , Sonne, S. B. , Bertalan, M. , … Licht, T. R. (2012). A comparative analysis of the intestinal metagenomes present in guinea pigs (Cavia porcellus) and humans (Homo sapiens). BMC Genomics, 13, 514 https://doi.org/10.1186/1471-2164-13-514 [DOI] [PMC free article] [PubMed] [Google Scholar]
- Hildebrand, F. , Tadeo, R. , Voigt, A. Y. , Bork, P. , & Raes, J. (2014). LotuS: An efficient and user‐friendly OTU processing pipeline. Microbiome, 2, 30 https://doi.org/10.1186/2049-2618-2-30 [DOI] [PMC free article] [PubMed] [Google Scholar]
- Holzschuh, A. , Dormann, C. F. , Tscharntke, T. , & Steffan‐Dewenter, I. (2013). Mass‐flowering crops enhance wild bee abundance. Oecologia, 172, 477–484. https://doi.org/10.1007/s00442-012-2515-5 [DOI] [PMC free article] [PubMed] [Google Scholar]
- Horton, M. A. , Oliver, R. , & Newton, I. L. (2015). No apparent correlation between honey bee forager gut microbiota and honey production. PeerJ, 3, e1329‐14 https://doi.org/10.7717/peerj.1329 [DOI] [PMC free article] [PubMed] [Google Scholar]
- Ishak, H. D. , Plowes, R. , Sen, R. , Kellner, K. , Meyer, E. , Estrada, D. A. , … Mueller, U. G. (2011). Bacterial diversity in Solenopsis invicta and Solenopsis geminata ant colonies characterized by 16S amplicon 454 pyrosequencing. Microbial Ecology, 61, 821–831. https://doi.org/10.1007/s00248-010-9793-4 [DOI] [PubMed] [Google Scholar]
- Jaenike, J. , Unckless, R. , Cockburn, S. N. , Boelio, L. M. , & Perlman, S. J. (2010). Adaptation via symbiosis: Recent spread of a Drosophila defensive symbiont. Science, 329, 212–215. https://doi.org/10.1126/science.1188235 [DOI] [PubMed] [Google Scholar]
- Jeyaprakash, A. , Hoy, M. A. , & Allsopp, M. H. (2003). Bacterial diversity in worker adults of Apis mellifera capensis and Apis mellifera scutellata (Insecta: Hymenoptera) assessed using 16S rRNA sequences. Journal of Invertebrate Pathology, 84, 96–103. https://doi.org/10.1016/j.jip.2003.08.007 [DOI] [PubMed] [Google Scholar]
- Kakumanu, M. L. , Reeves, A. M. , Anderson, T. D. , Rodrigues, R. R. , & Williams, M. A. (2016). Honey bee gut microbiome is altered by in‐hive pesticide exposures. Frontiers in Microbiology, 7, 1255 https://doi.org/10.3389/fmicb.2016.01255 [DOI] [PMC free article] [PubMed] [Google Scholar]
- Kamel, A. (2010). Refined methodology for the determination of neonicotinoid pesticides and their metabolites in honey bees and bee products by liquid chromatography–tandem mass spectrometry (LC‐MS/MS)†. Journal of Agricultural and Food Chemistry, 58, 5926–5931. https://doi.org/10.1021/jf904120n [DOI] [PubMed] [Google Scholar]
- Kešnerová, L. , Moritz, R. , & Engel, P. (2016). Bartonella apis sp. nov., a honey bee gut symbiont of the class Alphaproteobacteria . International Journal of Systematic and Evolutionary Microbiology, 66, 414–421. https://doi.org/10.1099/ijsem.0.000736 [DOI] [PubMed] [Google Scholar]
- Kikuchi, Y. , Hayatsu, M. , Hosokawa, T. , Nagayama, A. , Tago, K. , & Fukatsu, T. (2012). Symbiont‐mediated insecticide resistance. Proceedings of the National Academy of Sciences of the United States of America, 109, 8618–8622. https://doi.org/10.1073/pnas.1200231109 [DOI] [PMC free article] [PubMed] [Google Scholar]
- Koch, H. , & Schmid‐Hempel, P. (2011a). Bacterial communities in central European bumblebees: Low diversity and high specificity. Microbial Ecology, 62, 121–133. https://doi.org/10.1007/s00248-011-9854-3 [DOI] [PubMed] [Google Scholar]
- Koch, H. , & Schmid‐Hempel, P. (2011b). Socially transmitted gut microbiota protect bumble bees against an intestinal parasite. Proceedings of the National Academy of Sciences of the United States of America, 108, 19288–19292. https://doi.org/10.1073/pnas.1110474108 [DOI] [PMC free article] [PubMed] [Google Scholar]
- Koch, H. , & Schmid‐Hempel, P. (2012). Gut microbiota instead of host genotype drive the specificity in the interaction of a natural host‐parasite system. Ecology Letters, 15, 1095–1103. https://doi.org/10.1111/j.1461-0248.2012.01831.x [DOI] [PubMed] [Google Scholar]
- Kruskal, J. B. (1964a). Multidimensional scaling by optimizing goodness of fit to a nonmetric hypothesis. Psychometrika, 29, 1–27. https://doi.org/10.1007/BF02289565 [Google Scholar]
- Kruskal, J. B. (1964b). Nonmetric multidimensional scaling: A numerical method. Psychometrika, 29, 115–129. https://doi.org/10.1007/BF02289694 [Google Scholar]
- Kwong, W. K. , Engel, P. , Koch, H. , & Moran, N. A. (2014). Genomics and host specialization of honey bee and bumble bee gut symbionts. Proceedings of the National Academy of Sciences, 111, 11509–11514. https://doi.org/10.1073/pnas.1405838111 [DOI] [PMC free article] [PubMed] [Google Scholar]
- Kwong, W. K. , Medina, L. A. , Koch, H. , Sing, K.‐W. , Soh, E. J. Y. , Ascher, J. S. , … Moran, N. A. (2017). Dynamic microbiome evolution in social bees. Science, 3, e1600513 https://doi.org/10.1126/sciadv.1600513 [DOI] [PMC free article] [PubMed] [Google Scholar]
- Kwong, W. K. , & Moran, N. A. (2013). Cultivation and characterization of the gut symbionts of honey bees and bumble bees: Description of Snodgrassella alvi gen. nov., sp. nov., a member of the family Neisseriaceae of the Betaproteobacteria, and Gilliamella apicola gen. nov., sp. nov., a member of Orbaceae fam. nov., Orbales ord. nov., a sister taxon to the order “Enterobacteriales” of the Gammaproteobacteria . International Journal of Systematic and Evolutionary Microbiology, 63, 2008–2018. https://doi.org/10.1099/ijs.0.044875-0 [DOI] [PubMed] [Google Scholar]
- Kwong, W. K. , & Moran, N. A. (2016). Gut microbial communities of social bees. Nature Reviews. Microbiology, 14, 374–384. https://doi.org/10.1038/nrmicro.2016.43 [DOI] [PMC free article] [PubMed] [Google Scholar]
- Lee, F. J. , Rusch, D. B. , Stewart, F. J. , Mattila, H. R. , & Newton, I. L. G. (2015). Saccharide breakdown and fermentation by the honey bee gut microbiome. Environmental Microbiology, 17, 796–815. https://doi.org/10.1111/emi.2015.17.issue-3 [DOI] [PubMed] [Google Scholar]
- Love, M. I. , Huber, W. , & Anders, S. (2014). Moderated estimation of fold change and dispersion for RNA‐seq data with DESeq2. Genome Biology, 15, 550 https://doi.org/10.1186/s13059-014-0550-8 [DOI] [PMC free article] [PubMed] [Google Scholar]
- Lozupone, C. , & Knight, R. (2005). UniFrac: A new phylogenetic method for comparing microbial communities. Applied and Environmental Microbiology, 71, 8228–8235. https://doi.org/10.1128/AEM.71.12.8228-8235.2005 [DOI] [PMC free article] [PubMed] [Google Scholar]
- Magoč, T. , & Salzberg, S. L. (2011). FLASH: Fast length adjustment of short reads to improve genome assemblies. Bioinformatics, 27, 2957–2963. https://doi.org/10.1093/bioinformatics/btr507 [DOI] [PMC free article] [PubMed] [Google Scholar]
- Mandal, S. , Van Treuren, W. , & White, R. A. (2015). Analysis of composition of microbiomes: A novel method for studying microbial composition. Microbial Ecology in Health and Disease, 26, 27663 https://doi.org/10.3402/mehd.v26.27663 [DOI] [PMC free article] [PubMed] [Google Scholar]
- Mantel, N. (1967). The detection of disease clustering and a generalized regression approach. Cancer Research, 27, 209–220. [PubMed] [Google Scholar]
- Martinson, V. G. , Danforth, B. N. , Minckley, R. L. , Rueppell, O. , Tingek, S. , & Moran, N. A. (2011). A simple and distinctive microbiota associated with honey bees and bumble bees. Molecular Ecology, 20, 619–628. https://doi.org/10.1111/mec.2011.20.issue-3 [DOI] [PubMed] [Google Scholar]
- McMurdie, P. J. , & Holmes, S. (2013). phyloseq: An R package for reproducible interactive analysis and graphics of microbiome census data. PLoS ONE, 8, e61217‐11 https://doi.org/10.1371/journal.pone.0061217 [DOI] [PMC free article] [PubMed] [Google Scholar]
- McMurdie, P. J. , & Holmes, S. (2014). Waste not, want not: Why rarefying microbiome data is inadmissible. PLoS Computational Biology, 10, e1003531 https://doi.org/10.1371/journal.pcbi.1003531 [DOI] [PMC free article] [PubMed] [Google Scholar]
- Mohr, K. I. , & Tebbe, C. C. (2006). Diversity and phylotype consistency of bacteria in the guts of three bee species (Apoidea) at an oilseed rape field. Environmental Microbiology, 8, 258–272. https://doi.org/10.1111/emi.2006.8.issue-2 [DOI] [PubMed] [Google Scholar]
- Moran, N. A. (2015). Genomics of the honey bee microbiome. Current Opinion in Insect Science, 10, 22–28. https://doi.org/10.1016/j.cois.2015.04.003 [DOI] [PMC free article] [PubMed] [Google Scholar]
- Moran, N. A. , Hansen, A. K. , Powell, J. E. , & Sabree, Z. L. (2012). Distinctive gut microbiota of honey bees assessed using deep sampling from individual worker bees. PLoS ONE, 7, e36393 https://doi.org/10.1371/journal.pone.0036393 [DOI] [PMC free article] [PubMed] [Google Scholar]
- Moran, N. A. , McCutcheon, J. P. , & Nakabachi, A. (2008). Genomics and evolution of heritable bacterial symbionts. Annual Review of Genetics, 42, 165–190. https://doi.org/10.1146/annurev.genet.41.110306.130119 [DOI] [PubMed] [Google Scholar]
- Moya, A. , Peretó, J. , Gil, R. , & Latorre, A. (2008). Learning how to live together: Genomic insights into prokaryote‐animal symbioses. Nature Reviews Genetics, 9, 218–229. https://doi.org/10.1038/nrg2319 [DOI] [PubMed] [Google Scholar]
- Oksanen, J. , Guillaume Blanchet, F. , Kindt, R. , Legendre, P. , Minchin, P. R. , OHara, R. B. , … Wagner, H. (2016). vegan: Community ecology package.
- Ollerton, J. , Winfree, R. , & Tarrant, S. (2011). How many flowering plants are pollinated by animals? Oikos, 120, 321–326. https://doi.org/10.1111/more.2010.120.issue-3 [Google Scholar]
- Olofsson, T. C. , & Vásquez, A. (2008). Detection and identification of a novel lactic acid bacterial flora within the honey stomach of the honeybee Apis mellifera . Current Microbiology, 57, 356–363. https://doi.org/10.1007/s00284-008-9202-0 [DOI] [PubMed] [Google Scholar]
- Paradis, E. , Claude, J. , & Strimmer, K. (2004). APE: Analyses of phylogenetics and evolution in R language. Bioinformatics, 20, 289–290. https://doi.org/10.1093/bioinformatics/btg412 [DOI] [PubMed] [Google Scholar]
- Pettis, J. S. , vanEngelsdorp, D. , Johnson, J. , & Dively, G. (2012). Pesticide exposure in honey bees results in increased levels of the gut pathogen Nosema . Naturwissenschaften, 99, 153–158. https://doi.org/10.1007/s00114-011-0881-1 [DOI] [PMC free article] [PubMed] [Google Scholar]
- Pilling, E. , Campbell, P. , Coulson, M. , Ruddle, N. , & Tornier, I. (2013). A four‐year field program investigating long‐term effects of repeated exposure of honey bee colonies to flowering crops treated with thiamethoxam. PLoS ONE, 8, e77193 https://doi.org/10.1371/journal.pone.0077193 [DOI] [PMC free article] [PubMed] [Google Scholar]
- Riedinger, V. , Renner, M. , Rundlöf, M. , Steffan‐Dewenter, I. , & Holzschuh, A. (2014). Early mass‐flowering crops mitigate pollinator dilution in late‐flowering crops. Landscape Ecology, 29, 425–435. https://doi.org/10.1007/s10980-013-9973-y [Google Scholar]
- Rolke, D. , Fuchs, S. , Grünewald, B. , Gao, Z. , & Blenau, W. (2016). Large‐scale monitoring of effects of clothianidin‐dressed oilseed rape seeds on pollinating insects in Northern Germany: Effects on honey bees (Apis mellifera). Ecotoxicology, 25, 1648–1665. https://doi.org/10.1007/s10646-016-1725-8 [DOI] [PMC free article] [PubMed] [Google Scholar]
- Rosengaus, R. B. , Zecher, C. N. , Schultheis, K. F. , Brucker, R. M. , & Bordenstein, S. R. (2011). Disruption of the termite gut microbiota and its prolonged consequences for fitness. Applied and Environmental Microbiology, 77, 4303–4312. https://doi.org/10.1128/AEM.01886-10 [DOI] [PMC free article] [PubMed] [Google Scholar]
- Rundlöf, M. , Andersson, G. K. S. , Bommarco, R. , Fries, I. , Hederström, V. , Herbertsson, L. , … Smith, H. G. (2015). Seed coating with a neonicotinoid insecticide negatively affects wild bees. Nature, 521, 77–80. https://doi.org/10.1038/nature14420 [DOI] [PubMed] [Google Scholar]
- Sabree, Z. L. , Hansen, A. K. , & Moran, N. A. (2012). Independent studies using deep sequencing resolve the same set of core bacterial species dominating gut communities of honey bees. PLoS ONE, 7, e41250 https://doi.org/10.1371/journal.pone.0041250 [DOI] [PMC free article] [PubMed] [Google Scholar]
- Scardovi, V. , & Trovatelli, L. D. (1969). New species of bifidobacteria from Apis mellifica L. and Apis indica F. A contribution to the taxonomy and biochemistry of the genus Bifidobacterium . Zentralblatt fur Bakteriologie, Parasitenkunde, Infektionskrankheiten und Hygiene, 123, 64–88. [PubMed] [Google Scholar]
- Schliep, K. P. (2011). phangorn: Phylogenetic analysis in R. Bioinformatics, 27, 592–593. https://doi.org/10.1093/bioinformatics/btq706 [DOI] [PMC free article] [PubMed] [Google Scholar]
- Schürch, R. , Couvillon, M. J. , & Ratnieks, F. L. W. (2016). Determining the foraging potential of oilseed rape to honey bees using aerial surveys and simulations. Journal of Apicultural Research, 54, 238–245. https://doi.org/10.1080/00218839.2015.1108144 [Google Scholar]
- Segers, F.H.I.D , Kesnerova, L. , Kosoy M., & Engel, P . (2017). Genomic changes associated with the evolutionary transition of an insect gut symbiont into a blood‐borne pathogen. The ISME journal, 11, 1232–1244. [DOI] [PMC free article] [PubMed] [Google Scholar]
- Stothart, M. R. , Bobbie, C. B. , Schulte‐Hostedde, A. I. , Boonstra, R. , Palme, R. , Mykytczuk, N. C. S. , & Newman, A. E. M. (2016). Stress and the microbiome: Linking glucocorticoids to bacterial community dynamics in wild red squirrels. Biology Letters, 12, 20150875 https://doi.org/10.1098/rsbl.2015.0875 [DOI] [PMC free article] [PubMed] [Google Scholar]
- Sur, R. , & Stork, A. (2003). Uptake, translocation and metabolism of imidacloprid in plants. Bulletin of Insectology, 56, 35–40. [Google Scholar]
- Suryanarayanan, S. (2015). Pesticides and pollinators: A context‐sensitive policy approach. Current Opinion in Insect Science, 10, 149–155. https://doi.org/10.1016/j.cois.2015.05.009 [DOI] [PubMed] [Google Scholar]
- Thompson, H. , & Harrington, P. (2013). Effects of neonicotinoid seed treatments on bumble bee colonies under field conditions. Retrieved from https://pdfs.semanticscholar.org/c278/06708d41b0fc8e30166d2959994d821ab3ca.pdf.
- Wang, Q. , Garrity, G. M. , & Tiedje, J. M. (2007). Naive Bayesian classifier for rapid assignment of rRNA sequences into the new bacterial taxonomy. Applied and Environmental Microbiology, 73, 5261–5267. https://doi.org/10.1128/AEM.00062-07 [DOI] [PMC free article] [PubMed] [Google Scholar]
- Weiss, S. , Xu, Z. Z. , Peddada, S. , Amir, A. , Bittinger, K. , Gonzalez, A. , … Knight, R. (2017). Normalization and microbial differential abundance strategies depend upon data characteristics. Microbiome, 5, 27 https://doi.org/10.1186/s40168-017-0237-y [DOI] [PMC free article] [PubMed] [Google Scholar]
- Westphal, C. , Steffan‐Dewenter, I. , & Tscharntke, T. (2003). Mass flowering crops enhance pollinator densities at a landscape scale. Ecology Letters, 6, 961–965. https://doi.org/10.1046/j.1461-0248.2003.00523.x [Google Scholar]
- Wickham, H. (2009). ggplot2: Elegant graphics for data analysis. New York: Springer‐Verlag; https://doi.org/10.1007/978-0-387-98141-3 [Google Scholar]
- Wilson, W. S. , Ball, A. S. , & Hinton, R. H. , Eds. (1999). Managing risks of nitrates to humans and the environment. UK: Cambridge; https://doi.org/10.1533/9781845693206 [Google Scholar]
- Yun, J. H. , Roh, S. W. , Whon, T. W. , Jung, M. J. , Kim, M. S. , Park, D. S. , … Bae, J. W. (2014). Insect gut bacterial diversity determined by environmental habitat, diet, developmental stage, and phylogeny of host. Applied and Environmental Microbiology, 80, 5254–5264. https://doi.org/10.1128/AEM.01226-14 [DOI] [PMC free article] [PubMed] [Google Scholar]
Associated Data
This section collects any data citations, data availability statements, or supplementary materials included in this article.
Supplementary Materials