

Abstract
p63, more specifically its ΔNp63α isoform, plays essential roles in squamous cell carcinomas (SCCs), yet the mechanisms controlling its nuclear transport remain unknown. Nucleoporins (NUPs) are a family of proteins building nuclear pore complexes (NPC) and mediating nuclear transport across the nuclear envelope. Recent evidence suggests a cell type‐specific function for certain NUPs; however, the significance of NUPs in SCC biology remains unknown. In this study, we show that nucleoporin 62 (NUP62) is highly expressed in stratified squamous epithelia and is further elevated in SCCs. Depletion of NUP62 inhibits proliferation and augments differentiation of SCC cells. The impaired ability to maintain the undifferentiated status is associated with defects in ΔNp63α nuclear transport. We further find that differentiation‐inducible Rho kinase reduces the interaction between NUP62 and ΔNp63α by phosphorylation of phenylalanine–glycine regions of NUP62, attenuating ΔNp63α nuclear import. Our results characterize NUP62 as a gatekeeper for ΔNp63α and uncover its role in the control of cell fate through regulation of ΔNp63α nuclear transport in SCC.
Subject Categories: Cancer, Membrane & Intracellular Transport
Introduction
Squamous cell carcinomas (SCCs) are lethal malignancies arising from the stratified epithelia of skin, esophagus, cervix, and the head and neck. Genomic analysis of SCCs identified genomic amplification of TP63 in up to 30% of tumors, with overexpression of its mRNA in the majority of SCCs 1, 2, 3, 4.
TP63, a p53 homolog, is a master transcriptional regulator of epithelial development and maintenance 5, 6, 7, 8, 9, 10, 11, 12. Deletion of TP63 during embryogenesis resulted in the absence of skin and limbs 5, 6. TP63 contains two different promoters to drive two distinct isoform classes either with or without N‐terminal transactivation domain, TAp63 and ΔNp63, respectively 9, 10, 11. In addition, both TAp63 and ΔNp63 have three variants with different C‐termini (α, β, and γ) generated by alternative splicing 9, 10, 11. ΔNp63α is the prominent isoform in adult epidermis 7, 13, 14, where it contributes to self‐renewal ability or stemness [5, 6, 7, 8,15, 16, 17]. Of note, pharmacological inhibition of ROCK, a differentiation‐inducible serine/threonine kinase 18, 19, resulted in induction of continuous proliferation ability with elevated ΔNp63α expression in keratinocytes 20.
In the context of cancer, the major isoform of p63 detected in SCC is also ΔNp63α 21, 22, 23, 24, 25. ΔNp63α functions as a transcriptional regulator of different gene subsets 13, 26, 27. Forced expression of ΔNp63α was sufficient to drive proliferation and tumorigenesis 24, while inducible genetic deletion of TP63 blocked chemical‐induced SCC formation 23, underscoring ΔNp63α as an oncogenic transcription factor in SCCs. Although the role of ΔNp63α has been established, the process controlling ΔNp63α nuclear transport remains poorly understood.
The nuclear pore complex (NPC) is the sole gateway between the nucleus and the cytoplasm 28, 29, 30, 31, 32, 33. NPCs consist of multiple copies of roughly 30 different proteins known as nucleoporins (NUPs). About one‐third of NUPs, including NUP62, contain unstructured phenylalanine–glycine (FG) repeats, which form a soft and flexible cobweb composed of ~200 intrinsically disordered polypeptide chains, mediating selective nucleocytoplasmic transport 34, 35. Recently, new evidence suggests that NPC composition varies among different cell types and tissues, and this heterogeneity is required for distinct biological processes such as muscle development, neurogenesis, and embryonic stem cell pluripotency 36, 37, 38, 39, 40, 41. Importantly, single NUP mutation resulted in developmental defects and diseases 42, highlighting the significant role of NUPs in maintaining tissue homeostasis. However, whether and how NUPs are involved in the biology of stratified squamous epithelia remains largely unknown.
Here, we demonstrate that the expression of NUP62, one of FG‐NUPs, is abundant in stratified epithelia. Aberrant overexpression of NUP62 is evident in human SCCs. NUP62 expression is required to maintain undifferentiated status of SCCs through regulating ΔNp63α nuclear transport. Mechanistically, pro‐differentiation ROCK kinase negatively regulates this ΔNp63α nuclear transport by limiting the interaction between ΔNp63α and NUP62 through phosphorylation of the FG regions of NUP62.
Results
Identification of NUP62 as a novel differentiation‐preventing factor in SCC
To explore the expression profile of NUPs in healthy human tissues, we re‐analyzed RNA‐seq data from The Human Protein Atlas (see Materials and Methods). The transcript levels of six NUPs (NUP107, NUP85, NUP62, NUP54, NUP188, and TPR) were higher in representative stratified epithelia, skin, and esophagus relative to other NUPs (Fig 1A). Among them, NUP62 was the only gene displaying increased expression during induction of the epidermal lineage (Fig 1B). To examine expression profile of NUP62 in skin tissue, we performed immunofluorescent confocal microscopic analysis using healthy human skin sample (Fig 1C). We found that NUP62 was expressed in the undifferentiated layer, indicating NUP62 is expressed in the progenitor population.
Figure 1. Identification of NUP62 as epidermal differentiation‐preventing factor in SCC .
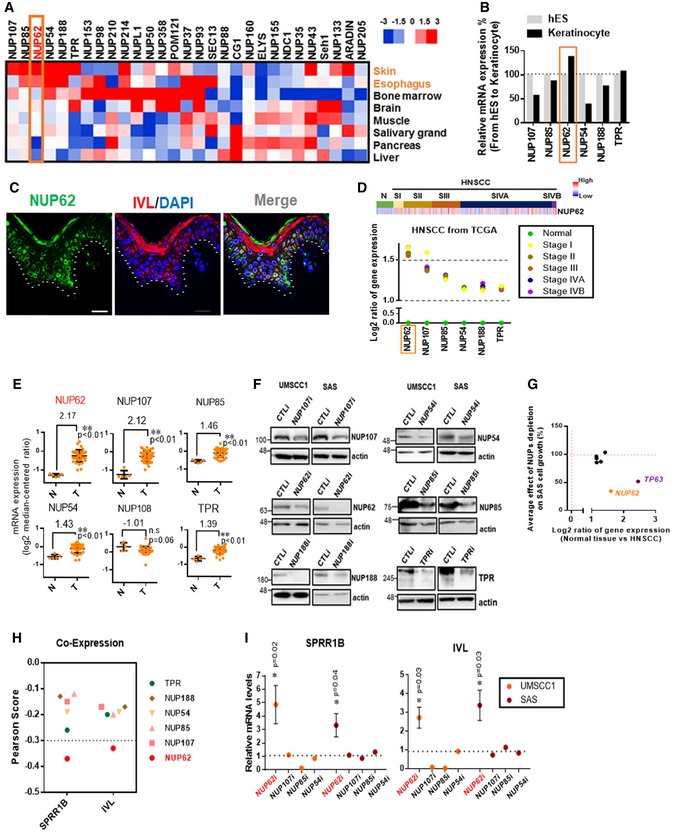
- Heat map representing NUPs transcript levels across healthy tissues including skin, esophagus, bone morrow, brain, muscle, salivary grand, pancreas and liver from The Human Protein Atlas (see URLs).
- Human H1 embryonic stem cells were differentiated to keratinocyte progenitors in vitro, and their global RNA expression profiles during differentiation were analyzed using RNA‐seq. Rectangle highlights NUP62.
- Expression profiles of NUP62 and IVL in normal skin tissue. Bar = 30 μm.
- Heat map showing the expression of NUP62 in non‐tumor tissue, and primary head and neck squamous cell carcinoma (HNSCC) samples from TCGA. SI, SII, SIII, SIV denote stages I, II, III and IV.
- NUPs expression levels in cervical squamous cell carcinoma (CSCC) samples. NUP62 mRNA levels were retrieved from GEO (accession number is shown above the figure). Five data in healthy human samples (N) and 40 data in tumor patients (T). P values are based on unpaired two‐tailed t‐test with **indicating P < 0.01. n.s. indicates not significant.
- Western blot analysis of each NUP in SCC cells at 72 h after siRNA‐mediated knockdown.
- Plot showing the correlation between average effect of NUP depletion on SAS cell growth and differential gene expression (normal tissue versus HNSCC from TCGA). NUP62 was highlighted in orange. TP63 was marked in purple as positive control for oncogene. Data show mean from two independent experiments (n = 2).
- Summary of correlation coefficient between each NUPs mRNA and epidermal differentiation genes (SPRR1B and IVL) in head and neck SCC from TCGA.
- qRT–PCR analysis of genes associated with epidermal differentiation after individual depletion of each NUPs. Transcripts of each gene with scrambled siRNAs is considered 1.0. Data show mean ± SD (n = 3; NUP62i) or mean (n = 2; others). P values are based on one sample t‐test with *indicating P < 0.05.
Source data are available online for this figure.
In order to determine the expression profile of NUPs in SCC, we compared the expression of above six NUPs mRNAs in normal versus tumor samples using data from both the RNA‐sequencing from The Cancer Genome Atlas (TCGA) and the cDNA microarray data from Gene Expression Omnibus (GEO; series GSE7410). We found that NUP62 was the top gene with consistent overexpression in primary SCC samples from both head and neck (Fig 1D) and cervix (Fig 1E).
To dissect the role of the above six NUPs in SCC growth, we individually silenced expression of each NUP (Figs 1F and EV1A), and identified that NUP62 is required for the proliferation of SCC cells (Figs 1G and EV1B). Next, we investigated whether other highly expressed NUPs in SCCs (NUP62, NUP107, NUP85, and NUP54) regulate epidermal differentiation. We queried TCGA datasets to determine co‐expression profiles among these NUPs and epidermal differentiation genes such as IVL and small proline‐rich protein 1B (SPRR1B). NUP62 was the only NUP showing an inverse correlation with both IVL and SPRR1B (Pearson Score < −0.3; Fig 1H). Moreover, NUP62 depletion activated these epidermal differentiation genes, a result not observed in any other NUPs (Fig 1I). Taken together, these data strongly suggest that NUP62 has cell type‐specific function to prevent epidermal differentiation induction in SCCs.
Figure EV1. Knockdown of NUP62 decreased proliferation of SCC cells.
-
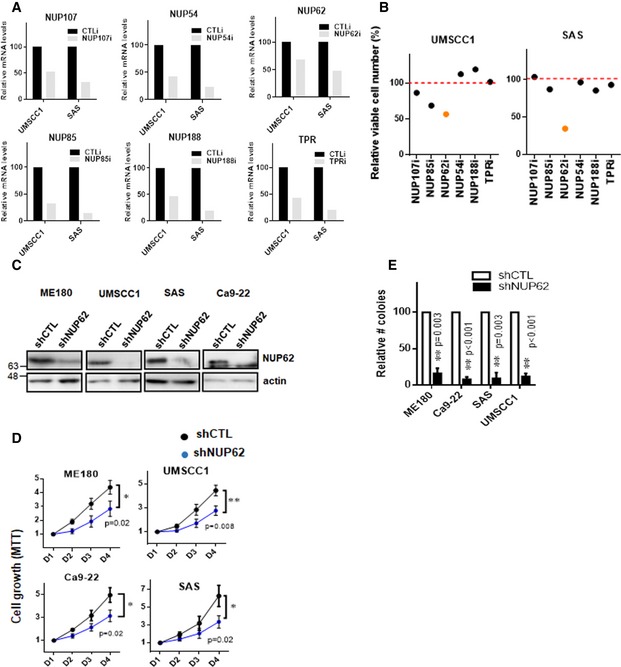
ALevels of transcripts in cells depleted of the indicated NUPs were measured by qRT–PCR. Transcript levels of each NUPs with scrambled siRNAs are considered 100%. Data show mean from two independent experiments (n = 2).
-
BRelative viable number of UMSCC1 and SAS SCC cells depleted of each NUP after siRNA treatment compared to transfection with scrambled siRNA (Control). Value of cells with scrambled siRNAs is considered 100%. Data show mean from two independent experiments (n = 2).
-
CWestern blot analysis of NUP62 in various SCC cell lines expressing shRNA NUP62.
-
D, ESCC cells expressing shRNA NUP62 were examined by MTT assay (D) and foci formation assay (E). Number of colonies from cells expressing shRNA control is considered 100%. Data show mean ± SD from three independent experiments (n = 3). P‐values are based on unpaired two‐tailed t‐test (D) or one sample t‐test (E) with *P < 0.05, **P < 0.01.
Source data are available online for this figure.
NUP62 is required for the proliferation and prevent of differentiation of SCC cells
To study the biological role of NUP62 in SCC, we silenced NUP62 in a number of cell lines from cervical SCC (CSCC) and head and neck SCC (HNSCC) by siRNA‐mediated knockdown (Fig 2A). Notably, silencing of NUP62 strongly inhibited the proliferation of various types of SCC cells (Fig 2B). Several cell lines, including ME‐180, UMSCC1, and Ca9‐22, barely grew in the absence of NUP62. Similarly, shRNA‐mediated NUP62 depletion resulted in significant reduction in short‐term cell proliferation and foci formation of SCC cells (Fig EV1C–E).
Figure 2. NUP62 is required for proliferation and undifferentiated status of SCC cells.
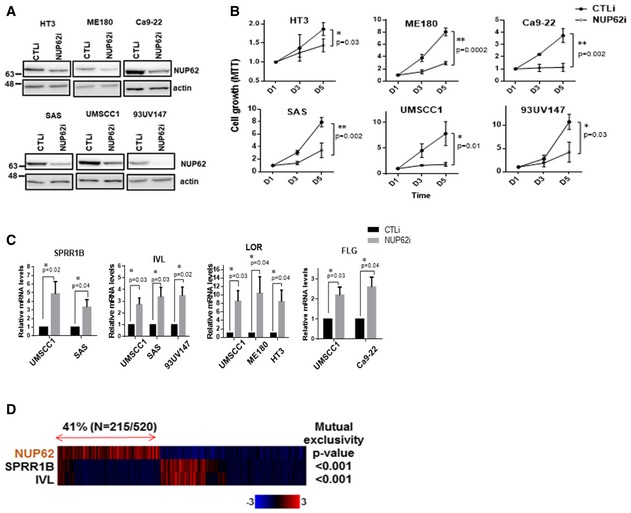
- Western blot analysis of NUP62 in SCC cells after siRNA‐mediated NUP62 depletion.
- Proliferation of NUP62‐silenced SCC cells examined by MTT assay. Data show mean ± SD from three independent experiments (n = 3). P values are based on unpaired two‐tailed t‐test with *indicating P < 0.05 and **P < 0.01.
- qRT–PCR analysis of differentiation related genes in SCC cell line treated with scrambled siRNAs (CTLi) or NUP62 siRNAs (NUP62i). Data show mean ± SD from three independent experiments (n = 3). P values are based on one sample t‐test with *indicating P < 0.05.
- Heat map showing mutual exclusivity between NUP62 expression and differentiation related genes. Samples were divided according to mRNA expression levels [mRNA expression z‐Scores (RNA‐Seq V2 RSEM) > mean + 0.1 SD] from the TCGA cohorts. P values are based on fisher exact test.
Source data are available online for this figure.
As lack of differentiation is a hallmark of SCC, we measured levels of molecular markers associated with squamous cell differentiation such as SPRR1B, IVL, filaggrin (FLG), and loricrin (LOR). Silencing NUP62 enhanced the expression of these genes (Fig 2C). Interrogation of TCGA RNA‐seq datasets showed that expression levels of these differentiation related genes are inversely related to levels of NUP62 (Fig 2D). Taken together, these data strongly suggest that NUP62 is a functional requisite for SCCs.
Transcriptome analysis of NUP62‐regulated genes and processes
To delineate the SCC‐associated functions of NUP62, cDNA microarray was performed in UMSCC1 cells comparing the silencing of the protein versus control cells. Loss of NUP62 altered the expression of 2,019 genes compared to control (twofold change, Fig 3A). Activated genes after NUP62 silence were enriched in Gene Ontology terms related to phosphorylation, regulation of localization, Rho guanine nucleotide exchange factors (GEF), negative regulation of cell proliferation, epithelial cell differentiation, and regulation of transport (Fig 3B). Interestingly, gene set enrichment analysis (GSEA) identified a strong correlation between down‐regulated genes in NUP62‐silenced cells and those in p63‐depleted SCCs (GSE88833; Fig 3C). As NUP62 depletion did not affect the level of ΔNp63α transcript per se (Fig 3D and E). We next explored alternative mechanisms underlying this molecular association.
Figure 3. Transcriptome analysis of NUP62‐regulated genes and processes.
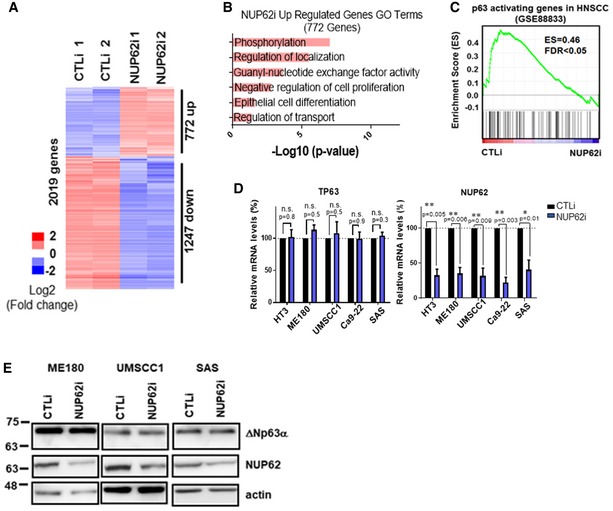
- Heat map from microarray data showing up‐ and down‐regulated genes after 3 days of knockdown of NUP62.
- GO analysis of the up‐regulated genes upon NUP62 depletion.
- GSEA of NUP62 knockdown microarray datasets with down‐regulated genes in HNSCC cell upon p63 knockdown (GSE88833).
- qRT–PCR analysis of p63 and NUP62 mRNA in various SCC cell lines depleted of NUP62. Expression levels of cells treated with scrambled siRNAs is considered 100%. Data show mean ± SD from three independent experiments (n = 3). P values are based on one sample t‐test with *indicating P < 0.05 and **P < 0.01.
- Western blot analysis of ΔNp63α in SCC cells after siRNA‐mediated NUP62 depletion.
Source data are available online for this figure.
NUP62 regulates ∆Np63α nuclear transport in SCCs
To examine whether NUP62 affects p63 localization, we quantified the amount of nuclear and cytoplasmic ∆Np63α using confocal microscopy. Attenuated nuclear ΔNp63α level was detected in NUP62‐depleted SCC cells (Fig 4A and B). Concordantly, nuclear‐cytoplasmic fractionation demonstrated that ΔNp63α abundance in the nuclear fraction was less in the NUP62 silenced SCC cells compared to the control cells (Fig 4C).
Figure 4. NUP62 regulates ΔNp63α nuclear transport in SCCs.
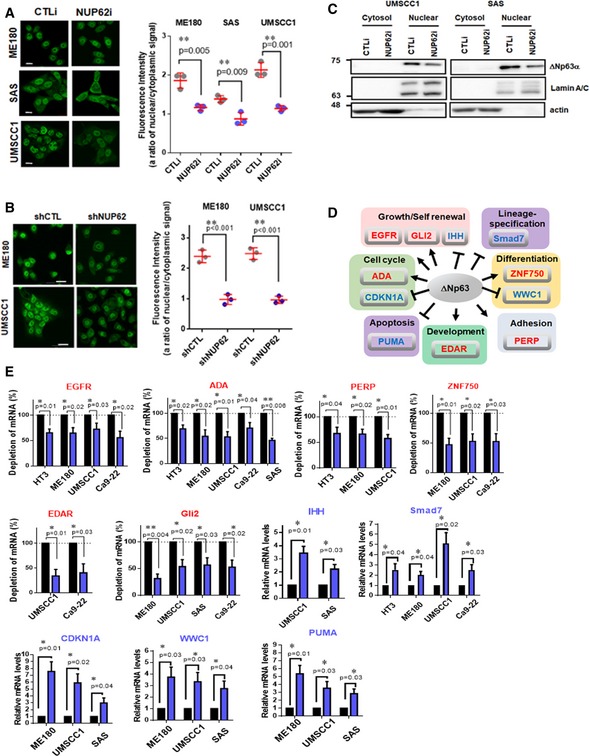
-
A, BImmunofluorescence confocal microscopic analysis of ΔNp63α in SCC cells after transient depletion of NUP62 by siRNA (72 h post transfection), (A) and shRNA (B). Representative pictures [bar: 10 μm (A) and 20 μm (B)] and the quantifications as ratio of nuclear/cytoplasm signals were presented as scatter plot with mean ± SD from three independent experiments (n = 3). P values are based on unpaired two‐tailed t‐test with *indicating P < 0.05 and **P < 0.01.
-
CWestern blot analysis of ΔNp63α protein levels in cytosol and nuclear fractions of SCC cells depleted NUP62.
-
DTranscriptional targets of ΔNp63α, grouped according to their known functions. Red; activated genes, Blue; suppressed genes.
-
EqRT–PCR analysis of ΔNp63α target genes mRNA in SCC cells depleted NUP62. Expression levels of cells treated with scrambled siRNAs is considered 100%. Data show mean ± SD from three independent experiments (n = 3). P values are based on one sample t‐test with *indicating P < 0.05 and **P < 0.01.
Source data are available online for this figure.
To investigate whether the amount of nuclear ΔNp63α affects its transcription activity, we performed qRT–PCR analysis to detect mRNA levels of ΔNp63α target genes (Fig 4D). The transcription levels of well‐defined ΔNp63α targets (EGFR 43, ADA 44, PERP 45, EDAR 46, ZNF750 47, 48, WWC1 25, PUMA 22, CDKN1A 49, IHH 50, GLI2 51, and SMAD7 52) significantly changed upon NUP62 knockdown (Fig 4E). Of note, TAp63 target genes (such as FN1 26, FAS, and SKT11 53) showed undetectable changes (Fig EV2). Collectively, these results suggest that NUP62 mediates ΔNp63α nuclear transport.
Figure EV2. Analysis of TAp63 targets gene levels in NUP62‐depleted SCC cells.
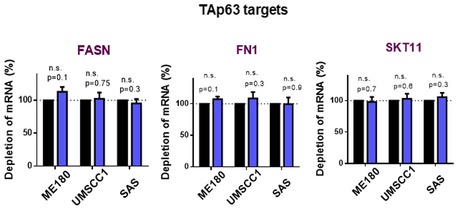
Transcript amounts of TAp63 targets were measured by qRT–PCR. Transcripts of each gene with scrambled siRNAs are considered 1.0. Data show mean ± SD from three independent experiments (n = 3). P values are based on one sample t‐test. n.s. indicates not significant.
ROCK pathway negatively regulates ΔNp63α nuclear transport in human SCCs
As previous study suggested that MAP kinase‐dependent phosphorylation of certain NUPs leads to their nuclear transport 54, we explored whether protein phosphorylation pathway was involved in NUP62‐dependent ΔNp63α nuclear transport. Notably, our pathway enrichment analysis found that focal adhesion was the top signaling pathway affected by silencing of NUP62 (Fig 5A), and GSEA confirmed that NUP62‐regulated genes were associated with a “genes controlled by ROCK” (GSE61226) signature (Fig 5B). Since ROCK pathway is downstream of the focal adhesion pathway and is regulated by rho GEF 55, we sought to determine whether ROCK activity influenced ΔNp63α nucleocytoplasmic transport. Confocal microscopy analysis showed that inhibition of ROCK pathway by Y27632 significantly increased nuclear ΔNp63α amounts (Fig 5C). Consistent with elevated ΔNp63α level in nucleus, Y27632 treatment modulated transcript amount of target genes of ΔNp63α (Fig 5D). On the other hand, ROCK activation by overexpressing a constitutive active ROCK1, Δ3‐ROCK1 56, inhibited ΔNp63α nuclear accumulation (Fig 5E and F), which was rescued by a ROCK inhibitor (Y‐27632) but not by inhibitor of CRM1, another major nuclear transporter (Fig EV3A), suggesting that ROCK pathway regulates ΔNp63α‐importing process rather than ΔNp63α‐exporting processes.
Figure 5. ROCK kinase inhibits ΔNp63α nuclear transport in SCCs.
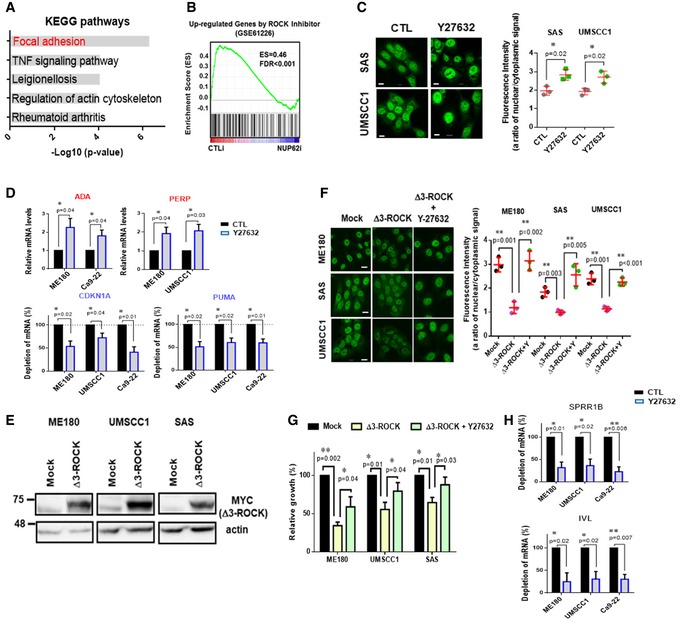
- Pathway analysis of the up‐regulated genes upon NUP62 depletion.
- GSEA after NUP62 knockdown with up‐regulated genes by ROCK inhibition microarray datasets (GSE61226).
- Immunofluorescence confocal microscopic analysis of ΔNp63α in SCC cells treated with ROCK1 inhibitor (Y27632, 10 μM, 24 h). Representative pictures (bar: 10 μm) and quantification as a ratio of nuclear/cytoplasm signals presented as a scatter plot with mean ± SD from three independent experiments (n = 3). P value are based on unpaired two‐tailed t‐test with *indicating P < 0.05.
- qRT–PCR analysis of ΔNp63α target genes mRNA in SCC cells after Y27632 treatment (24 h, 10 μM). Expression levels of cells treated with scrambled siRNAs is considered 100%. Data show mean ± SD from three independent experiments (n = 3). P values are based on one sample t‐test with *indicating P < 0.05.
- Western blot analysis of exogenous constitutively active form of ROCK1 (Δ3‐ROCK1).
- Immunofluorescence confocal microscopic analysis of ΔNp63α in SCC cells expressing Δ3‐ROCK1 and the effect of ROCK inhibitor (Y27632, 10 μM, 24 h). Representative pictures (bar: 10 μm) and quantification as a ratio of nuclear/cytoplasm signals presented as a scatter plot with mean ± SD from three independent experiments (n = 3). P values are based on unpaired two‐tailed t‐test with **indicating P < 0.01.
- Proliferation of SCC cells expressing Δ3‐ROCK1 and effect of Y27632 (10 μM, analyzed by MTT assay). Data show mean ± SD from three independent experiments (n = 3). P values are based on unpaired two‐tailed t‐test with *indicating P < 0.05. and **P < 0.01.
- qRT–PCR analysis of IVL and SPRR1B mRNA in SCC cells treated with Y27632. Expression levels of cells with DMSO is considered 100%. Data show mean ± SD from three independent experiments (n = 3). P values are based on one sample t‐test with *indicating P < 0.05 and **P < 0.01.
Source data are available online for this figure.
Figure EV3. ROCK suppresses ΔNp63α nuclear transport in SCC cells.
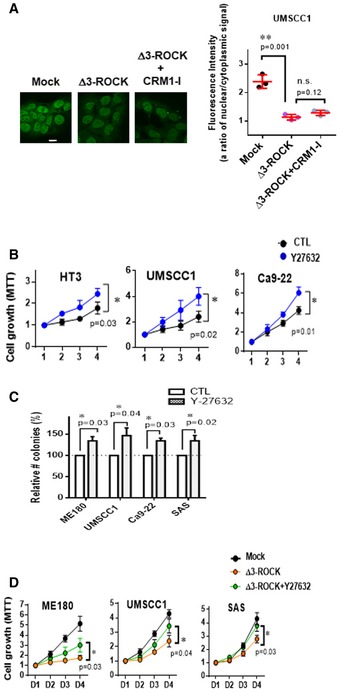
-
AImmunofluorescence confocal microscopic analysis of ΔNp63α in SCC cells expressing Δ3‐ROCK1, and the effect of CRM1 inhibitor (Leptomycin B, 10 μM, 24 h) on the cells. Representative pictures (bar: 10 μm) and quantification as a ratio of nuclear/cytoplasm signals presented as a scatter plot with mean ± SD from three independent experiments (n = 3). P values are based on unpaired two‐tailed t‐test with **indicating P < 0.01. n.s. indicates not significant.
-
B, CSCC cell lines under Y27632 treatment (10 μM) were subjected to MTT assay (B) and foci formation assay (C). Number of colonies of control cells is considered 100%. Data show mean ± SD from three independents (n = 3). P values are based on two‐tailed t‐test (B) or one sample t‐test (C) with *indicating P < 0.05.
-
DProliferation of SCC cells expressing Δ3‐ROCK1 and the effect of Y27632 (10 μM) were analyzed by MTT assay. Data show mean ± SD from three independents (n = 3). P values are based on unpaired two‐tailed t‐test with *indicating P < 0.05.
Because ΔNp63α promotes the malignant phenotypes of SCCs 16, 26, 27, we asked whether the ROCK pathway affected SCC growth potential. Blockade of ROCK activity using Y‐27632 significantly enhanced SCC growth (Fig EV3B and C), whereas Δ3‐ROCK1 expression resulted in the opposite effect (Figs 5G and EV3D). We further observed that Y27632 treatment rescued the impaired proliferation induced by Δ3‐ROCK1 (Figs 5G and EV3D). Importantly, Y27632 treatment inhibited molecular markers associated with squamous cell differentiation such as IVL and SPRR1B (Fig 5H), supporting the role of the ROCK pathway as a differentiation‐inducible serine/threonine kinase 18, 19, 20. Taken together, these results suggest that ROCK pathway compromised differentiation status of SCCs potently by limiting ΔNp63α nuclear transport.
Phosphorylation of FG domain of NUP62 mediates the interaction between ΔNp63α and NUP62
In order to elucidate ΔNp63α nuclear transport system, we first addressed whether it involves nuclear transport receptors (NTRs). Since nuclear localization signal (NLS), an amino acid sequence consisting of positively charged lysines (K) or arginines (R), tags proteins for NTR‐mediated traffic 57, we searched for nuclear localization signal (NLS) on ΔNp63α. Based on NLS mapper (http://nls-mapper.iab.keio.ac.jp/cgi-bin/NLS_Mapper_form.cgi), two potential NLSs was found in ΔNp63α (Fig 6A). To explore the biological functions of those candidate NLSs, we generated full‐length ΔNp63α (ΔNp63αWT), NLS1‐deleted ΔNp63α (ΔNp63α∆NLS1), and NLS2‐deleted ΔNp63α (ΔNp63α∆NLS2), all of which were fused with GFP at the C‐terminus (Fig 6A). Quantification by fluorescent confocal microscopy showed that the vast majority of ΔNp63αWT and ΔNp63α∆NLS2 localized in the nucleus (Fig 6B). In contrast, ~30% cells expressing ΔNp63α∆NLS1 exhibited signals in both the cytosol and nucleus (Fig 6C). Importantly, NLS1 sequence on ΔNp63 showed high similarity with validated NLS of both p53 and p73 (Fig 6D) 58, 59, 60, suggesting that ΔNp63 nuclear import is mediated through NLS1.
Figure 6. ROCK1‐dependent phosphorylation on the FG domain of NUP62 decreases the ΔNp63α–NUP62 interaction.
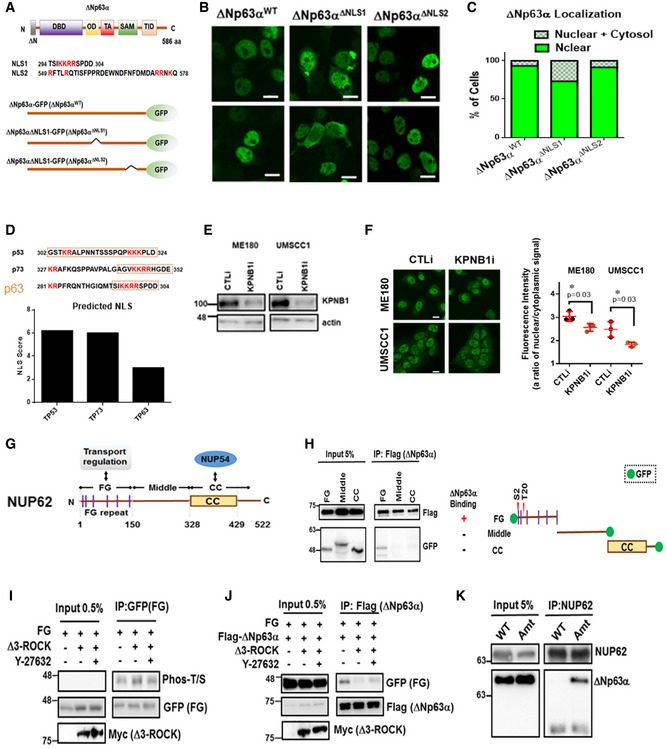
-
ASchematic representation of the structural and functional domains of ΔNp63α. DBD, DNA binding domain; OD, Oligomerization; TA, Transactivation; SAM, Steric a‐motif; TID, transactivation inhibitory domain (upper panel). Predicted NLSs in ΔNp63α by NLS mapper (middle panel). Diagram of mutations conducted in ΔNp63α (bottom panel).
-
B, CImmunofluorescence confocal microscopic analysis of ΔNp63αWT, ΔNp63α∆NLS1 and ΔNp63α∆NLS2 in 293T. Representative pictures are shown (B). Bar indicates 10 mm. Phenotypes are quantified by counting [n = 2, (C)].
-
DComparison of NLS score p53, p73 and p63.
-
EWestern blot analysis of KPNB1 in SCC cells after siRNA knockdown.
-
FImmunofluorescence confocal microscopic analysis of ΔNp63α in KPNB1 silenced SCC cells. Representative pictures (bar: 10 mm) and quantification as a ratio of nuclear/cytoplasm signals presented as scatter plot with mean ± SD from three independent experiments (n = 3). P values are based on unpaired two‐tailed t‐test with *indicating P < 0.05.
-
GSchematic representation of the structural and functional domains of NUP62. FG., FG repeat, CC., coiled‐coil domain.
-
HSchematic representation of NUP62 GFP fusion constructs overexpressed in HEK293T cells. HEK293T cells were co‐transfected with Flag‐tagged ΔNp63α and GFP‐fused NUP62 fragments (FG, Middle, and CC as shown in right panel). Seventy‐two hours after transfection, cells were harvested, lysed, followed by immunoprecipitation (IP) assay using an anti‐Flag antibody. Potential phosphorylation sites on FG is indicated.
-
I, JHEK293T cells were co‐transfected with FG, Δ3‐ROCK1 (I), together with Flag‐tagged ΔNp63α (J). Twenty‐four hours after transfection, cells were treated with Y27632 (24 h, 10 μM). At 72 h after transfection, cells were harvested, lysed, and proceeded for IP assay using indicated antibody.
-
KInteraction between ectopic NUP62 and ΔNp63α is shown either with wild‐type NUP62 (WT) or with a point mutation in the S2 and T20 of FG (Amt).
Source data are available online for this figure.
As importin β1/karyopherin β1 (KPNB1) plays a key role in NLS‐mediated nuclear traffic, we asked whether KPNB1 depletion affects ΔNp63α nuclear transport. We confirmed that KPNB1 is expressed in all cell lines tested, while ΔNp63α is specific for SCC cells (Fig EV4A). Importantly, depletion of KPNB1 significantly decreased ΔNp63α nuclear import in SCC cells, indicating that KPNB1 mediates ΔNp63α nuclear traffic (Fig 6E and F). Collectively, these results suggest that ΔNp63 nuclear transport is mediated by KPNB1‐dependent pathway.
Figure EV4. Expression profile of ΔNp63 isoforms and KPNB1 in SCC cells, and potential ROCK targeting region on FG of NUP62.
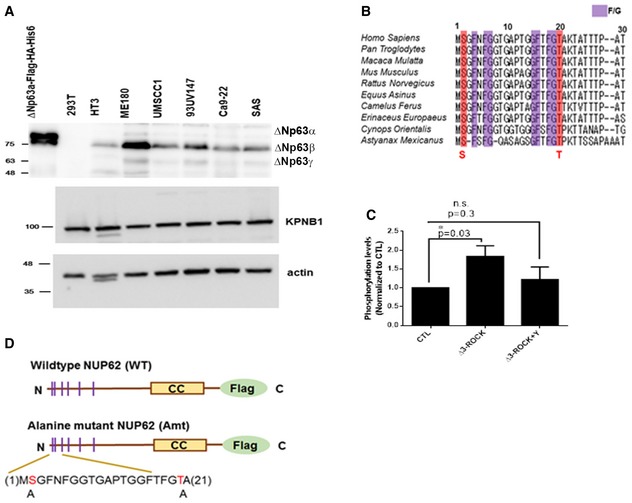
- Western blot analysis of ΔNp63α and KPNB1.
- Evolutionarily conserved phosphorylation sites in FG domain of NUP62.
- Quantification of Western blots results showing ROCK1 activation resulted in elevated phosphorylation of FG of NUP62, while Y27632 reduced this phosphorylation. The relative amount of phosphorylation was quantified by ImageJ using pull‐downed FG amounts as an internal control and normalized further to this level in control (CTL). Data show mean ± SD from three independent experiments (n = 3). P values are based on one sample t‐test with *indicating P < 0.05. n.s. indicates not significant.
- Diagram of mutations made in FG domain.
Source data are available online for this figure.
NUP62 harbors FG repeated region in N‐terminus required for nucleocytoplasmic regulating factors, and coiled‐coil (CC) domain in C‐terminus to bind with NUP54 61 (Fig 6G). To explore the basis for the functional relationship between ROCK1 pathway and NUP62‐dependent ΔNp63α nuclear transport, we constructed NUP62 fragments and performed immunoprecipitation (IP) analysis to determine p63‐interacting regions on NUP62 (Fig 6G). Of note, ΔNp63α preferably bound to the FG region (Fig 6H). Analysis of PhosphoSitePlus (see Materials and Methods) revealed that the FG domain of NUP62 includes potential phosphorylation sites, S2 and T20 (Fig 6H), which are highly conserved (Fig EV4B). Next, in order to examine whether the ROCK1 pathway phosphorylates FG domain, Δ3‐ROCK1 was co‐expressed with the FG fragment, and cell lysates were immuno‐precipitated with anti‐GFP antibodies and then immunoblotted with phosphor‐serine/threonine antibody (Fig 6I). Co‐expression of the FG domain fragment and Δ3‐ROCK resulted in a prominent enrichment of FG domain fragments having elevated phosphorylation (Figs 6I and EV4C). Importantly, this phosphorylated FG domain fragment had decreased interaction with ΔNp63α (Fig 6J). To explore further the biological relevance of the phosphorylation on FG domain of NUP62, we generated an alanine replaced mutant (Amt) NUP62 (Fig EV4D). Importantly, point mutations of the phosphorylation sites (S2A and T20A) enhanced the interaction between NUP62 and ΔNp63α (Fig 6K), suggesting the phosphorylation of FG domain of NUP62 decreased the interaction between NUP62 and ΔNp63α.
ΔNp63α nuclear transport is mediated by the phosphorylation of FG domain of NUP62
Finally, we performed confocal microscopy analysis to measure p63 nucleocytoplasmic transport in a variety of SCC cells expressing either WT or Amt NUP62 (Fig 7A) including overexpressed Δ3‐ROCK1 (Fig 7B and C). Mutant NUP62 showed increased ΔNp63α levels in the nucleus compared to WT NUP62 (Fig 7C). Of note, Δ3‐ROCK1 overexpression failed to compromise ΔNp63α nuclear importing ability of Amt NUP62, suggesting the phosphorylation of FG (S2/T20 sites) of NUP62 is crucial for ΔNp63α nuclear importation (Fig 7C). In parallel, this elevated ΔNp63α in the nucleus modulated the level of transcript of ΔNp63α target genes (Fig EV5A). Both WT and Amt NUP62 proteins co‐localized with another NPC molecule RanBP2 62, suggesting those ectopic NUP properly localized on the nuclear envelope (Fig EV5B). Concordantly, we observed increased proliferative ability of SCC cells expressing Amt NUP62 compared to WT NUP62 based on both short‐term proliferation assays and foci formation assays (Figs 7D, and EV5C and D). Taken together, our data suggest a model in which NUP62 mediates ΔNp63α nuclear transport to maintain proliferation and prevent differentiation of SCCs. ROCK pathway negatively regulates this process by limiting ΔNp63α–NUP62 interaction through the phosphorylation of the FG domain of NUP62 (Fig 7E).
Figure 7. ∆Np63α nuclear transport is mediated by the phosphorylation of FG domain of NUP62.
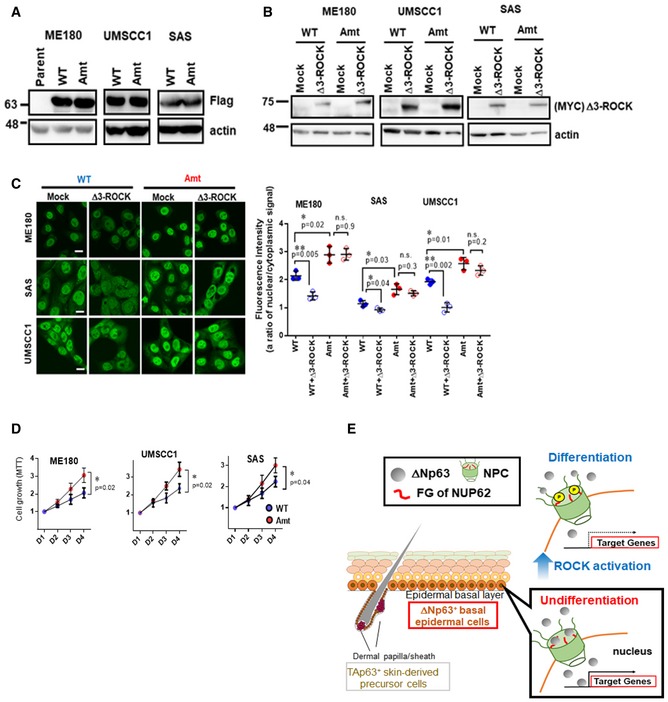
-
A, BWestern blot analysis of ectopic WT and Amt NUP62 in SCC cells (A), and exogenous Δ3‐ROCK1 in those cells (B).
-
CImmunofluorescence confocal microscopic analysis of ΔNp63α in SCC cells expressing either WT or Amt NUP62 after Δ3‐ROCK1 overexpression (72 h post transfection). Representative pictures (bar: 10 μm) and quantification as a ratio of nuclear/cytoplasm signals presented as a scatter plot with mean ± SD from three independent experiments (n = 3). P values are based on unpaired two‐tailed t‐test with *indicating P < 0.05 and **P < 0.01. n.s. indicate not significant.
-
DSCC cell lines expressing either WT or Amt NUP62 were subjected either to MTT assay. Data show mean ± SD from three independent experiments (n = 3). P‐values are based on unpaired two‐tailed t‐test with *indicating P < 0.05.
-
ECross‐section image of dermis and epidermis is modified from previous report 11. Hypothetical model of NUP62 action in regulating cell fate.
Source data are available online for this figure.
Figure EV5. ∆Np63α nuclear transport is mediated by the phosphorylation of FG domain of NUP62.
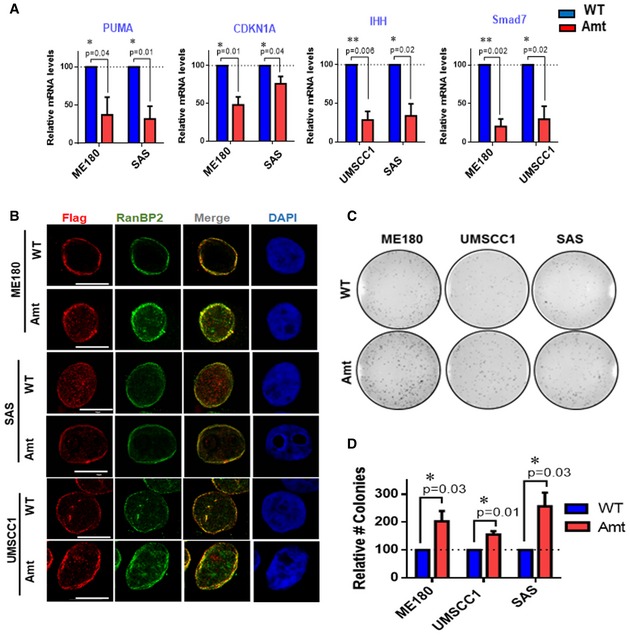
-
AqRT–PCR analysis of ΔNp63α target genes mRNA in SCC cells expressing either WT or Amt NUP62. Expression levels of cells treated with scrambled siRNAs are considered 100%. Data show mean ± SD from three independent experiments (n = 3). P values are based on one sample t‐test with *indicating P < 0.05 and **P < 0.01.
-
BCo‐localization analysis of RanBP2 and exogenous NUP62 in SCC cells by immunofluorescence confocal microscopy. Representative pictures are shown (bar: 10 μm).
-
C, DVarious SCC cell lines expressing either WT or Amt NUP62 were subjected to foci formation assay (C). Number of colonies from cells expressing WT NUP62 is considered 100% (D). Data show mean ± SD from three independent experiments (n = 3). P values are based on one sample t‐test with *indicating P < 0.05.
Discussion
In this study, we showed novel trafficking regulation by NUP62 in human SCCs. Importantly, NUP62 regulated ΔNp63α nuclear transport to prevent epidermal differentiation in SCCs. ROCK pathway inhibited the ΔNp63α nuclear transport by reducing interaction between ΔNp63α and NUP62 through the phosphorylation of the FG domain of NUP62.
Heterogeneity of NPC and the cell type‐specific properties of some pore components have been reviewed 42. Based on in silico analysis of NUPs transcripts across normal tissues, NUP62 expression levels were prominent in stratified epithelia tissues. We further determined that basal progenitor cells tend to express NUP62 in human skin tissue. In addition, SCC showed excessive levels of NUP62 compared to healthy tissues. We validated the function of NUP62 to maintain proliferative activity and suppress differentiation of SCCs, highlighting the cell type‐specific role of NUP62 to regulate the cellular state of epidermal progenitor cells. Interestingly, Toda et al 63 recently uncovered the cell type‐specific role of NUP153 in the control and maintenance of neural progenitor cells through bimodal transcriptional regulation. Present study demonstrated the role of NUP62 in SCC, however, how those NUPs cooperate in the regulation and maintenance of cell identity in different tissues and other types of cancer cells will be of interest.
We found that NUP62 regulated ΔNp63α nuclear transport to maintain cellular undifferentiated status of SCCs. Importantly, p63 can be overexpressed including by genomic amplification, and the expression level of ΔNp63α is a crucial clinical–pathological parameter affecting malignant potential of primary SCCs 1, 2, 3, 4. Furthermore, previous studies demonstrated the mechanistic action of ΔNp63α in SCC 10, 11. For example, ΔNp63α inhibits the activity of TAp73 64 via transcriptional inhibition and, to a lesser extent, direct interaction between both proteins 65. Therefore, attenuation of ΔNp63α nuclear transport can serve as a new strategy to compromise its functions.
Nuclear transport receptors including KPNB1 are suggested to aid the shuttle of macromolecules larger than ~40 kDa. These NTRs bind to FG‐NUPs, allowing the transport factors to cross NPC 66. Here, we identified a candidate functional NLS (containing KKRR) on ΔNp63α, which shows similarity with validated NLS on both p53 and p73 58, 59, 60. Previous studies demonstrated that destruction of KKRR on p53 and p73 almost completely blocked their nuclear accumulation 58, 59, 60. In contrast, the effect of mutation of KKRR of ΔNp63α was moderate in nuclear blockage. ΔNp63α forms hetero‐tetramers among p53 family members 10, 11 and makes subcomplexes with cofactors such as p300 67, which determine specificity and selectivity of downstream targets of ΔNp63. Therefore, NLS on interacting proteins may represent ΔNp63α nuclear traffic to some extent. Identification of the p53 family protein complexes will enhance our understanding of the ΔNp63α nuclear traffic system as well as selectivity of downstream targets of ΔNp63α.
In addition, this study showed that the interaction between ΔNp63α and FG domain of NUP62 is required for ΔNp63α to enter the nuclear space in SCCs. Importantly, ROCK1‐dependent phosphorylation on FG domain resulted in attenuated interaction with ΔNp63α as well as the nuclear transport ability. The ROCK1‐specific inhibitor Y27632 was demonstrated to transform epithelial cells into continuously proliferating cells by increasing progenitor cell factors such as ΔNp63α 20, suggesting that the ROCK pathway inhibits the self‐renewal ability by suppressing ΔNp63α expression. Previously, Kosako et al reported that ERK phosphorylation of the repeat region of FG of Nup50 reduced its affinity for particular NTRs, resulting in impaired nuclear migration of the NTRs 47. Taken together, these findings suggest that transport ability and selectivity of NPC are controlled by kinase‐dependent phosphorylation on the FG domain of FG‐NUPs.
In summary, we show that high expression of NUP62 contributes to preventing epidermal differentiation of SCCs originating from stratified epithelia. Mechanistic studies reveal that NUP62 maintains ΔNp63α entering NPC, whereas ROCK negatively regulates this process. Our results highlight cell type‐specific role of NUP62 controlling systematically ΔNp63α nuclear transport in SCCs. Our finding of convertible trafficking activity of NUP62 highlights the potential for therapeutic targeting of nuclear transport of this oncogene.
Materials and Methods
Cell culture
HEK293T, cervical SCC cell lines (HT3 and ME180), and head and neck SCC cell lines (UMSCC1, 93UV147, Ca9‐22, and SAS) were maintained in Dulbecco's Modified Eagle Medium (DMEM) supplemented with 10% (vol/vol) fetal bovine serum (FBS) and 1% (vol/vol) penicillin/streptomycin (P/S) at 37°C, 5% CO2 in a humidified atmosphere. Cell lines were authenticated by short tandem repeat analysis with the Geneprint 10 System Kit (Promega, B9510) in 2014.
Cell proliferation assay
Cells were seeded into a 96‐well plate at 3,000 cells/well and cultured for the indicated time courses. Cell viability was assessed using the MTT (3‐(4, 5‐dimethylthiazol‐2‐yl)‐2, 5‐diphenyltetrazolium bromide) method. In brief, 10 μl of 12 mM MTT solution was added into each well followed by 3‐h incubation, which was stopped by adding 100 μl of STOP solution (2% acetic acid, 16% SDS, 42% DMF). Samples were mixed thoroughly and measured at 570 nm for absorbance.
Foci formation assay
Squamous cell carcinoma cells were seeded into 6‐well plates at 1,000 cells/well and cultured for 10 days, followed by fixation, staining with crystal violet and photographing the cells using LAS4000 (Fujifilm, Aichi, Japan). For quantification, the number of colonies (> 0.1 mm2) was determined using Multi Gauge Ver3.0 (Fujifilm).
Western blotting
Cells were lysed with lysis buffer [20 mM HEPES (pH 7.4), 350 mM sodium chloride, 1.5 mM magnesium chloride, 1 mM EGTA, 10% (v/v) glycerol, 1% Triton X‐100, a mixture of protease inhibitors (Roche), 0.2 mM sodium orthovanadate, and 1 mM phenylmethylsulfonyl fluoride]. Cell lysates or immunoprecipitation elutes were subjected to SDS–PAGE followed by conventional wet transfer. Membranes were incubated with antibodies and exposed to secondary horseradish peroxidase‐conjugated antibodies (Millipore). Images were detected by using an LAS‐4000 image analyzer (Fujifilm). Antibodies used in this study were listed in Table 1.
Table 1.
Antibodies
| Company | Catalog # | |
|---|---|---|
| Antibody | ||
| β‐actin | Santa Cruz Biotechnology | sc‐47778 |
| NUP107 | Sigma‐Aldrich | SAB3500333 |
| NUP62 | Sigma‐Aldrich | N1163 |
| NUP188 | Abcam | ab86601 |
| NUP54 | Sigma‐Aldrich | SAB1300588 |
| TPR | Santa Cruz Biotechnology | sc‐101294 |
| p63(∆N) | Biolegend | 619001 |
| RanBP2 | Santa Cruz Biotechnology | sc‐74518 |
| KPNB1 | Abcam | ab2811 |
| GFP | Wako | 012‐20461 |
| GFP | Thermo Fisher Scientific | A6455 |
| Flag | Sigma‐Aldrich | F1804 |
| Flag | MBL | PM020 |
| Lamin A/C | Cell Signaling Technology | #2032 |
| Fluorescent secondary antibody | ||
| Goat anti‐Rabbit IgG (H+L), Alexa Fluor 488 | Thermo Fisher Scientific | A11034 |
| Goat anti‐Mouse IgG (H+L), Alexa Fluor 488 | Thermo Fisher Scientific | A11029 |
| Goat anti‐Rabbit IgG (H+L), Rhodamine Red‐X | Thermo Fisher Scientific | R6394 |
| HRP‐linked antibody | ||
| anti‐Mouse IgG | Cell Signaling Technology | 7076S |
| anti‐Rabbit IgG | Cell Signaling Technology | 7074S |
| Protein A | GE Healthcare | N9120 |
Immunoprecipitation
HEK293T cells were transiently transfected with the indicated mammalian expression plasmids and harvested 72 h after transfection. In the case of Y27632 treatment, transfected cells were incubated for 24 h before harvest. Indicated antibody was added and incubated overnight with each cell lysate at 4°C. Dynabeads Protein A/G (VERITUS, Tokyo, Japan) were added after washing for three times with lysis buffer. After 2‐h incubation, beads were washed four times in IP buffer (50 mM Tris, pH 7.6, 100 mM NaCl, 2 mM EDTA, 0.2% Nonidet P‐40).
Tissue slide and immunofluorescent analysis
Human skin tissue sections (Kin08N004A5) were obtained from US Biomax Inc. The slides were deparaffinized and blocked with goat serum for 30 min at room temperature, followed by incubation with mouse anti‐NUP62 (1:50; sc‐48373, Santa Cruz) and rabbit anti‐IVL (1:100; SAB4501594, Sigma) overnight at 4°C. After three washes, slides were incubated with Alexa 488‐ and Alexa 568‐linked secondary antibody (Life Technologies) for 60 min. After three washes, Pro‐Long Gold Antifade reagent (Life Technologies) was mounted onto samples and was examined by confocal microscopy (FluoView® FV10i, Olympus, objective ×60/1.2).
Microscopic analysis using SCC cells
Cells on coverslips were incubated under indicated conditions. Cells were fixed for 10 min in 4% paraformaldehyde in PBS, then permeabilized with 0.3% Triton X‐100 in PBS for 3 min at room temperature. Coverslips were incubated with indicated primary antibody for 2 h. Coverslips were washed three times and incubated with Alexa Fluor‐conjugated secondary antibody (Life Technologies) for 1 h. After three washes, samples were mounted onto coverslips using Pro‐Long Gold Antifade reagent (Life Technologies) and were examined by confocal microscopy (FluoView® FV10i, Olympus, objective ×60/1.2). Nuclear ΔNp63α signals were quantified with FV10i (Olympus).
cDNA vectors and siRNAs
The NUP62 fragment vectors have been described previously 68. Constructs for overexpressing NUP62 were made by cloning cDNA derived from HaCaT into pLEX (Open Biosystems) using NotI/AgeI with C‐terminal FLAG tag with the following primers: NUP62‐F:5′‐ACAGTGGCGGCCGCGCCACCATGAGCGGGTTTAAT‐3′; NUP62‐R: 5′‐GGCGACCGGTTTACTTGTCGTCATCGTCTTTGTAGTCGTCGTCAAAGGTGATCCG‐3′. NUP62 CDS harboring mutations (S2A, T20A) was generated with the following primers: S2A‐F1: 5′‐ACAGTGGCGGCCGCGCCACCATGGCCGGGTTTAAT‐3′; T20A‐R: 5′‐CTTTGCAGCGCCAAAC‐3′; T20A‐F: 5′‐GTTTGGCGCTGCAAAG‐3′; Mt3end‐R: 5′‐GGCGACCGGTTTACT. Two fragments were generated by PCR with S2A‐F/T20A‐R and T20A‐F/Mt3end‐R. After purification, these fragments were mixed and subjected to PCR using S2A‐F/Mt3end‐R. Constructs for overexpressing MYC‐tag‐fused Δ3‐ROCK1 were made by cloning cDNA derived from HaCaT into pLEX (Open Biosystems) using XhoI/AgeI sites. CDS‐Seq was reported previously (National Center for Biotechnology Information (NCBI), see URL). The siRNAs targeting human nucleoporins are listed in Table 2, and scramble siRNA (D‐001210‐01) was purchased from Thermo Scientific.
Table 2.
siRNAs oligonucleotides
| siRNA | Company | Catalog # |
|---|---|---|
| Control | Sigma‐Aldrich | SIC001 |
| NUP107 | Santa Cruz Biotechnology | sc‐45343 |
| NUP85 | Life Technologies | 4392420 |
| NUP62 | Sigma‐Aldrich | SASI_Hs01_00038069 |
| NUP54 | Santa Cruz Biotechnology | sc‐89240 |
| NUP188 | Santa Cruz Biotechnology | sc‐92946 |
| KPNB1 | Sigma‐Aldrich | SASI_Hs01_00101673 |
| TPR | Santa Cruz Biotechnology | sc‐45343 |
Transfections, viral particle production, and infection
DNA and siRNA transfections were performed using Lipofectamine 2000 and Lipofectamine RNAiMAX (Life Technologies), respectively. Lentiviral particles were produced with the MISSION Lentiviral Packaging System (Sigma‐Aldrich). SCCs cells were transduced with the lentiviral particles in the presence of 8 μg/ml polybrene (Sigma‐Aldrich) for 48 h.
cDNA preparation and quantitative Real‐time RT–PCR assay
We used 500 ng RNA for cDNA preparation using ReverTra Ace® qPCR RT Master Mix (TOYOBO). Quantitative real‐time RT–PCR was performed by SYBR® Premix Ex Taq™ II (Takara) in a Thermal Cycler Dice® Real Time System (Takara) according to the manufacturer's instructions. The relative mRNA expression level of target genes was calculated using GAPDH as a loading control. The primers are listed in Table 3.
Table 3.
Primers
| Sequence (5′–3′) | |
|---|---|
| GAPDH‐F | GTCAGTGGTGGACCTGACCT |
| GAPDH‐R | AGGGGTCTACATGGCAACTG |
| EGFR‐F | TAACAAGCTCACGCAGTTGG |
| EGFR‐R | GTTGAGGGCAATGAGGACAT |
| ADA‐F | GACCCGCTCATCTTCAAGTC |
| ADA‐R | GGTCGAGAAGCTCCCTCTTT |
| PERP‐F | CATGCTCTTCTGTGGCTTCA |
| PERP‐R | AAAGCCGTAGGCCCAGTTAT |
| EDAR‐F | GTATGCCAACGTGTGTGGAG |
| EDAR‐R | CCCAATCTCATCCCTCTTCA |
| ZNF750‐F | TAAGCCTCAATGTTGTGAAC |
| ZNF750‐R | CTGATTTCTTGGAGAGGTTG |
| WWC1‐F | CGCTGACGGAGAGGTTAAAG |
| WWC1‐R | GCTGAAGTGGAGGAGTCCAG |
| PUMA‐F | GACGACCTCAACGCACAGTA |
| PUMA‐R | CACCTAATTGGGCTCCATCT |
| CDKN1A‐F | GACACCACTGGAGGGTGACT |
| CDKN1A‐R | CTGCCTCCTCCCAACTCAT |
| SPRR1B‐F | TATTCCTCTCTTCACACCAG |
| SPRR1B‐R | TCCTTGGTTTTGGGGATG |
| IVL‐F | TTACTGTGAGTCTGGTTGAC |
| IVL‐R | TGTTTCATTTGCTCCTGATG |
| NUP62‐F | ACATCGATGCACAGCTCAAG |
| NUP62‐R | ACTGCAGTGAGTCCATGTGC |
| TP63‐F | ACCTGGAAAACAATGCCCAGA |
| TP63‐R | ACGAGGAGCCGTTCTGAATC |
| LOR‐F | GAGTAGCCGCAGCCAGAAC |
| LOR‐R | CTCCTCACTCACCCTTCCTG |
| FLG‐F | AATTTCGGCAAATCCTGAAG |
| FLG‐R | CTTGAGCCAACTTGAATACC |
| Gli2‐F | CAGCTGCGCAAACACATGA |
| Gli2‐R | TTGAGTGACTTGAGCTTCTCCTTCT |
| IHH‐F | CGGCTTTGACTGGGTGTATT |
| IHH‐R | GAAAATGAGCACATCGCTGA |
| Smad7‐F | GTGGATGGTGTGTGGGTGTA |
| Smad7‐R | CAAAGCTGATCTGCACGGTA |
| FASN‐F | CTGGCTCAGCACCTCTATCC |
| FASN‐R | CAGGTTGTCCCTGTGATCCT |
| SKT11‐F | GCTCTTACGGCAAGGTGAAG |
| SKT11‐R | TTTTGTGCCGTAACCTCCTC |
| FN1‐F | ACCAACCTACGGATGACTCG |
| FN1‐R | GCTCATCATCTGGCCATTTT |
Microscopic analysis
Cells on coverslips were overexpressed Δ3‐ROCK1 and then further incubated with either Y27632 or the CRM1 inhibitor for 24 h. For ΔNp63 staining, cells were fixed for 10 min in 4% paraformaldehyde in PBS, then permeabilized with 0.2% Triton X‐100 in PBS for 20 min at room temperature. Permeabilization was proceeded before fixation in RanBP2/Flag dual staining 68. Coverslips were incubated with indicated primary antibody for 2 h. Coverslips were washed three times and incubated with Alexa Fluor‐conjugated secondary antibody (Life Technologies) for 1 h. After three washes, samples were mounted onto coverslips using Pro‐Long Gold Antifade reagent (Life Technologies) and examined using confocal microscope (FluoView® FV10i, Olympus, objective ×60/1.2). Nuclear p63 signals were quantified with FV10i (Olympus).
DNA microarray analysis
Cyanine‐3 (Cy3)‐labeled cRNA was prepared from 0.2 μg RNA using the Low Input Quick Amp Labeling Kit (Agilent Technologies) according to the manufacturer's instructions, followed by RNeasy column purification (QIAGEN, Valencia, CA). Samples were hybridized to Whole Human Genome microarray 4 × 44 K Ver. 2.0 (G4845A, Agilent Technologies). The slides were scanned on the Agilent DNA Microarray Scanner (G2539A) using one color scan setting for 4 × 44 k array slides. The scanned images were analyzed with Feature Extraction Software 11.0.1.1 (Agilent) using default parameters (protocol AgilentHD_GX_1Color and Grid: 026652_D_F_20120130) to obtain background subtracted and spatially detrended Processed Signal intensities. The raw data have been deposited in the Gene Expression Omnibus (GEO) database, under number GSE103991.
Bioinformatics and data analysis
NUP62 mRNA expression across normal tissues was examined from The Human Protein Atlas (see URLs). The expression of NUP62, NUP107, NUP85, NUP54, NUP188, TPR, SPRR1B, and IVL mRNA in HNSCC was from The Cancer Genome Atlas (TCGA) through Cancer RNA‐Seq Nexus or cBioportal (see URLs). NUP62 protein expression levels in stratified epithelia tissues were from Human Protein Atlas (see URLs). Gene Ontology (GO) analysis and pathway were performed via ConsensusPathDB (see URLs). Gene Set Enrichment Analysis (GSEA) was performed with GSEA v2.2.2 software (see URLs). Phosphorylated sites in NUP62 were from PhosphoSitePlus (see URLs).
Statistical analyses
Following assays: cell proliferation assay, anchorage‐dependent colony formation assay, and real‐time RT–PCR analysis were performed in triplicates (n = 3) and independently replicated 2–4 times. Data are the average of independent experiments (n = 2 or 3). Unpaired two‐tailed t‐test was performed by GraphPad Prism in the statistical analysis of the following assays: cell proliferation assay, anchorage‐dependent colony formation assay, and real‐time RT–PCR analysis. P < 0.05 was considered statistically significant. When control group is considered as 100%, one sample t‐test was performed using GraphPad QuickCalcs (see URLs).
URLs
The Cancer Genome Atlas (TCGA), http://cancergenome.nih.gov/; cBio Cancer Genomics Portal, http://www.cbioportal.org/; Human Protein Atlas, http://www.proteinatlas.org/; Gene Expression Omnibus (GEO), http://syslab4.nchu.edu.tw/; Cancer RNA‐Seq Nexus, http://portals.broadinstitute.org/ccle/; Gene Set Enrichment Analysis (GSEA), http://software.broadinstitute.org/gsea; ConsensusPathDB, http://consensuspathdb.org/; PhosphoSitePlus, http://www.phosphosite.org/homeAction.action. GraphPad QuickCalcs, http://graphpad.com/quickcalcs/OneSampleT1.cfm; NCBI, https://www.ncbi.nlm.nih.gov/.
Author contributions
MH and RWW initiated the research; MH, D‐CL, and RWW developed methodology; MH, AK, Y‐YJ, LX, FRPD, MSM, and H performed experiments and collected data; S‐iH performed micro‐array analysis; MM‐H performed tissue‐immunofluorescence analysis; MH, D‐CL, MN, HPK, and RWW analyzed and interpreted data; MH, D‐CL, HPK, and RWW wrote, reviewed, and revised the manuscripts with input from all authors; MH and RWW supervised the study.
Conflict of interest
The authors declare that they have no conflict of interest.
Supporting information
Expanded View Figures PDF
Source Data for Expanded View
Review Process File
Source Data for Figure 1
Source Data for Figure 2
Source Data for Figure 3
Source Data for Figure 4
Source Data for Figure 5
Source Data for Figure 6
Source Data for Figure 7
Acknowledgements
We thank Takayuki Dowaki, Kie Sakai, and Ryota Tsukahara for technical support. This work was funded by an Infiniti Grant and in part by Grants‐in‐Aid for scientific research (JSPS KAKENHI Grant Number 17K16332) and (JSPS KAKENHI Grant Number 80292423) from the Japan Society for Promotion of Science. This research was supported by the grant provided by The Ichiro Kanehara Foundation. This work was also supported by World Premier International Research Center Initiative (WPI), MEXT, Japan.
See also: J Borlido & MA D'Angelo (January 2018)
Contributor Information
Masaharu Hazawa, Email: masaharu.akj@gmail.com.
Richard W Wong, Email: rwong@staff.kanazawa-u.ac.jp.
References
- 1. Cancer Genome Atlas Network (2015) Comprehensive genomic characterization of head and neck squamous cell carcinomas. Nature 517: 576–582 [DOI] [PMC free article] [PubMed] [Google Scholar]
- 2. Lin DC, Hao JJ, Nagata Y, Xu L, Shang L, Meng X, Sato Y, Okuno Y, Varela AM, Ding LW et al (2014) Genomic and molecular characterization of esophageal squamous cell carcinoma. Nat Genet 46: 467–473 [DOI] [PMC free article] [PubMed] [Google Scholar]
- 3. Lee CS, Bhaduri A, Mah A, Johnson WL, Ungewickell A, Aros CJ, Nguyen CB, Rios EJ, Siprashvili Z, Straight A et al (2014) Recurrent point mutations in the kinetochore gene KNSTRN in cutaneous squamous cell carcinoma. Nat Genet 46: 1060–1062 [DOI] [PMC free article] [PubMed] [Google Scholar]
- 4. Cancer Genome Atlas Research Network, Analysis Working Group: Asan University, BC Cancer Agency, Brigham and Women's Hospital, Broad Institute, Brown University, Case Western Reserve University, Dana‐Farber Cancer Institute, Duke University, Greater Poland Cancer Centre et al (2017) Integrated genomic characterization of oesophageal carcinoma. Nature 541: 169–175 [DOI] [PMC free article] [PubMed] [Google Scholar]
- 5. Mills AA, Zheng B, Wang XJ, Vogel H, Roop DR, Bradley A (1999) p63 is a p53 homologue required for limb and epidermal morphogenesis. Nature 398: 708–713 [DOI] [PubMed] [Google Scholar]
- 6. Yang A, Schweitzer R, Sun D, Kaghad M, Walker N, Bronson RT, Tabin C, Sharpe A, Caput D, Crum C et al (1999) p63 is essential for regenerative proliferation in limb, craniofacial and epithelial development. Nature 398: 714–718 [DOI] [PubMed] [Google Scholar]
- 7. Keyes WM, Wu Y, Vogel H, Guo X, Lowe SW, Mills AA (2005) p63 deficiency activates a program of cellular senescence and leads to accelerated aging. Genes Dev 19: 1986–1999 [DOI] [PMC free article] [PubMed] [Google Scholar]
- 8. Senoo M, Pint F, Crum CP, Mckeon F (2007) p63 is essential for the proliferative potential of stem cells in stratified epithelia. Cell 129: 523–536 [DOI] [PubMed] [Google Scholar]
- 9. Yang A, McKeon F (2000) P63 and P73: P53 mimics, menaces and more. Nat Rev Mol Cell Biol 1: 199–207 [DOI] [PubMed] [Google Scholar]
- 10. Su X, Chakravarti D, Flores ER (2013) p63 steps into the limelight: crucial roles in the suppression of tumorigenesis and metastasis. Nat Rev Cancer 13: 136–143 [DOI] [PMC free article] [PubMed] [Google Scholar]
- 11. Botchkarev VA, Flores ER (2014) p53/p63/p73 in the epidermis in health and disease. Cold Spring Harb Perspect Med 4: pii: a015248 [DOI] [PMC free article] [PubMed] [Google Scholar]
- 12. Melino G, Memmi EM, Pelicci PG, Bernassola F (2015) Maintaining epithelial stemness with p63. Sci Signal 8: re9 [DOI] [PubMed] [Google Scholar]
- 13. Yang A, Kaghad M, Wang Y, Gillett E, Fleming MD, Dötsch V, Andrews NC, Caput D, McKeon F (1998) p63 is the molecular switch for initiation of an epithelial stratification program. Mol Cell 2: 305–316 [DOI] [PubMed] [Google Scholar]
- 14. Kouwenhoven EN, Oti M, Niehues H, van Heeringen SJ, Schalkwijk J, Stunnenberg HG, van Bokhoven H, Zhou H (2015) Transcription factor p63 bookmarks and regulates dynamic enhancers during epidermal differentiation. EMBO Rep 16: 863–878 [DOI] [PMC free article] [PubMed] [Google Scholar]
- 15. Pellegrini G, Dellambra E, Golisano O, Martinelli E, Fantozzi I, Bondanza S, Ponzin D, McKeon F, De Luca M (2001) p63 identifies keratinocyte stem cells. Proc Natl Acad Sci USA 98: 3156–3161 [DOI] [PMC free article] [PubMed] [Google Scholar]
- 16. Leonard MK, Kommagani R, Payal V, Mayo LD, Shamma HN, Kadakia MP (2011) ∆Np63α regulates keratinocyte proliferation by controlling PTEN expression and localization. Cell Death Differ 18: 1924–1933 [DOI] [PMC free article] [PubMed] [Google Scholar]
- 17. Rossi M, Aqeilan RI, Neale M, Candi E, Salomoni P, Knight RA, Croce CM, Melino G (2006) The E3 ubiquitin ligase Itch controls the protein stability of p63. Proc Natl Acad Sci USA 103: 12753–12758 [DOI] [PMC free article] [PubMed] [Google Scholar]
- 18. Yugawa T, Nishino K, Ohno S, Nakahara T, Fujita M, Goshima N, Umezawa A, Kiyono T (2013) Noncanonical NOTCH signaling limits self‐renewal of human epithelial and induced pluripotent stem cells through ROCK activation. Mol Cell Biol 33: 4434–4447 [DOI] [PMC free article] [PubMed] [Google Scholar]
- 19. McMullan R, Lax S, Robertson VH, Radford DJ, Broad S, Watt FM, Rowles A, Croft DR, Olson MF, Hotchin NA (2003) Keratinocyte differentiation is regulated by the Rho and ROCK signaling pathway. Curr Biol 13: 2185–2189 [DOI] [PubMed] [Google Scholar]
- 20. Suprynowicz FA, Upadhyay G, Krawczyk E, Kramer SC, Hebert JD, Liu X, Yuan H, Cheluvaraju C, Clapp PW, Boucher RC Jr et al (2012) Conditionally reprogrammed cells represent a stem‐like state of adult epithelial cells. Proc Natl Acad Sci USA 109: 20035–20040 [DOI] [PMC free article] [PubMed] [Google Scholar]
- 21. Yugawa T, Narisawa‐Saito M, Yoshimatsu Y, Haga K, Ohno S, Egawa N, Fujita M, Kiyono T (2010) DeltaNp63alpha repression of the Notch1 gene supports the proliferative capacity of normal human keratinocytes and cervical cancer cells. Cancer Res 70: 4034–4044 [DOI] [PubMed] [Google Scholar]
- 22. Ramsey MR, He L, Forster N, Ory B, Ellisen LW (2011) Physical association of HDAC1 and HDAC2 with p63 mediates transcriptional repression and tumor maintenance in squamous cell carcinoma. Cancer Res 71: 4373–4379 [DOI] [PMC free article] [PubMed] [Google Scholar]
- 23. Keyes WM, Pecoraro M, Aranda V, Vernersson‐Lindahl E, Li W, Vogel H, Guo X, Garcia EL, Michurina TV, Enikolopov G et al (2011) ∆Np63α is an oncogene that targets chromatin remodeler Lsh to drive skin stem cell proliferation and tumorigenesis. Cell Stem Cell 8: 164–176 [DOI] [PMC free article] [PubMed] [Google Scholar]
- 24. Ramsey MR, Wilson C, Ory B, Rothenberg SM, Faquin W, Mills AA, Ellisen LW (2013) FGFR2 signaling underlies p63 oncogenic function in squamous cell carcinoma. J Clin Invest 123: 3525–3538 [DOI] [PMC free article] [PubMed] [Google Scholar]
- 25. Saladi SV, Ross K, Karaayvaz M, Tata PR, Mou H, Rajagopal J, Ramaswamy S, Ellisen LW (2017) ACTL6A is co‐amplified with p63 in squamous cell carcinoma to drive YAP activation, regenerative proliferation, and poor prognosis. Cancer Cell 31: 35–49 [DOI] [PMC free article] [PubMed] [Google Scholar]
- 26. Carroll DK, Carroll JS, Leong CO, Cheng F, Brown M, Mills AA, Brugge JS, Ellisen LW et al (2006) p63 regulates an adhesion programme and cell survival in epithelial cells. Nat Cell Biol 8: 551–561 [DOI] [PubMed] [Google Scholar]
- 27. Tordella L, Koch S, Salter V, Pagotto A, Doondeea JB, Feller SM, Ratnayaka I, Zhong S, Goldin RD, Lozano G et al (2013) ASPP2 suppresses squamous cell carcinoma via RelA/p65‐mediated repression of p63. Proc Natl Acad Sci USA 110: 17969–17974 [DOI] [PMC free article] [PubMed] [Google Scholar]
- 28. Funasaka T, Wong RW (2011) The role of nuclear pore complex in tumor microenvironment and metastasis. Cancer Metastasis Rev 30: 239–251 [DOI] [PubMed] [Google Scholar]
- 29. Simon DN, Rout MP (2014) Cancer and the nuclear pore complex. Adv Exp Med Biol 773: 285–307 [DOI] [PubMed] [Google Scholar]
- 30. Wong RW (2015) Nuclear pore complex: from structural view to chemical tools. Chem Biol 22: 1285–1287 [DOI] [PubMed] [Google Scholar]
- 31. Ibarra A, Hetzer MW (2015) Nuclear pore proteins and the control of genome functions. Genes Dev 29: 337–349 [DOI] [PMC free article] [PubMed] [Google Scholar]
- 32. Hoelz A, Glavy JS, Beck M (2016) Toward the atomic structure of the nuclear pore complex: when top down meets bottom up. Nat Struct Mol Biol 23: 624–630 [DOI] [PMC free article] [PubMed] [Google Scholar]
- 33. Sakuma S, D'Angelo MA (2017) The roles of the nuclear pore complex in cellular dysfunction, aging and disease. Semin Cell Dev Biol 68: 72–84 [DOI] [PMC free article] [PubMed] [Google Scholar]
- 34. Terry LJ, Wente SR (2009) Flexible gates: dynamic topologies and functions for FG nucleoporins in nucleocytoplasmic transport. Eukaryot Cell 8: 1814–1827 [DOI] [PMC free article] [PubMed] [Google Scholar]
- 35. Mohamed MS, Kobayashi A, Taoka A, Watanabe‐Nakayama T, Kikuchi Y, Hazawa M, Minamoto T, Fukumori Y, Kodera N, Uchihashi T et al (2017) High‐speed atomic force microscopy reveals loss of nuclear pore resilience as a dying code in colorectal cancer cells. ACS Nano 11: 5567–5578 [DOI] [PubMed] [Google Scholar]
- 36. Lupu F, Alves A, Anderson K, Doye V, Lacy E (2008) Nuclear pore composition regulates neural stem/progenitor cell differentiation in the mouse embryo. Dev Cell 14: 831–842 [DOI] [PMC free article] [PubMed] [Google Scholar]
- 37. D'Angelo MA, Gomez‐Cavazos JS, Mei A, Lackner DH, Hetzer MW (2012) A change in nuclear pore complex composition regulates cell differentiation. Dev Cell 22: 446–458 [DOI] [PMC free article] [PubMed] [Google Scholar]
- 38. Gomez‐Cavazos JS, Hetzer MW (2015) The nucleoporin gp210/Nup210 controls muscle differentiation by regulating nuclear envelope/ER homeostasis. J Cell Biol 208: 671–681 [DOI] [PMC free article] [PubMed] [Google Scholar]
- 39. Jacinto FV, Benner C, Hetzer MW (2015) The nucleoporin Nup153 regulates embryonic stem cell pluripotency through gene silencing. Genes Dev 29: 1224–1238 [DOI] [PMC free article] [PubMed] [Google Scholar]
- 40. Ibarra A, Benner C, Tyagi S, Cool J, Hetzer MW (2016) Nucleoporin‐mediated regulation of cell identity genes. Genes Dev 30: 2253–2258 [DOI] [PMC free article] [PubMed] [Google Scholar]
- 41. Raices M, Bukata L, Sakuma S, Borlido J, Hernandez LS, Hart DO, D'Angelo MA (2017) Nuclear pores regulate muscle development and maintenance by assembling a localized Mef2C complex. Dev Cell 41: 540–554 [DOI] [PMC free article] [PubMed] [Google Scholar]
- 42. Raices M, D'Angelo MA (2012) Nuclear pore complex composition: a new regulator of tissue‐specific and developmental functions. Nat Rev Mol Cell Biol 13: 687–699 [DOI] [PubMed] [Google Scholar]
- 43. Testoni B, Borrelli S, Tenedini E, Alotto D, Castagnoli C, Piccolo S, Tagliafico E, Ferrari S, Viganò MA, Mantovani R (2006) Identification of new p63 targets in human keratinocytes. Cell Cycle 5: 2805–2811 [DOI] [PubMed] [Google Scholar]
- 44. Sbisa E, Mastropasqua G, Lefkimmiatis K, Caratozzolo MF, D'Erchia AM, Tullo A (2006) Connecting p63 to cellular proliferation: the example of the adenosine deaminase target gene. Cell Cycle 5: 205–212 [DOI] [PubMed] [Google Scholar]
- 45. Ihrie RA, Marques MR, Nguyen BT, Horner JS, Papazoglu C, Bronson RT, Mills AA, Attardi LD (2005) Perp is a p63‐regulated gene essential for epithelial integrity. Cell 120: 843–856 [DOI] [PubMed] [Google Scholar]
- 46. Laurikkala J, Mikkola ML, James M, Tummers M, Mills AA, Thesleff I (2006) p63 regulates multiple signalling pathways required for ectodermal organogenesis and differentiation. Development 133: 1553–1563 [DOI] [PubMed] [Google Scholar]
- 47. Sen GL, Boxer LD, Webster DE, Bussat RT, Qu K, Zarnegar BJ, Johnston D, Siprashvili Z, Khavari PA (2012) ZNF750 is a p63 target gene that induces KLF4 to drive terminal epidermal differentiation. Dev Cell 22: 669–677 [DOI] [PMC free article] [PubMed] [Google Scholar]
- 48. Hazawa M, Lin DC, Handral H, Xu L, Chen Y, Jiang YY, Mayakonda A, Ding LW, Meng X, Sharma A et al (2017) ZNF750 is a lineage‐specific tumour suppressor in squamous cell carcinoma. Oncogene 36: 2243–2254 [DOI] [PMC free article] [PubMed] [Google Scholar]
- 49. Westfall MD, Mays DJ, Sniezek JC, Pietenpol JA (2003) The Delta Np63 alpha phosphoprotein binds the p21 and 14‐3‐3 sigma promoters in vivo and has transcriptional repressor activity that is reduced by Hay‐Wells syndrome‐derived mutations. Mol Cell Biol 23: 2264–2276 [DOI] [PMC free article] [PubMed] [Google Scholar]
- 50. Li N, Singh S, Cherukuri P, Li H, Yuan Z, Ellisen LW, Wang B, Robbins D, DiRenzo J (2008) Reciprocal intraepithelial interactions between TP63 and hedgehog signaling regulate quiescence and activation of progenitor elaboration by mammary stem cells. Stem Cells 26: 1253–1264 [DOI] [PMC free article] [PubMed] [Google Scholar]
- 51. Memmi EM, Sanarico AG, Giacobbe A, Peschiaroli A, Frezza V, Cicalese A, Pisati F, Tosoni D, Zhou H, Tonon G et al (2015) p63 Sustains self‐renewal of mammary cancer stem cells through regulation of Sonic Hedgehog signaling. Proc Natl Acad Sci USA 112: 3499–3504 [DOI] [PMC free article] [PubMed] [Google Scholar]
- 52. De Rosa L, Antonini D, Ferone G, Russo MT, Yu PB, Han R, Missero C (2009) p63 Suppresses non‐epidermal lineage markers in a bone morphogenetic protein‐dependent manner via repression of Smad7. J Biol Chem 284: 30574–30582 [DOI] [PMC free article] [PubMed] [Google Scholar]
- 53. Su X, Gi YJ, Chakravarti D, Chan IL, Zhang A, Xia X, Tsai KY, Flores ER (2012) TAp63 is a master transcriptional regulator of lipid and glucose metabolism. Cell Metab 16: 511–525 [DOI] [PMC free article] [PubMed] [Google Scholar]
- 54. Kosako H, Yamaguchi N, Aranami C, Ushiyama M, Kose S, Imamoto N, Taniguchi H, Nishida E, Hattori S (2009) Phosphoproteomics reveals new ERK MAP kinase targets and links ERK to nucleoporin‐mediated nuclear transport. Nat Struct Mol Biol 16: 1026–1035 [DOI] [PubMed] [Google Scholar]
- 55. Iwanicki MP, Vomastek T, Tilghman RW, Martin KH, Banerjee J, Wedegaertner PB, Parsons JT (2008) FAK, PDZ‐RhoGEF and ROCKII cooperate to regulate adhesion movement and trailing‐edge retraction in fibroblasts. J Cell Sci 121: 895–905 [DOI] [PubMed] [Google Scholar]
- 56. Ishizaki T, Naito M, Fujisawa K, Maekawa M, Watanabe N, Saito Y, Narumiya S (1997) p160ROCK, a Rho‐associated coiled‐coil forming protein kinase, works downstream of Rho and induces focal adhesions. FEBS Lett 404: 118–124 [DOI] [PubMed] [Google Scholar]
- 57. Christie M, Chang CW, Róna G, Smith KM, Stewart AG, Takeda AA, Fontes MR, Stewart M, Vértessy BG, Forwood JK et al (2016) Structural biology and regulation of protein import into the nucleus. J Mol Biol 428: 2060–2090 [DOI] [PubMed] [Google Scholar]
- 58. Liang SH, Clarke MF (1999) The nuclear import of p53 is determined by the presence of a basic domain and its relative position to the nuclear localization signal. Oncogene 18: 2163–2166 [DOI] [PubMed] [Google Scholar]
- 59. Liang SH, Clarke MF (1999) A bipartite nuclear localization signal is required for p53 nuclear import regulated by a carboxyl‐terminal domain. J Biol Chem 274: 32699–32703 [DOI] [PubMed] [Google Scholar]
- 60. Inoue T, Stuart J, Leno R, Maki CG (2002) Nuclear import and export signals in control of the p53‐related protein p73. J Biol Chem 277: 15053–15060 [DOI] [PubMed] [Google Scholar]
- 61. Solmaz SR, Chauhan R, Blobel G, Melčák I (2011) Molecular architecture of the transport channel of the nuclear pore complex. Cell 147: 590–602 l [DOI] [PMC free article] [PubMed] [Google Scholar]
- 62. Sahoo MR, Gaikwad S, Khuperkar D, Ashok M, Helen M, Yadav SK, Singh A, Magre I, Deshmukh P, Dhanvijay S et al (2017) Nup358 binds to AGO proteins through its SUMO‐interacting motifs and promotes the association of target mRNA with miRISC. EMBO Rep 18: 241–263 [DOI] [PMC free article] [PubMed] [Google Scholar]
- 63. Toda T, Hsu JY, Linker SB, Hu L, Schafer ST, Mertens J, Jacinto FV, Hetzer MW, Gage FH (2017) Nup153 interacts with Sox2 to enable bimodal gene regulation and maintenance of neural progenitor cells. Cell Stem Cell 21: 618–634.e7 [DOI] [PubMed] [Google Scholar]
- 64. Rocco JW, Leong CO, Kuperwasser N, DeYoung MP, Ellisen LW (2006) p63 mediates survival in squamous cell carcinoma by suppression of p73‐dependent apoptosis. Cancer Cell 9: 45–56 [DOI] [PubMed] [Google Scholar]
- 65. Gebel J, Luh LM, Coutandin D, Osterburg C, Löhr F, Schäfer B, Frombach AS, Sumyk M, Buchner L, Krojer T et al (2016) Mechanism of TAp73 inhibition by ΔNp63 and structural basis of p63/p73 hetero‐tetramerization. Cell Death Differ 23: 1930–1940 [DOI] [PMC free article] [PubMed] [Google Scholar]
- 66. Schoch RL, Kapinos LE, Lim RY (2012) Nuclear transport receptor binding avidity triggers a self‐healing collapse transition in FG‐nucleoporin molecular brushes. Proc Natl Acad Sci USA 109: 16911–16916 [DOI] [PMC free article] [PubMed] [Google Scholar]
- 67. MacPartlin M, Zeng S, Lee H, Stauffer D, Jin Y, Thayer M, Lu H (2005) p300 regulates p63 transcriptional activity. J Biol Chem 280: 30604–30610 [DOI] [PubMed] [Google Scholar]
- 68. Hashizume C, Moyori A, Kobayashi A, Yamakoshi N, Endo A, Wong RW (2013) Nucleoporin Nup62 maintains centrosome homeostasis. Cell Cycle 12: 3804–3816 [DOI] [PMC free article] [PubMed] [Google Scholar]
Associated Data
This section collects any data citations, data availability statements, or supplementary materials included in this article.
Supplementary Materials
Expanded View Figures PDF
Source Data for Expanded View
Review Process File
Source Data for Figure 1
Source Data for Figure 2
Source Data for Figure 3
Source Data for Figure 4
Source Data for Figure 5
Source Data for Figure 6
Source Data for Figure 7