Abstract
Eukaryotic cells store lipids in cytosolic organelles known as lipid droplets (LDs). Lipid droplet bud from the endoplasmic reticulum (ER), and may be harvested by the vacuole for energy during prolonged periods of starvation. How cells spatially coordinate LD production is poorly understood. Here, we demonstrate that yeast ER–vacuole contact sites (NVJs) physically expand in response to metabolic stress, and serve as sites for LD production. NVJ tether Mdm1 demarcates sites of LD budding, and interacts with fatty acyl‐CoA synthases at the NVJ periphery. Artificially expanding the NVJ through over‐expressing Mdm1 is sufficient to drive NVJ‐associated LD production, whereas ablating the NVJ induces defects in fatty acid‐to‐triglyceride production. Collectively, our data suggest a tight metabolic link between nutritional stress and LD biogenesis that is spatially coordinated at ER–vacuole contact sites.
Keywords: endoplasmic reticulum, lipid droplet, membrane contact site, nuclear ER–vacuole junction, nutritional stress
Subject Categories: Membrane & Intracellular Transport, Metabolism
Introduction
Upon sensing a decline in nutrients such as sugar, yeast undergo metabolic remodeling characterized by the formation of lipid storage organelles termed lipid droplets (LDs) 1. Lipid droplets originate from the surface of the endoplasmic reticulum (ER), and key enzymes required for LD biogenesis have been identified and characterized 2. However, what defines the sites from which LDs bud and the mechanisms that trigger LD biogenesis remain unclear. Defects in LD biogenesis or pathological lipid accumulation are hallmarks of prominent metabolic diseases including obesity, type 2 diabetes, fatty liver disease, and cardiovascular disease 3. Thus, understanding the mechanisms governing cellular LD dynamics will have a significant impact on human health and the treatment of metabolic diseases.
Lipid droplets are composed of an outer lipid monolayer that surrounds an interior of fatty acids and sterols donated by the ER, the major anabolic organelle of eukaryotes 4. These fatty acids are either derived from the extracellular environment or synthesized de novo, and are incorporated into LDs after being converted into triacylglyceride (TAG) and sterol ester (SE). The synthesis of both TAG and SE requires the coordinated effort of an ensemble of cytoplasmic and ER‐associated enzymes, which chemically modify sterol and free fatty acid (FFA) in a stepwise manner 2. Despite identifying the enzymes required for TAG and SE synthesis, how these enzymes are spatially coordinated to drive LD biogenesis and what determines where LDs bud within the ER network remain major questions in the field of lipid metabolism.
Recent studies indicate that inter‐organelle membrane contact sites (MCSs) are important centers for spatially compartmentalizing lipid metabolic reactions 5. Indeed, MCSs formed between the ER and the plasma membrane (PM) coordinate phospholipid trafficking to maintain organelle identity and homeostasis 6. Similarly, ER–mitochondrial contact sites are hot spots for phospholipid exchange between these organelles, and are required for growth in nutritionally challenging non‐fermentable media, suggesting an essential role for ER–mitochondria crosstalk in the maintenance of cellular health under metabolic stress 7. In yeast, LDs maintain close contact with the ER from which they bud 8. Though poorly understood, these ER–LD contact sites are thought to regulate LD biogenesis as well as LD composition, size, and dynamics.
The yeast ER network also maintains a clear MCS with the vacuole, which is equivalent to the mammalian lysosome. This site is termed the nuclear ER (nER)–vacuole junction, or the NVJ 9. The role of the NVJ in cellular homeostasis is unclear. However, it represents a physical contact between the principal anabolic and catabolic organelles of yeast (the ER and vacuole, respectively), implying an important role for the NVJ in cellular metabolic crosstalk 10. Consistent with this, proteins have been observed to dynamically relocate to the NVJ during times of nutritional stress. One example is Nvj2, which accumulates at the NVJ as yeast enter stationary growth 11. Similarly, Vps13, which resides at vacuole–mitochondrial contacts in yeast grown in dextrose, relocates to the NVJ when cultured in glycerol 12. Thus, the NVJ functions as a docking site for numerous proteins involved in cellular metabolism, but its role in cellular homeostasis and stress response remains unclear.
Here, we investigate the role of NVJ contact sites in LD production during nutritional stress. Our results provide evidence for a tight coupling of the NVJ with lipid metabolism and LD production and suggest that NVJs may serve to spatially organize and compartmentalize lipid metabolism during times of nutritional stress.
Results
NVJs are dynamic contact sites regulated by the metabolic state of the cell
Nuclear ER–vacuole junctions are defined as inter‐organelle junctions formed between the nuclear ER and vacuole through a tight interaction between the vacuolar protein Vac8 and Nvj1, an integral membrane protein anchored on the perinuclear ER 9. Previous studies showed that NVJ1 mRNA transcripts are upregulated as cultured yeast transition from exponential phase growth into nutrient‐poor stationary phase 13, 14. Consistent with gene array analysis, the size of Nvj1‐GFP “patches” were found to be larger in stationary phase cells 9. Therefore, in response to nutrient depletion, NVJs may physically expand proportionally to Nvj1 expression levels. To test this hypothesis, we examined the size of the NVJ in living yeast under a series of growth conditions.
Nuclear ER–vacuole junction size can be accurately estimated using light microscopy by examining chromosomally tagged Nvj1‐GFP, which forms an elongated patch along the ER–vacuole interface. Yeast grown in the presence of abundant dextrose (exponential growth phase) maintained small NVJs averaging less than 1 μm in length (Fig 1A and B). In contrast, yeast displayed a marked increase in average NVJ length to ~1.4 μm when grown for 2 days into stationary phase when dextrose is largely exhausted (Fig 1A and B). Stationary phase yeast may also experience a reduction in amino acid levels; therefore, NVJ size was monitored in yeast cultured in media lacking the amino acid leucine, or in the presence of TORC1 inhibitor rapamycin that mimics starvation. These conditions also induced a significant increase in NVJ length to an average of ~2.5 and 3.2 μm, respectively (Fig EV1A and B).
Figure 1. Nutritional stress induces NVJ expansion and transcriptional upregulation of Nvj1.
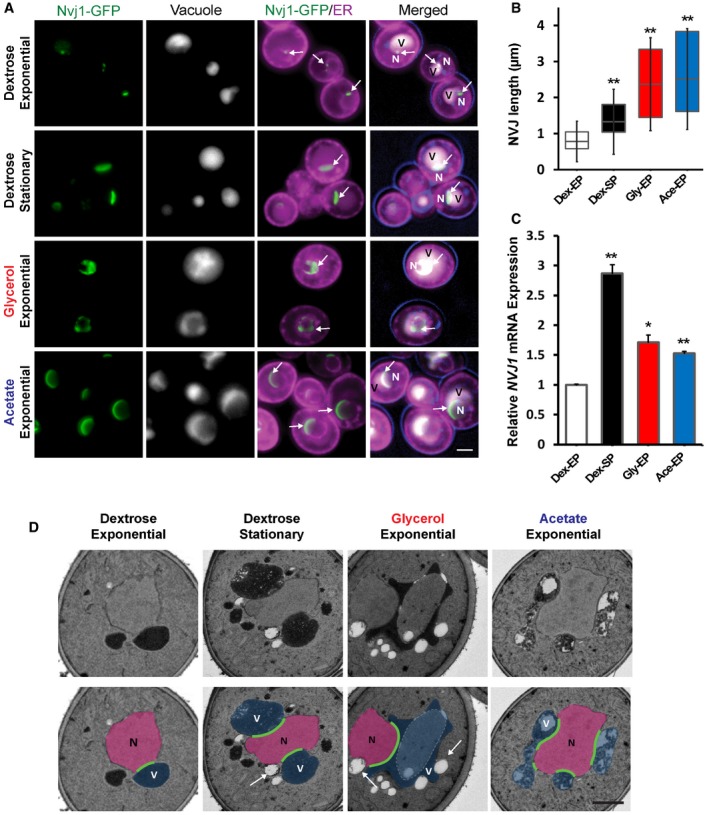
- Light microscopy for yeast expressing chromosomally tagged Nvj1‐GFP (arrows), ER marker DsRed‐HDEL, and vacuole stained by CMAC. Scale bar, 2 μm. N, nucleus; V, vacuole.
- Quantification of the NVJ length (μm) in (A) (box plots of median and range, n > 50 cells, **P < 0.005, Student's t‐test).
- qRT–PCR showing NVJ1 expression levels in different growth conditions. Dex, dextrose; Gly, glycerol; Ace, acetate; EP, exponential phase; SP, stationary phase (mean ± SEM, n = 3 independent cultures per condition, **P < 0.005 and *P < 0.05, Student's t‐test).
- Electron micrographs of yeast grown in different conditions. Arrows indicate lipid droplets. Scale bar, 0.5 μm. N, nucleus; V, vacuole.
Figure EV1. NVJ contact sites respond to nutrient stress.
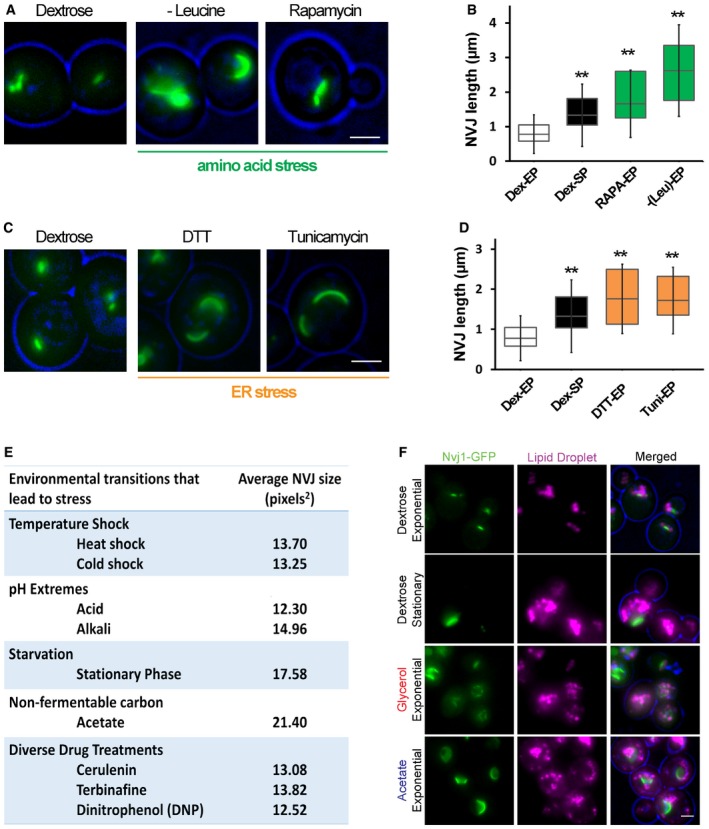
- Light microscopy for cells expressing chromosomally tagged Nvj1‐GFP imaged in amino acid stress. Scale bar, 2 μm.
- Quantification of the NVJ length (μm) in (A) (box plots of median and range, n > 50 cells, **P < 0.005, Student's t‐test).
- Light microscopy for cells expressing chromosomally tagged Nvj1‐GFP imaged in DTT and tunicamycin. Scale bar, 2 μm.
- Quantification of the NVJ length (μm) in (C) (box plots of median and range, n > 50 cells, **P < 0.005, Student's t‐test).
- Summary table for different stress conditions and their effect on NVJ size based on visual screening. Values are in pixels2.
- Light microscopy of LDs in yeast expressing chromosomally tagged Nvj1‐GFP grown in different conditions. Scale bar, 2 μm.
As yeast deplete dextrose in their media, they switch their metabolism to rely largely on ethanol as a non‐fermentable carbon source 14. Therefore, to determine whether non‐fermentable carbon sources could also affect NVJ size, yeast were inoculated into media containing either glycerol or acetate. Under these conditions, the levels of NVJ1 mRNA were significantly upregulated, and the size of the NVJ dramatically increased to an average of ~2.2 μm (Fig 1B and C). Collectively, our results confirm previous observations that the NVJ expands in stationary phase 9, and further show that metabolic changes associated with the transition out of exponential growth also induce NVJ expansion.
To determine whether other cellular stresses could similarly induce NVJ expansion, NVJ size was examined in cells cultured under different growth conditions that are known to induce stress response in yeast. Whereas induction of the ER unfolded protein response (UPR) triggered a significant increase in NVJ size, stresses that affect general protein and membrane homeostasis, such as temperature and cytoplasmic pH, failed to alter NVJ size (Fig EV1C–E). Similarly, the addition of toxic chemicals and drugs affecting various metabolic pathways did not affect the size of the NVJ (Fig EV1E). Therefore, our observations suggest that NVJ expansion is largely a form of cellular adaptation to nutritional stress.
NVJ expansion and lipid droplet formation are functionally coupled
To visualize the consequences of NVJ expansion on organelle morphology and cellular homeostasis, thin‐section transmission electron microscopy (TEM) was conducted. As expected, enhanced contacts were observed between the perinuclear ER and the vacuole in yeast growing in stationary phase and non‐fermentable carbon sources (glycerol and acetate; Fig 1D). Remarkably, yeast cultured in these conditions also exhibited many lipid droplets (LDs), and these were often located in the immediate proximity of the NVJ (Figs 1D and EV2A).
Figure EV2. The NVJ is a site for LD formation.
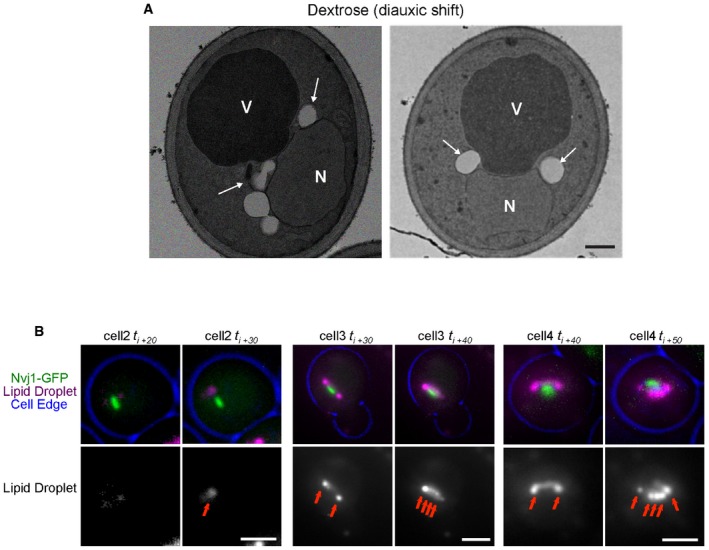
- TEM of WT yeast grown at diauxic shift. Arrows indicate LDs. Scale bar, 0.5 μm. N, nucleus; V, vacuole.
- Single cells (cell 1, 2, and 3) imaged at different times after cerulenin washout (t i). LDs (arrows) visualized by AutoDOT staining and NVJ visualized by Nvj1‐GFP. Scale bar, 2 μm.
Lipid droplets are known to bud from the ER network, and have been observed in the proximity of the NVJ in yeast growing in stationary phase 15, 16. However, the relationship between NVJ expansion and LD budding has not been thoroughly examined. To dissect this relationship, yeast were cultured in dextrose‐rich media and harvested at different growth phases in the transition from exponential growth to stationary phase (Fig 2A). The chief components of LDs, triglyceride (TAG) and sterol ester (SE), were monitored using thin‐layer chromatography (TLC) in each of these growth phases.
Figure 2. NVJ is the site for starvation‐induced LD accumulation.
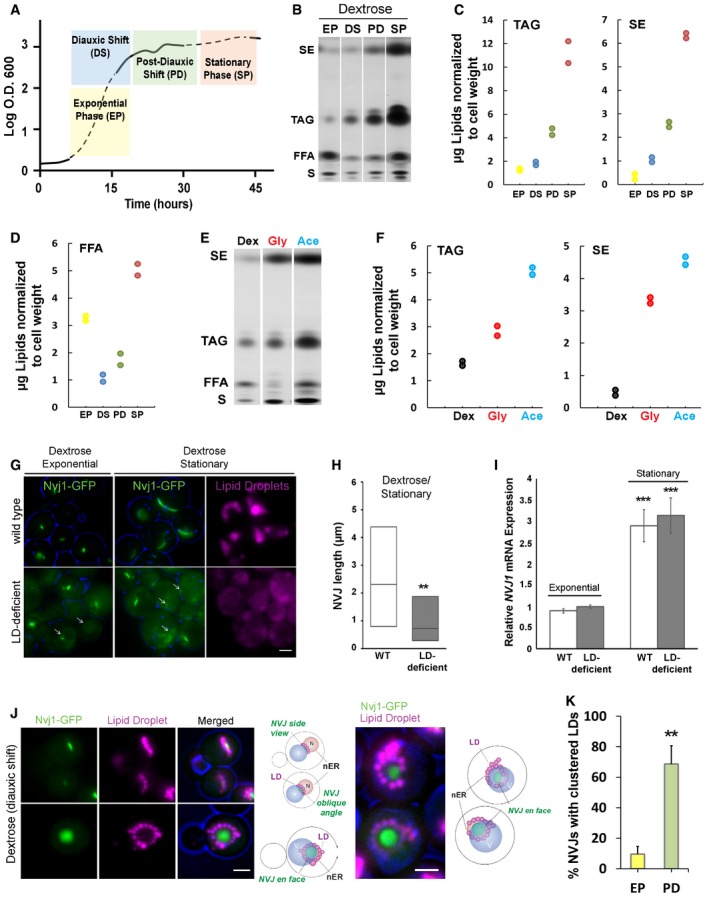
- Growth curve representing the number of cells (OD600) versus time (in hours) of WT yeast grown in dextrose.
- TLC of neutral lipids from WT yeast grown in dextrose and collected at different growth stages. EP, exponential phase; DS, diauxic shift; PD, post‐diauxic shift; SP, stationary phase; SE, sterol esters; TAG, triacylglycerides; FFA, free fatty acids; S, sterols.
- Quantification of TAG and SE (μg; normalized to cell pellet weight) of TLC from (B).
- Quantification of free fatty acids (FFA) (normalized to cell pellet weight) of TLC from (B).
- TLC of neutral lipids from yeast grown in Dex, Gly, and Ace collected at DS. SE, sterol esters; TAG, triacylglycerides; FFA, free fatty acids; S, sterols.
- Quantification of TAG and SE (μg; normalized to cell pellet weight) of TLC from (E).
- Light microscopy of Nvj1‐GFP in WT and mutant yeast (LD‐deficient) lacking enzymes needed to make LDs. Arrows indicate unextended NVJ. Scale bar, 2 μm.
- Quantification of images in (G) (box plots of median and range, n > 50 cells, **P < 0.005, Student's t‐test).
- qRT–PCR showing NVJ1 expression levels in WT and LD‐deficient yeast (mean ± SEM, n = 3 independent cultures per condition, ***P < 0.001, Student's t‐test).
- Light microscopy of LDs stained with AutoDOT in cells expressing chromosomally tagged Nvj1‐GFP at DS with illustration of the spatial distribution of LDs around the NVJ. Scale bar, 2 μm.
- Quantification of LD clustering around the NVJ from cells imaged in (J) (percentage of cells with clustered LDs around the NVJ over total number of cells counted, mean ± SD, n > 50 cells, **P < 0.005, Student's t‐test).
In agreement with our microscopy data, yeast growing in the exponential phase contained low levels of TAG and SE (Fig 2B and C). As yeast exit exponential growth and enter diauxic shift (DS), they convert free fatty acids (FFAs) into TAG and SE (Fig 2B and D). Both TAG and SE levels continued to increase in post‐diauxic shift growth phase (~24 h in culture) and peaked in stationary phase (more than 48 h in culture; Fig 2C). Once in stationary phase, yeast began to exhibit increased FFAs, implying an increase in LD turnover (Fig 2D).
Yeast cultured in non‐fermentable glycerol and acetate also exhibited enlarged NVJs; therefore, we also examined their neutral lipid level by TLC. Similar to yeast grown in stationary phase dextrose, yeast grown in non‐fermentable media had elevated TAG and SE (Fig 2E and F), as well as abundant cytoplasmic lipid droplets (Fig EV1F). Collectively, these data suggest that yeast cultured in metabolically challenging conditions tend to exhibit both expanded NVJs and elevated LDs and neutral lipid levels.
To further investigate the relationship between NVJ expansion and LD biogenesis, we examined the size of the NVJ in LD‐deficient yeast. We utilized a yeast strain unable to synthesize TAG and SE due to the genetic ablation of sterol esterases Are1 and Are2, as well as the TAG synthase Lro1 17, 18. The only remaining TAG synthase, Dga1, was placed under a GAL promoter (pGAL), allowing LD biogenesis to be induced when yeast are grown in galactose but not dextrose. We tested whether this LD‐deficient strain could expand its NVJ in response to nutrient starvation by visually monitoring Nvj1‐GFP in different growth conditions. Strikingly, LD‐deficient yeast failed to expand their NVJ following 48‐h growth into stationary phase (Fig 2G and H). Despite this, LD‐deficient yeast exhibited elevated levels of NVJ1 mRNA transcripts in stationary phase similar to wild‐type yeast, suggesting that the inability to expand the NVJ was not due to a block in NVJ1 upregulation (Fig 2I). Therefore, our data indicate that Nvj1 upregulation is not sufficient to expand the NVJ, and other factors requiring some aspect of LD budding may be important for NVJ expansion.
Starvation‐induced LDs decorate the edges of the NVJ
Nuclear ER–vacuole junction expansion and LD production appeared to be directly correlated; therefore, we next investigated whether the NVJ may be a specific site for LD biogenesis. Recent studies examining early stages of LD biogenesis reveal that LDs normally bud from the ER network and can occasionally concentrate along the nuclear ER surface during starvation 16, 18. Thus, we imaged Nvj1‐GFP yeast undergoing diauxic shift, where FFA‐to‐TAG conversion was maximal. Strikingly, imaging revealed a dramatic arrangement of LDs surrounding the NVJ (defined here as within ~0.5 μm of the Nvj1‐GFP signal), with many LDs accumulating along the NVJ periphery (Fig 2J). LD clustering around the NVJ was dependent on the growth status of the yeast, with ~76% of yeast exhibiting LD clustering shortly after diauxic shift as opposed to only ~10% in exponential growth (Fig 2K).
To confirm that these LDs were generated at the region surrounding the NVJ, and not transported there following their formation, LD budding was directly monitored in Nvj1‐GFP yeast. To do this, yeast were cultured in the presence of cerulenin, an inhibitor of de novo fatty acid synthesis, which clears yeast of pre‐existing LDs as they become a sole source of fatty acids. Following 3 h of cerulenin treatment, yeast exhibited a nearly complete loss of LDs exemplified by dim LD staining with AutoDOT dye, and the redistribution of the LD resident protein Erg6‐GFP into the ER network (Fig 3A). Cerulenin washout with fresh medium initiates new LD biogenesis, which can be directly monitored. Indeed, within one hour following inoculation into fresh medium, small LDs appeared around the NVJ (Fig 3B).
Figure 3. Time‐lapse imaging of LD budding at the NVJ .
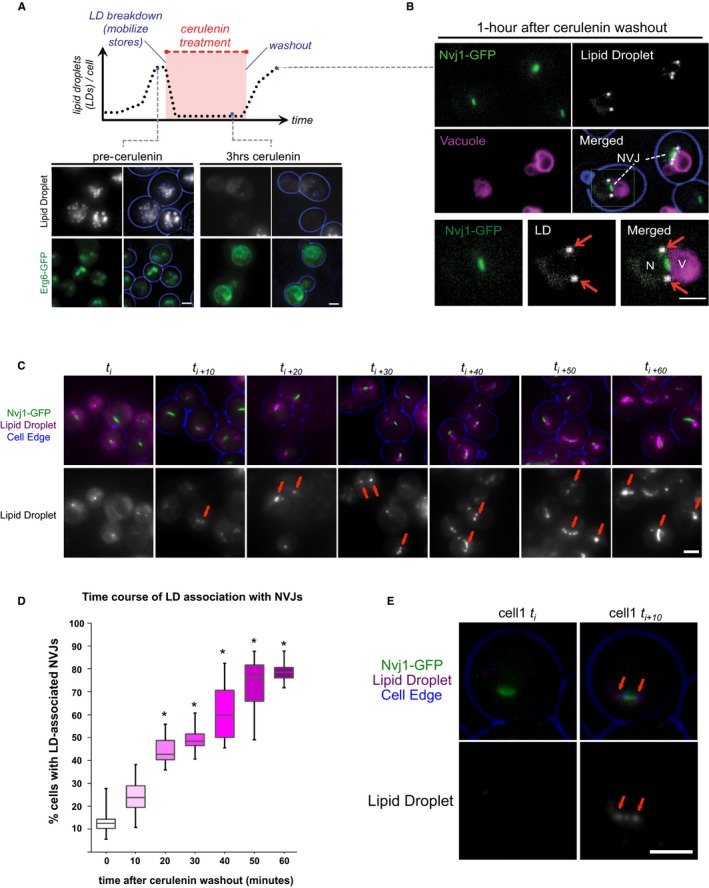
- Top: Graph depiction of changes in lipid droplet content per cell in the presence of cerulenin. Bottom: Light microscopy for LDs visualized by AutoDOT staining and Erg6‐GFP before and during cerulenin treatment. Scale bar, 2 μm.
- Light microscopy performed 1 h post‐cerulenin washout. LDs (arrows) visualized by AutoDOT staining, NVJ visualized by Nvj1‐GFP, and vacuole stained using CMAC. Scale bar, 2 μm.
- Light microscopy of Nvj1‐GFP‐tagged yeast performed at 10‐min increments following initial cerulenin washout (t i). LDs (arrows) visualized by AutoDOT staining. Scale bar, 2 μm.
- Quantification of LD‐NVJ association from images obtained in (C) (percentage of cells with LD‐NVJ association over total number of cells counted, box plots of median and range, n > 50 cells per time point, *P < 0.05, Student's t‐test).
- Single cell imaged at initial and 10 min following cerulenin washout. LDs (arrows) visualized by AutoDOT staining and NVJ visualized by Nvj1‐GFP. Scale bar, 2 μm.
Time‐lapse microscopy indicates the NVJ is a site of LD budding
To further distinguish whether these NVJ‐associated LDs are generated at the NVJ itself, or are trafficked there following their formation in other regions of the cell, we conducted time‐lapse imaging of yeast every 10 min following initial cerulenin washout (t i). Indeed, time‐lapse imaging revealed a significant increase in LDs associated with NVJs over time following cerulenin washout, going from only ~12% of cells exhibiting NVJ‐associated LDs at the initial time period, to ~77% of yeast exhibiting NVJ‐associated LDs after 1 h (Fig 3C and D). Furthermore, we observed the appearance of unambiguous small LDs at the NVJ (co‐localized with Nvj1‐GFP) of the same cell within 10 min of cerulenin washout, a time period previously observed to allow LDs to be clearly visible by dye‐based staining 4 (Fig 3E, arrows). Monitoring other individual cells following cerulenin washout revealed several examples of NVJs with gradually accumulating small LDs, often with brighter LDs accumulating at their NVJ peripheries over time (Fig EV2B). This is consistent with previous studies which observed Pah1‐GFP at a subdomain on the nuclear surface from which LDs were budding 16. Altogether, these data suggest that the NVJ itself can serve as a site for LD budding.
NVJ tether Mdm1 co‐localizes with lipid droplets at the NVJ periphery
To better understand the functional coupling between LD budding and NVJ expansion, we next investigated the spatial organization of the NVJ itself by examining the two major tethering proteins that mediate ER–vacuole contact: Nvj1 and Mdm1 9, 19. Yeast with chromosomally tagged Nvj1‐mCherry (mCh) and Mdm1‐GFP were imaged using 3D structured illumination microscopy (SIM). As expected, imaging revealed that Nvj1‐mCh formed a patch extending along the entire NVJ contact site (Fig 4A). In contrast, Mdm1‐GFP appeared to be largely enriched as distinct foci at the NVJ periphery (Fig 4A). Indeed, serial Z‐stacking of sequential yeast sections revealed clear enrichment of Mdm1‐GFP foci at the NVJ periphery, in contrast to Nvj1‐mCh (Figs 4B and C, and EV3A and B, Movie EV1). Time‐lapse imaging further revealed that Mdm1‐GFP foci were dynamic, but generally concentrated along the NVJ periphery (Movie EV2). These observations imply that NVJ tethers may be spatially organized into two sub‐regions: the NVJ core which is demarcated by Nvj1, and the NVJ periphery where Mdm1 appears preferentially enriched.
Figure 4. Mdm1 co‐localizes with LDs at the NVJ periphery.
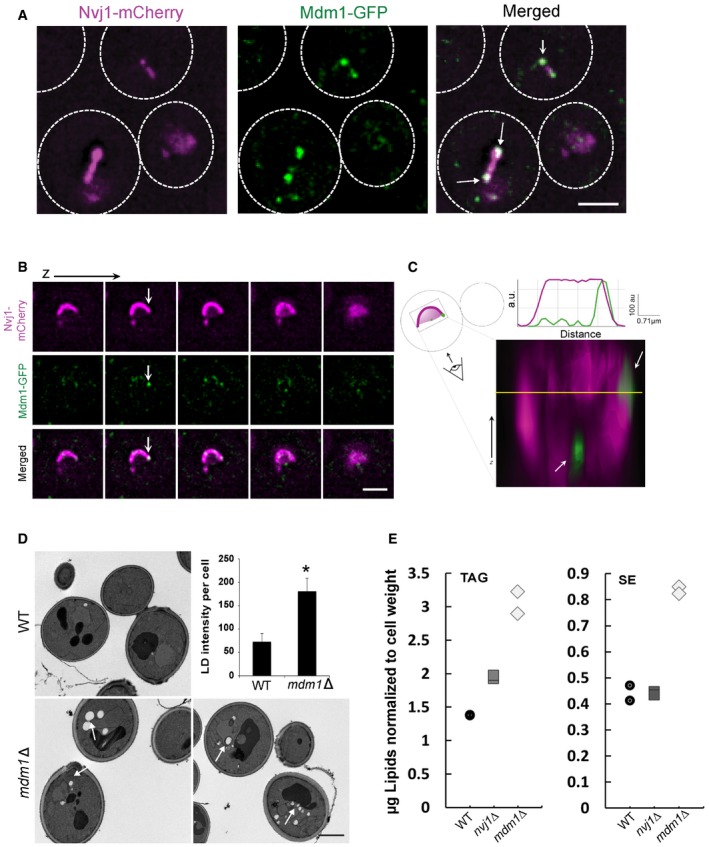
- Single optical sections of chromosomally tagged Mdm1‐GFP (green) and Nvj1‐mCherry (magenta) imaged using 3D‐SIM. Arrows indicate Mdm1‐GFP enrichment sites. Scale bar, 2 μm.
- Sequential optical sections of yeast with Mdm1‐GFP and Nvj1‐mCherry. Arrows indicate Mdm1‐GFP enrichment sites. Scale bar, 2 μm.
- 3D stacking of optical sections with line traces. Arrows indicate Mdm1‐GFP enrichment sites.
- TEM of WT and mdm1Δ yeast in exponential growth. Arrows depict lipid droplets. Scale bar, 2 μm. Top right: Quantification using ImageJ of LD intensity per cell from light microscopy imaging (mean ± SD, n > 50 cells, *P < 0.05, Student's t‐test).
- Quantification of TAG and SE (μg; normalized to cell pellet weight) from TLC in Fig EV3D.
Figure EV3. Mdm1 enriches at the NVJ where LD form.
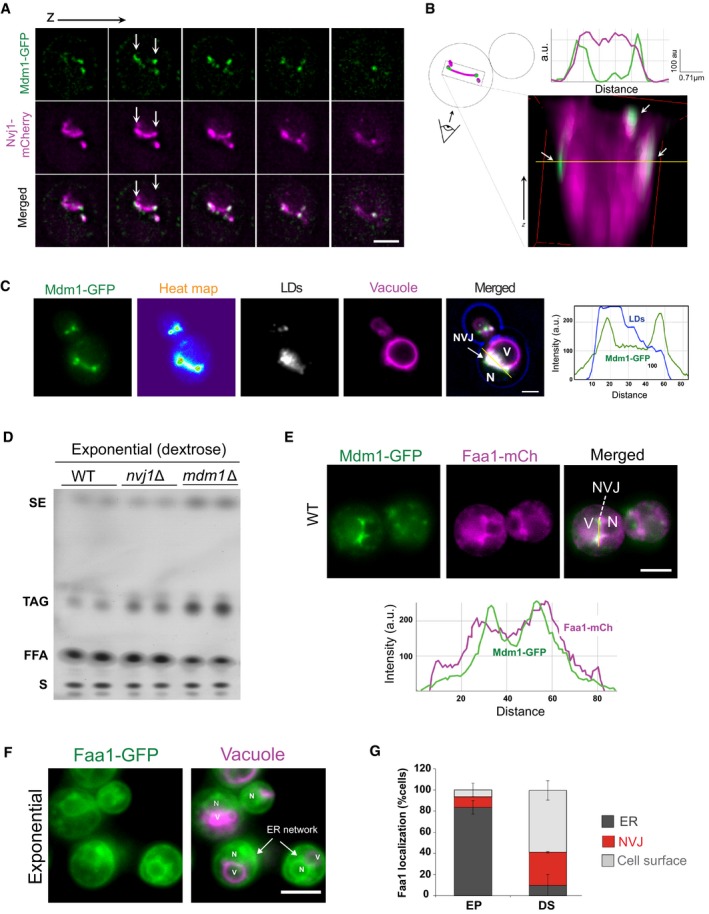
- Sequential optical sections of yeast with Mdm1‐GFP and Nvj1‐mCherry. Arrows indicate sites for Mdm1‐GFP enrichment. Scale bar, 2 μm.
- 3D stacking of optical sections and line trace plot. Arrows indicate sites for Mdm1‐GFP enrichment.
- Light microscopy of yeast mildly over‐expressing Mdm1‐GFP, with LDs and vacuole labeled using AutoDOT and FM4‐64 dye, respectively. Right: Line trace for light microscopy image (yellow line). Scale bar, 2 μm. N, nucleus; V, vacuole.
- Neutral lipids TLC for WT, nvj1Δ, and mdm1Δ yeast quantified in Fig 4E. SE, sterol esters; TAG, triacylglycerides; FFA, free fatty acids; S, sterols.
- Top: Dual‐labeling imaging for Mdm1‐GFP and Faa1‐mCherry. Scale bar, 2 μm. Bottom: Line trace for light microscopy (top, yellow line). N, nucleus; V, vacuole.
- Light microscopy for chromosomally tagged Faa1‐GFP in exponential phase. Arrows indicate the ER network. Scale bar, 2 μm. N, nucleus; V, vacuole.
- Quantification of Faa1‐GFP localization in different growth conditions. EP, exponential phase; DS, diauxic shift.
Mdm1 appeared to enrich at the NVJ periphery where we observed LD accumulations (Fig 4A). Imaging of cells expressing low levels of Mdm1 confirmed that Mdm1 co‐localized with NVJ‐associated LDs (Fig EV3C). Therefore, we investigated whether Mdm1 played any role in LD homeostasis. Deleting MDM1 led to an increase in cytoplasmic LDs as observed by both thin‐sectioning TEM and light microscopy (Fig 4D). Consistent with this, mdm1Δ yeast exhibited a ~2‐fold increase in TAG and SE compared to wild‐type (WT) controls even in cells growing at exponential phase (Figs 4E and EV3D). In contrast, deleting NVJ1 did not have a significant effect on cellular SE and a minor increase in TAG levels (Figs 4E and EV3D). This suggests that Mdm1 may play a role in NVJ‐associated LD dynamics.
Mdm1 interacts with fatty acid‐activating enzymes
To better understand how Mdm1 may contribute to LD dynamics at the NVJ, we next conducted mass spectrometry‐based proteomic analysis to reveal the interactome of Mdm1. We found that Mdm1‐GFP immuno‐precipitated with enzymes involved in fatty acid synthesis, including Faa1, Fas1, and Fas2 (Fig 5A). Consistent with this, multi‐channel imaging revealed that Faa1‐GFP localized to the NVJ, and co‐localized with LDs and Mdm1 in yeast undergoing diauxic shift (quantification revealed ~32% of yeast in DS exhibited NVJ‐associated Faa1‐GFP; Figs 5B and C, and EV3E). Indeed, this Faa1‐GFP NVJ association was dependent on the metabolic status of the yeast, as Faa1‐GFP localized throughout the cytoplasm and ER network in yeast undergoing exponential growth (only ~9% of yeast with Faa1‐GFP enriched at NVJs; Figs 5B and EV3F and G). Collectively, our data suggest that fatty acyl‐CoA syntheses including Faa1 may dynamically associate with Mdm1‐positive NVJs during times of nutritional transition and LD production.
Figure 5. Mdm1 interacts with FA‐CoA synthases.
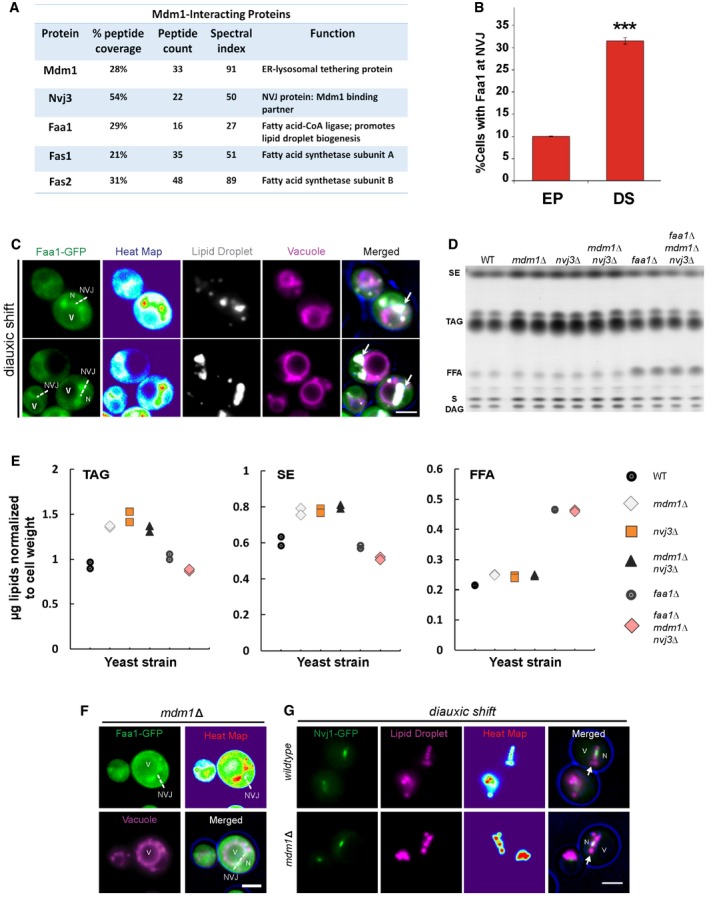
- Major protein interactions with Mdm1‐GFP detected by mass spectrometry proteomics.
- Quantification of cells with Faa1 localized to the NVJ in different growth stages from light microscopy (percentage of cells with Faa1‐GFP at the NVJ over total number of cells counted, mean ± SD, n > 50 cells, ***P < 0.001, Student's t‐test). EP, exponential phase; DS, diauxic shift.
- Light microscopy of Faa1‐GFP showing co‐localization with LDs. Vacuole is labeled with FM4‐64 dye. Dashed lines indicate the NVJ. Arrows indicate LDs. Scale bar, 2 μm. N, nucleus; V, vacuole.
- Neutral lipids TLC. SE, sterol esters; TAG, triacylglycerides; FFA, free fatty acids; S, sterols; DAG, diacylglycerides.
- Quantification of TAG, SE, and FFA in (D) (μg; normalized to cell pellet weight) in WT, mdm1Δ, nvj3Δ, mdm1Δnvj3Δ, faa1Δ, and faa1Δmdm1Δnvj3Δ. Scatter plot legend on the right.
- Light microscopy of mdm1Δ yeast showing recruitment of Faa1‐GFP to the NVJ. Dashed lines indicate the NVJ. Scale bar, 2 μm. N, nucleus; V, vacuole.
- Light microscopy of Nvj1‐GFP yeast with LDs labeled using AutoDOT staining in diauxic shift. Arrows indicate LDs. Scale bar, 2 μm. N, nucleus; V, vacuole.
Mdm1/Nvj3 complex functions downstream of fatty acid activation
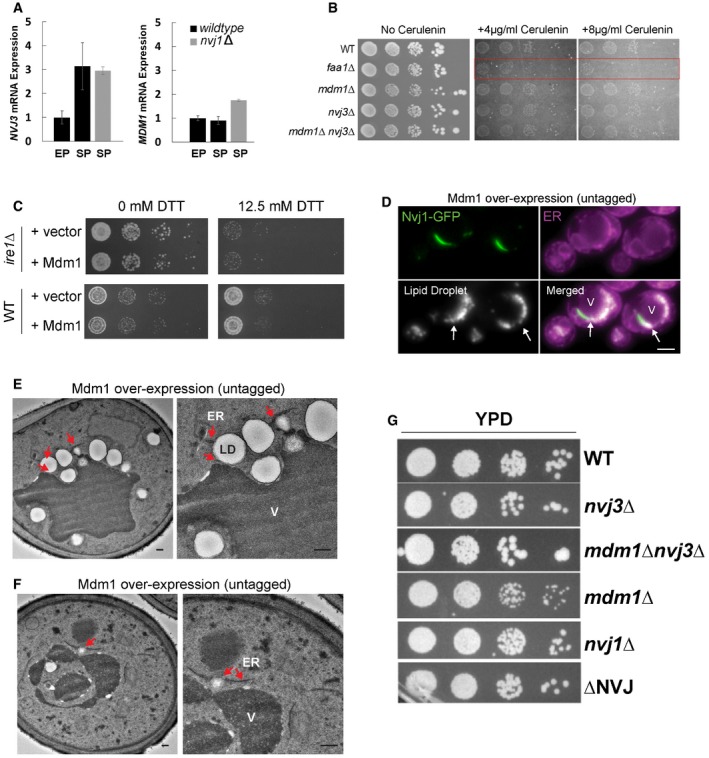
In addition to fatty acid‐processing enzymes, one of the top proteins detected in our Mdm1 interactome analysis was Nvj3, the soluble paralog of Mdm1 and the only other PXA domain‐containing protein in Saccharomyces cerevisiae (Fig 5A). Indeed, we previously demonstrated that Nvj3 co‐localized with Mdm1 at the NVJ, and required Mdm1 for its NVJ localization, suggesting these proteins may function together at this contact site 19. Furthermore, both MDM1 and NVJ3 expression levels were upregulated in nvj1Δ yeast, implying that both may function independently of Nvj1 to perhaps compensate for the loss of Nvj1 ER–vacuole tether (Fig EV4A).
Figure EV4. Mdm1 modulates LD formation at the ER‐vacuole contact sites.
-
AqRT–PCR showing expression levels of Mdm1 and Nvj3 in nvj1Δ yeast cultured in EP and SP (mean ± SEM, n = 3 independent cultures per condition, ***P < 0.001, Student's t‐test). EP, exponential phase; SP, stationary phase.
-
BPlating assay of WT, faa1Δ mdm1Δ, nvj3Δ, and mdm1Δnvj3Δ on plates containing different concentrations of cerulenin.
-
CGrowth assays on DTT‐containing plates for both wild‐type yeast and ire1Δ over‐expressing Mdm1.
-
DLight microscopy of cells over‐expressing untagged Mdm1 show increase LDs that cluster at the NVJ (arrows, visualized by Nvj1‐GFP). Scale bar, 2 μm. V, vacuole.
-
E, FTEM of WT cells over‐expressing untagged Mdm1. Arrows indicate LDs associated with LDs near the vacuole. Scale bar, 0.5 μm. V, vacuole.
-
GPlating assay for yeast lacking different NVJ proteins.
To determine whether, similar to MDM1, loss of NVJ3 would also affect yeast neutral lipid levels, TLC was used to compare the effect of deleting MDM1 and/or NVJ3 on neutral lipids. Indeed, yeast lacking MDM1, NVJ3, or both displayed similar ~1.5‐fold increases in TAG, as well as significant increases in SE (Fig 5D and E).
To investigate the stage of neutral lipid production that was altered due to loss of MDM1 and NVJ3, we generated FAA1‐deficient yeast, and a triple knockout strain lacking MDM1, NVJ3, and FAA1. As expected, faa1Δ yeast displayed increased FFAs compared to WT, consistent with a defect in converting FFAs to fatty acyl‐CoA (Fig 5E). Interestingly, the triple knockout faa1Δmdm1Δnvj3Δ also retained high FFA levels, and suppressed the increased TAGs that were previously observed in the mdm1Δnvj3Δ double knockout, indicating that the TAG increases observed in mdm1Δnvj3Δ yeast require Faa1 function (Fig 5E).
These genetic observations indicated that Mdm1 and Nvj3 may potentially function in neutral lipid metabolism downstream of fatty acid activation into fatty acyl‐CoA. To test this, we plated the knockout yeast on media containing cerulenin, which inhibits the production de novo synthesized fatty acids. As a result, yeast are dependent on Faa1 for the activation of dietary‐derived FFAs, and thus, faa1Δ failed to grow on cerulenin‐containing media (Fig EV4B). In contrast, mdm1Δ, nvj3Δ, and mdm1Δnvj3Δ yeast grow similarly to wild‐type yeast on cerulenin, suggesting that Mdm1 and Nvj3 function downstream of fatty acyl‐CoA production. Consistent with this, Faa1‐GFP can still localize to the NVJ where LDs accumulate even in the absence of MDM1 (Fig 5F and G). Altogether, these observations suggest Mdm1 and Nvj3 function in some aspect of lipid metabolism at the NVJ following fatty acyl‐CoA production.
Mdm1 over‐expression expands the NVJ and increases NVJ‐associated LDs
Thus far, our data indicate a functional coupling of NVJ expansion and LD production. Since Mdm1 appeared associated with NVJ‐associated LDs, we next asked whether NVJ‐associated LD production could be artificially induced by ectopically expanding the NVJ in the absence of nutritional stress.
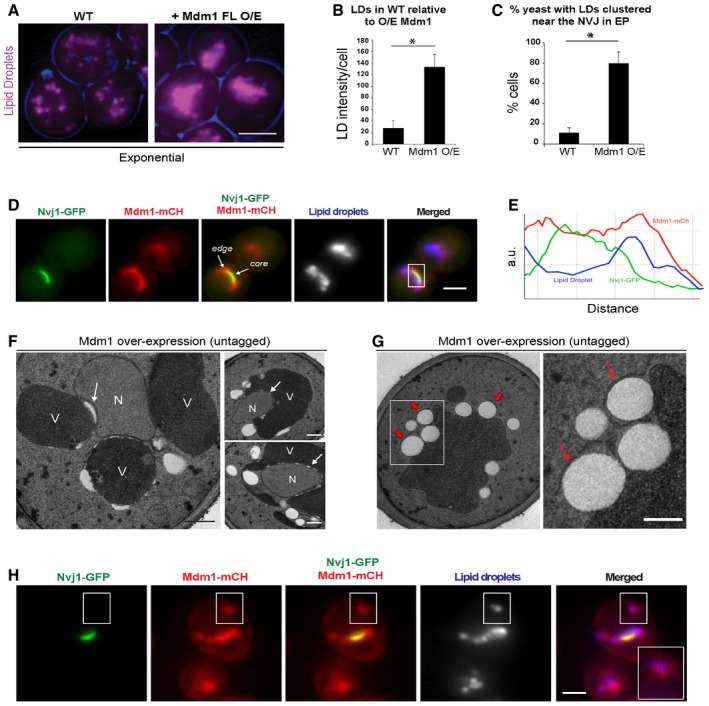
To do this, we ectopically over‐expressed Mdm1‐GFP, a condition previously shown to significantly enlarge the NVJ, and monitored LDs in yeast growing in exponential phase with abundant dextrose and other nutrients 19. We found that Mdm1‐GFP over‐expression caused a ~5‐fold increase in the number of LDs per cell, and the majority of LDs (~80%) were enriched along the ER–vacuole interface even during this nutrient‐rich growth (Fig 6A–C). This increase in LDs was not due to general ER stress from Mdm1 over‐expression, as we observed no increased sensitivity to DTT, nor any growth sensitivity when we over‐expressed Mdm1 in yeast lacking the UPR protein Ire1 (Fig EV4C). Over‐expression of untagged Mdm1 also phenocopied the LD increase along the ER–vacuole interface (Fig EV4D).
Figure 6. NVJ expansion by Mdm1 over‐expression drives LD biogenesis.
-
ALight microscopy for AutoDOT‐labeled LDs in WT yeast and yeast over‐expressing Mdm1. Scale bar, 2 μm.
-
BQuantification using ImageJ of LD intensity per cell from light microscopy imaging in (A) (mean ± SD, n > 50 cells, *P < 0.05, Student's t‐test).
-
CQuantification of LD‐NVJ clustering in WT yeast and yeast over‐expressing Mdm1 (percentage of cells with LD‐NVJ clustering over total number of cells counted, mean ± SD, n > 50 cells, *P < 0.05, Student's t‐test).
-
DLight microscopy for yeast with dual over‐expression of Mdm1‐mCherry and Nvj1‐GFP showing localization of Mdm1‐mCH and Nvj1‐GFP at the edge and core, respectively. White rectangle indicates the NVJ core and edge regions corresponding to line tracing in (E). Scale bar, 2 μm.
-
ELine tracing showing the spatial distribution of Mdm1‐mCH, Nvj1‐GFP, and LDs.
-
F, GTEM of yeast over‐expressing untagged Mdm1. Arrows in (F) indicate aberrant structures. Arrows in (G) indicate LDs wrapped in ER tubules. Scale bar, 0.5 μm. N, nucleus; V, vacuole.
-
HLight microscopy for yeast with dual over‐expression of Mdm1‐mCherry and Nvj1‐GFP. Inset: Co‐localization of Mdm1‐mCH and LDs labeled using AutoDOT. Scale bar, 2 μm.
We next examined how over‐expression of Mdm1, which is normally enriched at the NVJ periphery, would alter the overall architecture of the NVJ. We generated a dual‐tagged yeast expressing Nvj1‐GFP on its native promoter while over‐expressing Mdm1‐mCherry (mCh). Strikingly, over‐expressed Mdm1‐mCh was present throughout the Nvj1‐GFP‐positive NVJ region, and indeed extended beyond Nvj1‐GFP to form an elongated peripheral region in which Nvj1‐GFP was absent (Fig 6D and E). Interestingly, Nvj1‐GFP‐positive NVJ regions appeared to maintain their normal size and shape independent of the Mdm1‐mCh expression level, further suggesting that Nvj1 and Mdm1 may demarcate independent zones at the NVJ (Fig 6D and E). Numerous LDs accumulated at these Mdm1‐mCh‐positive (but Nvj1‐GFP negative) peripheral NVJ zones, reinforcing our previous observations that Mdm1 can regulate LD formation at the NVJ periphery (Fig 6D and E).
To observe this Mdm1‐induced extended NVJ periphery at higher resolution, we conducted thin‐sectioning TEM of yeast over‐expressing Mdm1. Imaging revealed that Mdm1‐over‐expressing yeast contained more LDs (Fig 6F and G). We observed aberrant structures resembling LDs at the interface between the nuclear ER and the vacuole (Fig 6G). ER tubules were often observed wrapping around LDs, further suggesting these LDs were budding from Mdm1‐associated ER tubules (Figs 6F and G, and EV4E and F; arrows). Notably, Mdm1‐GFP‐over‐expressing yeast often contained Mdm1‐GFP foci in non‐NVJ regions of the cell, and these foci co‐localized with LD markers (Fig 6H, inset). These Mdm1‐GFP foci appeared similar to previously observed Mdm1‐mediated ER–vacuole contacts that occur in the absence of NVJ1, and suggest that Mdm1 is able to enrich at sites of LD budding throughout the ER network independent of Nvj1 19.
NVJ‐deficient yeast display defects in fatty acid metabolism
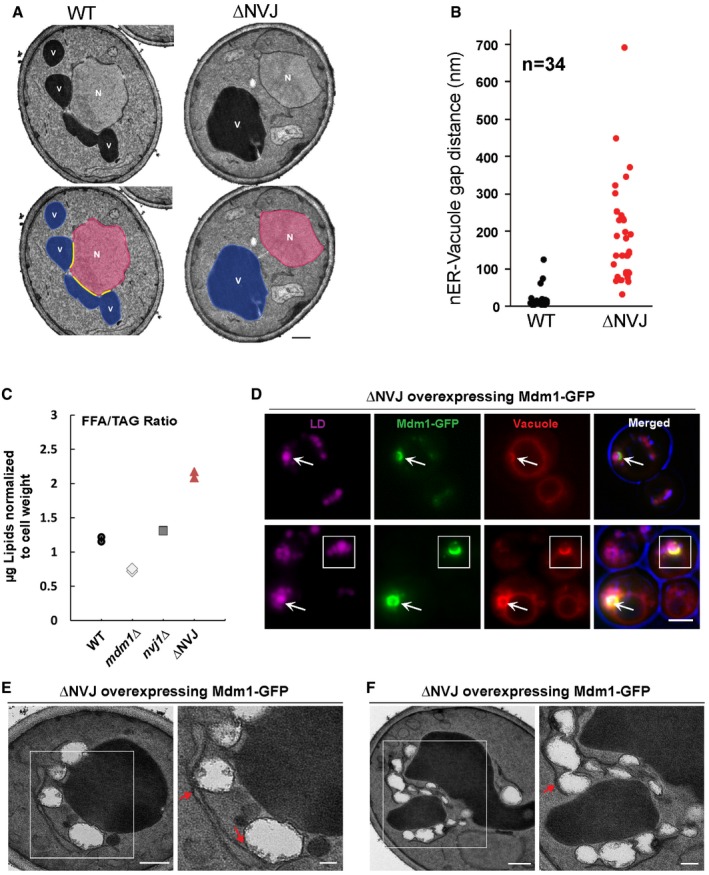
The functional association of NVJs and Mdm1 with LDs suggested that total loss of ER–vacuole tethering may perturb aspects of LD production. To test this, we generated a quadruple knockout yeast strain lacking known NVJ tethering proteins Nvj1 and Mdm1, as well as Nvj2 and Nvj3 that may provide residual ER–vacuole tethering (Fig 7A). This yeast strain, which we refer to as “ΔNVJ”, did not display any growth defects under ambient conditions (Fig EV4G). Using thin‐sectioning TEM, we verified that ΔNVJ yeast display a significant increase in nER–vacuole inter‐organelle distance (average nER–vacuole distance ~189 nm versus ~17 nm in WT, N = 34; Fig 7B).
Figure 7. Mdm1 marks sites for LD accumulation.
-
AElectron micrographs of yeast strain lacking NVJ tethering proteins (ΔNVJ: nvj1Δnvj2Δmdm1Δnvj3Δ). Scale bar, 0.5 μm. N, nucleus; V, vacuole.
-
BQuantification of nER–vacuole distance in ΔNVJ yeast imaged in (A) (n = 34 cells).
-
CQuantification of the ratio of free fatty acid to TAG (normalized to cell pellet weight) in WT, mdm1Δ, nvj1Δ, and ΔNVJ for TLC in Fig EV5A.
-
DLight microscopy for ΔNVJ yeast over‐expressing Mdm1‐GFP. Scale bar, 2 μm. Arrows point to supersized LDs co‐localizing with Mdm1‐GFP. LDs and vacuole are labeled with AutoDOT and FM4‐64 dye, respectively.
-
E, FTEM of ΔNVJ yeast over‐expressing Mdm1 and treated with oleic acid overnight. Arrows indicate ER tubules wrapping LDs near the vacuole. Scale bar, 0.5 μm.
To determine whether loss of the NVJ impacted yeast neutral lipid metabolism and/or LD production, we cultured yeast with exogenous fatty acids (0.5% oleic acid) and conducted TLC analysis. Notably, ΔNVJ yeast displayed altered FFA‐to‐TAG ratios, showing elevated FFAs, and a reduction in TAG levels following incubation with oleic acid (Figs 7C and EV5A and B). This effect was not present in yeast deficient in either NVJ1 or MDM1 alone (Fig 7C).
Figure EV5. Mdm1 marks sites for LD formation.
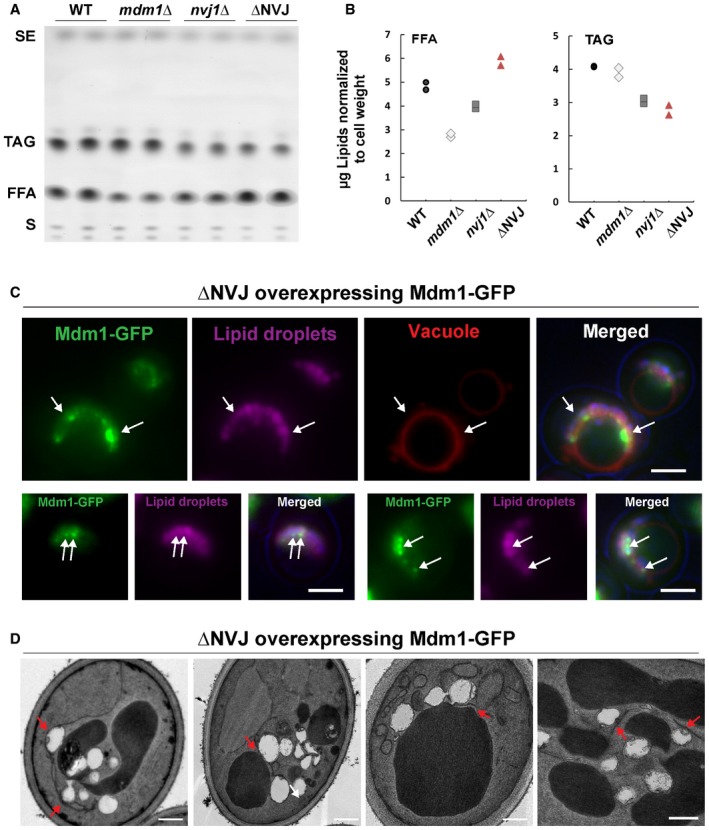
- TLC of neutral lipids for WT and mutant yeast fed oleic acid overnight quantified in Fig 7C. SE, sterol esters; TAG, triacylglycerides; FFA, free fatty acids; S, sterols.
- Quantification of FFA and TAG for TLC in (A). The absolute values here correspond to the ratio graphed in Fig 7C.
- Light microscopy of NVJΔ yeast over‐expressing Mdm1‐GFP. LDs are stained with AutoDOT. Arrows point to co‐localization of LDs and Mdm1‐GFP. Scale bar, 2 μm.
- Electron micrographs of NVJΔ yeast over‐expressing Mdm1‐GFP. Arrows indicate ER wrapping LDs near the vacuole. Scale bar, 0.5 μm.
Next, we investigated whether re‐introduction of Mdm1 alone into this ΔNVJ strain was sufficient to create an ER–vacuole contact site in which LDs would associate. Strikingly, ΔNVJ yeast over‐expressing Mdm1‐GFP displayed Mdm1‐GFP foci along the vacuole surface that appeared to “cup” LDs (Figs 7D and EV5C). Using thin‐sectioning TEM, we confirmed an accumulation of LDs between the vacuole and ER tubular network, with many LDs appearing tightly associated with ER tubules (Figs 7E and F, and EV5D). Collectively, these data indicate that Mdm1 is sufficient to generate a LD‐associated ER–vacuole contact site, and imply that Mdm1‐mediated ER–vacuole contacts may serve as sites of LD biogenesis.
Discussion
How cells respond and adapt to changes in nutrient availability remains a largely unresolved question, yet critical to our understanding of cellular homeostasis and the onset of diseases including cancer and metabolic syndromes. Lipid droplets (LDs) serve as a major nutrient reserve that promotes cell survival in nutritionally challenging conditions, but what determines where LDs bud within the ER network is poorly characterized. Here, we show that yeast ER–vacuole contact sites (NVJs) serve as sites for generating LDs in response to nutritional stress, and identify the ER–vacuole tether Mdm1 as a protein that demarcates sites of NVJ‐associated LD budding. Furthermore, we demonstrate that NVJs expand in response to nutritional stress and show that this expansion is closely coupled with LD production.
Previous genome‐wide microarray studies reported that NVJ1, which encodes the major tethering protein found at the NVJ, is transcriptionally induced in response to nutrient depletion, the physiological significance of which remained unexplored 13, 14. We show that in wild‐type yeast, transcriptional upregulation of NVJ1 is indeed proportional to the physical expansion of the NVJ contact site (Fig 1A–C); however, the increase in NVJ1 mRNA levels alone is not sufficient to expand the NVJ. We found that NVJ expansion is also largely dependent on the ability of yeast to generate LDs, since LD‐deficient yeast exhibit severe defects in NVJ expansion despite the increase in NVJ1 mRNA levels (Fig 2H and I). This underscores a strong functional link between LD biogenesis and NVJ expansion.
In yeast, LDs bud from the ER network, and are thought to remain functionally connected to ER network from which they bud 8. Here, we show substantial accumulation of LDs at the NVJ in yeast undergoing diauxic shift (Fig 2J and K). Indeed, time‐lapse imaging indicates that the NVJ is itself a site of LD biogenesis, as we observe LDs beginning to form at the NVJ following cerulenin washout, which triggers LD production (Figs 3E and EV2B). Although this highlights a role for the NVJ in LD biogenesis, we cannot exclude the possibility that a sub‐population of LDs observed at the NVJ in diauxic shift also come from pre‐existing LDs, which travel to the NVJ following their biogenesis. However, we consider two experiments that provide evidence supporting the notion that the NVJ may itself act as a site of LD biogenesis. The first is that we observe LD budding at the NVJ following cerulenin washout (Fig 3A–E). Second, we demonstrate that ablating the NVJ contact site causes defects in neutral lipid metabolism, manifested by an accumulation of FFAs and an increase in FFA/TAG ratio, implying a role for NVJ contacts in FFA‐to‐TAG conversion (Fig 7C). Collectively, these results suggest that the NVJ itself can serve as a site for LD biogenesis.
Two major tethering proteins reside at the NVJ: Nvj1 and Mdm1 9, 19. Using high‐resolution microscopy, we reveal that Mdm1 enriches preferentially at the periphery of the NVJ, and co‐localizes with LDs there (Fig 4A). Consistent with this, we show that Mdm1 co‐purifies with Faa1 and Fas1/2 in addition to Mdm1 paralog Nvj3 (Fig 5A). Interestingly, while deleting NVJ1 does not have a major effect on yeast neutral lipids content, deleting MDM1, NVJ3, or both causes accumulation of LDs in yeast, and a ~2‐fold increase in TAG, implying a functional role for Mdm1 and Nvj3 in NVJ‐associated LD dynamics (Fig 5D and E). Deletion of Faa1 in addition to Mdm1 and Nvj3 suppresses the increase in TAG we see in the mdm1Δnvj3Δ double knockout (Fig 5E). Collectively, our results are consistent with a role for Mdm1/Nvj3 in LD production following fatty acyl‐CoA activation, and indicate that Mdm1 localizes to ER sites that promote LD budding.
Mdm1 appears to be closely coupled with LD formation both spatially by co‐localizing with LDs and functionally by interacting with fatty acyl‐CoA synthases (Fig 5A). However, we observe increased cytoplasmic LDs in both MDM1‐deficient and Mdm1‐over‐expressing cells. Although ostensibly paradoxical, this increase in LDs may be due to distinct mechanisms driven by modulating Mdm1 expression. Indeed, Mdm1 over‐expression may promote LD production primarily by expanding ER–vacuole contact, which we find is closely coupled with LD budding. Conversely, loss of MDM1 may affect the organization or activity of the fatty acid‐processing enzymes with which it interacts, or even the turnover rate of LDs by lipophagy at the vacuole. As such, dissecting the precise role of Mdm1 in LD dynamics, and how distinct this is from its role as an inter‐organelle tether, will be the focus of future studies.
Taken together, our work reveals a level of spatial organization to LD budding and lipid metabolism in yeast, elegantly localized to ER–vacuole contact sites. Perhaps it is not surprising that this compartmentalization occurs specifically at the junction bridging two major metabolic compartments (the anabolic ER and primarily catabolic vacuole/lysosome). As such, it is conceivable that the formation of LDs near the vacuole is metabolically strategic, and may be advantageous to facilitate their efficient turnover by lipophagy during prolonged starvation 20. Revealing the mechanisms underlying this highly orchestrated event will better define the relationship between inter‐organelle crosstalk and metabolic stress response. In light of these findings, it will now be interesting to explore whether other systems such as metazoan cells can respond similarly to starvation.
Materials and Methods
Molecular biology, yeast genetics, and growth conditions
All yeast strains used in this study are detailed in Appendix Tables S1 and S2. Yeast genetic manipulations were conducted using classical yeast knock‐in/out protocols. For ectopic protein expression, genes were cloned into pBP73‐C or pBP73‐G vectors encoding either the CPY promoter or GPD promoter. Yeast transformations were performed using the lithium acetate method. We used DsRed‐HDEL to label the ER. Strains were selected using antibiotics or dropout selection media. All chemicals used to make the yeast media were purchased from Sigma (succinic acid, sodium hydroxide, ammonium sulfate, yeast nitrogen base without amino acids, or ammonium sulfate). Yeast media was supplemented with a final concentration of 2% dextrose, 2% glycerol, or 2% potassium acetate.
Lipid droplets and vacuole staining
For lipid droplet staining, we used AutoDOT dye (Abgent) added for 15 min. For vacuole staining, we incubated with CellTracker blue CMAC dye (Thermo Fischer) for 10 min to stain the vacuole lumen, and FM4‐64 was added for 45 min to an hour to stain the vacuole surface. Dyes were added to cell pellets that were washed and resuspended in a small volume of media with no added carbon source. Yeast cells were then pelleted, washed, and imaged.
Light microscopy
Imaging of live yeast cultures was performed using EVOS FL Cell Imaging System at room temperature. Yeast cells were grown to the desired OD600 in the different growth condition. Before imaging, cells were pelleted (3,000 g for 5 min at room temperature), washed, and resuspended in a small volume of media without a carbon source. Then, 3 μl of the dense yeast suspension was transferred to a glass slide for imaging. Image analysis was performed using Fiji (ImageJ).
Structured illumination microscopy
Living yeast were imaged on a Deltavision OMX SR 3D structured illumination microscope (SIM) equipped with a 60× 1.42 NA objective lens and three cameras (GE Healthcare). Prior to imaging, yeast were cultured in complete media supplemented with 2% dextrose, briefly centrifuged, and embedded in low‐melting temperature agar on 35‐mm glass‐bottom cover‐slip dishes (MatTek Corporation).
Fluorescence image quantification
To quantify lipid droplet abundance, cells were stained with AutoDOT and imaged. AutoDOT was converted into a binary signal, and the total signal per yeast cell quantified in an automated fashion by the Trainable Weka Segmentation program suite available in ImageJ/Fiji (The University of Waikato, New Zealand). To calculate average NVJ lengths, Nvj1‐GFP yeast were imaged and Nvj1‐GFP concerted into a binary signal. Briefly, color images were converted to 32‐bit, and segmentation was performed using Trainable Weka Segmentation program suite (The University of Waikato, New Zealand) to extract features and create a binary image. The size of image features was measured using a line tool and Measure function in Fiji. Lipid droplet clustering measurements were done manually.
Time‐lapse imaging
Yeast pre‐cultures were inoculated in SC‐dextrose media. Cerulenin was added at a final concentration of 20 μg/ml, and yeast were grown overnight. Cells were then exchanged into fresh SC‐dextrose media containing AutoDOT stain, and imaged post‐cerulenin washout (t i) at 10‐min intervals.
Electron microscopy
Yeast cells were grown in the desired conditions and processed in the UT Southwestern Electron Microscopy Core Facility using a protocol adapted from 21. In brief, cells were fixed in potassium permanganate, dehydrated, and stained in uranylacetate. Yeast were embedded and sectioned using Leica EM UC6. Sections (~60 nm thick) were placed on copper grids and imaged using Tecani Spirit TEM (FEI) at 120 kV using a CCD camera.
Immuno‐precipitation
Yeast cells were collected at diauxic shift and washed with 0.1 M Tris pH 0.8 supplemented with 5 mM DTT. Cells were lysed using lysis buffer (50 mM Tris, 200 mM sorbitol, 15 mM EDTA) supplemented with 1 μl zymolase (10 mg/ml). Cells were incubated for 30 min at room temperature with gentle rocking. Protease inhibitor cocktails and 0.3% NP‐40 were added to the suspension. Cells were subjected to homogenization using a Dounce homogenizer (20×) on ice to break the cells. Cell suspension was incubated with anti‐GFP beads at 4°C for at least 1 h. Beads were washed 3× with lysis buffer and then mixed with urea sample buffer for 5 min. The supernatant was collected and the proteins were precipitated using 10% TCA. The white protein pellet was washed 2× with ice‐cold acetone and resuspended in sample buffer. From the final suspension, 5 μl was used to run a diagnostic analysis and the rest were ran separately for gel digestion and mass spectrometry.
Interaction proteomics
Protein gel pieces were digested overnight with trypsin (Pierce) following reduction and alkylation with DTT and iodoacetamide (Sigma‐Aldrich). The samples then underwent solid‐phase extraction cleanup with Oasis HLB plates (Waters), and the resulting samples were analyzed by LC/MS/MS, using a Q Exactive mass spectrometer (Thermo Electron) coupled to an Ultimate 3000 RSLC‐Nano liquid chromatography systems (Dionex). Samples were injected onto a 180 μm i.d., 15‐cm‐long column packed in‐house with a reverse‐phase material ReproSil‐Pur C18‐AQ, 3‐μm resin (Dr. Maisch GmbH, Ammerbuch‐Entringen, Germany), and eluted with a gradient from 1 to 28% buffer B over 40 min. Buffer A contained 2% (v/v) ACN and 0.1% formic acid in water, and buffer B contained 80% (v/v) ACN, 10% (v/v) trifluoroethanol, and 0.08% formic acid in water. The mass spectrometer operated in positive ion mode with a source voltage of 2.4 kV, capillary temperature of 250°C, and S‐lens RF level at 50.0%. MS scans were acquired at 70,000 resolution and up to 20 MS/MS spectra were obtained for each full spectrum acquired at 17,500 resolution using higher‐energy collisional dissociation (HCD) for ions with charge ≥2. Dynamic exclusion was set for 7 s. Raw MS data files were converted to a peak list format and analyzed using the central proteomics facilities pipeline (CPFP), version 2.0.3 22, 23. Peptide identification was performed using the X!Tandem and open MS search algorithm (OMSSA) search engines against the Saccharomyces cerevisiae protein database from Uniprot, with common contaminants and reversed decoy sequences appended 24, 25, 26. Fragment and precursor tolerances of 20 ppm and 0.1 Da were specified, and three missed cleavages were allowed. Carbamidomethylation of Cys was set as a fixed modification, and oxidation of Met was set as a variable modification. Label‐free quantitation of proteins across samples was performed using SINQ normalized spectral index Software.
Neutral lipid analysis
Yeast cells were grown in the desired conditions and pelleted. Neutral lipids were extracted according to a modified protocol from 27. Neutral lipids were extracted from whole cells using chloroform/methanol method modified from Bligh and Dyer 27. After measuring the wet cell weight, pellets were lysed using glass bead‐beating for 10 min in the presence of chloroform. All steps were performed in the cold room. Methanol was added and the suspension was vortexed vigorously. Then, 500 mM NaCl prepared in 0.5% acetic acid was added to get the final concentration of chloroform:methanol:water to 2:2:1.8. Samples were spun at 1,500 g for 15 min in the cold room and the bottom chloroform was recovered. The volume was recorded and lipid was dried. Dried lipids were resuspended in chloroform to a final concentration normalized to the initial cell pellet weight (0.5 μl chloroform per 1 mg cell weight). One‐dimensional thin‐layer chromatography was used to separate the extracted lipids using hexane:diethyl ether:acetic acid (80:20:1) as a solvent to separate neutral lipids. TLC plates were spray‐stained with 3% copper acetate prepared in 8% phosphoric acid. Stained plates were incubated in the oven at 145°C for 1 h to overnight to develop the bands. Plates were resprayed and reheated as needed to visualize lipids. Where indicated, yeast culture were diluted to OD600 of 0.2, grown for 3 h in complete media supplemented with 2% dextrose. After 3 h, 1% oleic acid was added overnight. After ~14 h of treatment, cells were collected and prepared for lipid extraction.
TLC quantification
Stained TLC plates were scanned and then processed for quantification using Fiji (ImageJ). On each plate, we ran a serial dilution of standard neutral lipid mix of known concentration. The standard mixture was prepared in chloroform to a final concentration of 10 mg/ml. The standard mixture (1:10) was used to create a standard curve where the x‐axis displayed the calculated lipid mass in μg and the y‐axis displayed the band intensity estimated using Fiji (ImageJ).
RNA extraction
We homogenized yeast pellets using glass bead‐beating for 10 min at 4°C in the presence of TRIzol. Then, chloroform was added to each tube with continuous vigorous shaking for 15 s. The suspension was incubated at room temperature for 3 min and then centrifuged at 12,000 g for 15 min at 4°C. The colorless upper aqueous was carefully transferred to a new tube. Then, isopropanol was added to the aqueous phase and the suspension was mixed by tilting the tube 3–4 times, and incubated at room temperature for 10 min and then centrifuged at 12,000 g for 10 min at 4°C. The supernatant was discarded leaving behind the RNA pellet. The pellet was washed with 1 ml of 75% ethanol, vortexed briefly to dislodge the pellet, and then centrifuged at 7,500 g at 4°C. The supernatant was discarded and the pellet was left to air‐dry for 5–10 min, resuspended in 20–50 μl of RNase DEPC‐free water, and incubated in hotplate for 10 min. RNA concentration was measured using Nano Spectrophotometer. To make cDNA from RNA, we used commercial kit from Bio‐Rad (iScript cDNA Synthesis kit #1708891). Thermocycler program used was as follows: 25°C for 10 min, 37°C for 120 min, 85°C for 5 min, 4°C.
Stress screen
Pharmacological agents were added to yeast at a desired OD600 for 3 h after which the cells were pelleted, washed, and imaged. The final concentrations used were as follows: cerulenin (45 μM), terbinafine (10 μg/ml), dinitrophenol (0.5 mM), tunicamycin (2 μg/ml), DTT (2 mM), rapamycin (100 nm).
Yeast plating assays
Yeast were grown in selective media (‐URA). Prior to plating, cells were diluted to an OD600 of ~0.3, and then, 10× dilutions were made in 96‐well plates and replica pinned on agar plates with or without 12.5 mM DTT. Cells were imaged during 4‐day growth.
Author contributions
Conception and design of the study, data acquisition, analysis and interpretation of data, and drafting and revising the article: HH, WMH; Thin‐layer chromatography: HH; Stress screen data acquisition and analysis: SR; Transcript levels by qRT–PCR: RU, SR; Immuno‐precipitation: YLL; Technical assistance: JRF.
Conflict of interest
The authors declare that they have no conflict of interest.
Supporting information
Appendix
Expanded View Figures PDF
Movie EV1
Movie EV2
Review Process File
Acknowledgements
We thank Sandra Schmid, Joel Goodman, and Maralice Conacci‐Sorrell for helpful discussion and critical reading of the manuscript. We are grateful for Maya Schuldiner for sharing the yeast GFP collection. We thank Kate Luby‐Phelps and the UTSW Electron Microscopy Core Facility, and Andrew Lemoff and the UTSW Proteomics Core for expert technical assistance. Jade Bowerman and Piya Kositangool are acknowledged for technical assistance. W.M.H. is supported by grants from the Welch Foundation (I‐1873), the Searle Foundation (SSP‐2016‐1482), the NIH NIGMS (GM119768), AFAR (A15198), and the UT Southwestern Endowed Scholars Program.
EMBO Reports (2018) 19: 57–72
References
- 1. Kohlwein SD, Veenhuis M, van der Klei IJ (2013) Lipid droplets and peroxisomes: key players in cellular lipid homeostasis or a matter of fat—Store ‘Em up or burn ‘Em Down. Genetics 193: 1–50 [DOI] [PMC free article] [PubMed] [Google Scholar]
- 2. Athenstaedt K, Daum G (2006) The life cycle of neutral lipids: synthesis, storage and degradation. Cell Mol Life Sci 63: 1355–1369 [DOI] [PMC free article] [PubMed] [Google Scholar]
- 3. Walther TC, Farese RV (2009) The life of lipid droplets. Biochim Biophys Acta 1791: 459–466 [DOI] [PMC free article] [PubMed] [Google Scholar]
- 4. Kassan A, Herms A, Fernández‐Vidal A, Bosch M, Schieber NL, Reddy BJN, Fajardo A, Gelabert‐Baldrich M, Tebar F, Enrich C et al (2013) Acyl‐CoA synthetase 3 promotes lipid droplet biogenesis in ER microdomains. J Cell Biol 203: 985–1001 [DOI] [PMC free article] [PubMed] [Google Scholar]
- 5. Phillips MJ, Voeltz GK (2016) Structure and function of ER membrane contact sites with other organelles. Nat Rev Mol Cell Biol 17: 69–82 [DOI] [PMC free article] [PubMed] [Google Scholar]
- 6. Stefan CJ, Manford AG, Emr SD (2013) ER‐PM connections: sites of information transfer and inter‐organelle communication. Curr Opin Cell Biol 25: 434–442 [DOI] [PMC free article] [PubMed] [Google Scholar]
- 7. Elbaz‐Alon Y, Rosenfeld‐Gur E, Shinder V, Futerman AH, Geiger T, Schuldiner M (2014) A dynamic interface between vacuoles and mitochondria in yeast. Dev Cell 30: 95–102 [DOI] [PubMed] [Google Scholar]
- 8. Jacquier N, Choudhary V, Mari M, Toulmay A, Reggiori F, Schneiter R (2011) Lipid droplets are functionally connected to the endoplasmic reticulum in Saccharomyces cerevisiae . J Cell Sci 124: 2424–2437 [DOI] [PubMed] [Google Scholar]
- 9. Pan X, Roberts P, Chen Y, Kvam E, Shulga N, Huang K, Lemmon S, Goldfarb DS (2000) Nucleus‐vacuole junctions in Saccharomyces cerevisiae are formed through the direct interaction of Vac8p with Nvj1p. Mol Biol Cell 11: 2445–2457 [DOI] [PMC free article] [PubMed] [Google Scholar]
- 10. Hariri H, Ugrankar R, Liu Y, Henne WM (2016) Inter‐organelle ER‐endolysosomal contact sites in metabolism and disease across evolution. Commun Integr Biol 9: e1156278 [DOI] [PMC free article] [PubMed] [Google Scholar]
- 11. Toulmay A, Prinz WA (2012) A conserved membrane‐binding domain targets proteins to organelle contact sites. J Cell Sci 125: 49–58 [DOI] [PMC free article] [PubMed] [Google Scholar]
- 12. Lang AB, Peter ATJ, Walter P, Kornmann B (2015) ER–mitochondrial junctions can be bypassed by dominant mutations in the endosomal protein Vps13. J Cell Biol 210: 883–890 [DOI] [PMC free article] [PubMed] [Google Scholar]
- 13. Gasch AP, Spellman PT, Kao CM, Carmel‐Harel O, Eisen MB, Storz G, Botstein D, Brown PO (2000) Genomic expression programs in the response of yeast cells to environmental changes. Mol Biol Cell 11: 4241–4257 [DOI] [PMC free article] [PubMed] [Google Scholar]
- 14. DeRisi JL, Iyer VR, Brown PO (1997) Exploring the metabolic and genetic control of gene expression on a genomic scale. Science 278: 680–686 [DOI] [PubMed] [Google Scholar]
- 15. Wolinski H, Kolb D, Hermann S, Koning RI, Kohlwein SD (2011) A role for seipin in lipid droplet dynamics and inheritance in yeast. J Cell Sci 124: 3894–3904 [DOI] [PubMed] [Google Scholar]
- 16. Barbosa AD, Sembongi H, Su W‐M, Abreu S, Reggiori F, Carman GM, Siniossoglou S (2015) Lipid partitioning at the nuclear envelope controls membrane biogenesis. Mol Biol Cell 26: 3641–3657 [DOI] [PMC free article] [PubMed] [Google Scholar]
- 17. Sandager L, Gustavsson MH, Ståhl U, Dahlqvist A, Wiberg E, Banas A, Lenman M, Ronne H, Stymne S (2002) Storage lipid synthesis is non‐essential in yeast. J Biol Chem 277: 6478–6482 [DOI] [PubMed] [Google Scholar]
- 18. Choudhary V, Ojha N, Golden A, Prinz WA (2015) A conserved family of proteins facilitates nascent lipid droplet budding from the ER. J Cell Biol 211: 261–271 [DOI] [PMC free article] [PubMed] [Google Scholar]
- 19. Henne WM, Zhu L, Balogi Z, Stefan C, Pleiss JA, Emr SD (2015) Mdm1/Snx13 is a novel ER–endolysosomal interorganelle tethering protein. J Cell Biol 210: 541–551 [DOI] [PMC free article] [PubMed] [Google Scholar]
- 20. Wang C‐W, Miao Y‐H, Chang Y‐S (2014) A sterol‐enriched vacuolar microdomain mediates stationary phase lipophagy in budding yeast. J Cell Biol 206: 357–366 [DOI] [PMC free article] [PubMed] [Google Scholar]
- 21. Wright R (2000) Transmission electron microscopy of yeast. Microsc Res Tech 51: 496–510 [DOI] [PubMed] [Google Scholar]
- 22. Trudgian DC, Mirzaei H (2012) Cloud CPFP: a shotgun proteomics data analysis pipeline using cloud and high performance computing. J Proteome Res 11: 6282–6290 [DOI] [PubMed] [Google Scholar]
- 23. Trudgian DC, Thomas B, McGowan SJ, Kessler BM, Salek M, Acuto O (2010) CPFP: a central proteomics facilities pipeline. Bioinformatics 26: 1131–1132 [DOI] [PubMed] [Google Scholar]
- 24. Craig R, Beavis RC (2004) TANDEM: matching proteins with tandem mass spectra. Bioinformatics 20: 1466–1467 [DOI] [PubMed] [Google Scholar]
- 25. Elias JE, Gygi SP (2007) Target‐decoy search strategy for increased confidence in large‐scale protein identifications by mass spectrometry. Nat Methods 4: 207–214 [DOI] [PubMed] [Google Scholar]
- 26. Geer LY, Markey SP, Kowalak JA, Wagner L, Xu M, Maynard DM, Yang X, Shi W, Bryant SH (2004) Open mass spectrometry search algorithm. J Proteome Res 3: 958–964 [DOI] [PubMed] [Google Scholar]
- 27. Bligh EG, Dyer WJ (1959) A rapid method of total lipid extraction and purification. Can J Biochem Physiol 37: 911–917 [DOI] [PubMed] [Google Scholar]
Associated Data
This section collects any data citations, data availability statements, or supplementary materials included in this article.
Supplementary Materials
Appendix
Expanded View Figures PDF
Movie EV1
Movie EV2
Review Process File


