

Abstract
Context:
Quantitative standardization of plant-based products is challenging albeit essential to maintain their quality.
Aims:
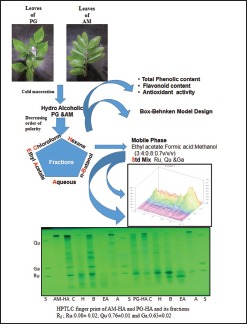
This study aims to develop and validate high-performance thin-layer chromatography (HPTLC) method for the simultaneous determination of rutin (Ru), quercetin (Qu), and gallic acid (Ga) from Psidium guajava Linn. (PG) and Aegle marmelos (L.) Correa. (AM) and correlate with antioxidant activity.
Materials and Methods:
The stock solution (1 mg/mL) of standard Ru, Qu, and Ga in methanol: Water (1:1) was serially diluted and spotted (5 μL) on slica gel 60 F254 thin-layer chromatography plates. Toluene: Ethyl acetate: Formic acid: Methanol (3:4:0.8:0.7, v/v/v) was selected as mobile phase for analysis at 254 nm. Hydroalcoholic (1:1) extracts of leaves of PG and AM were fractionated and similarly analyzed. Antioxidant activity was also determined using 2, 2-diphenyl-1-picrylhydrazyl assay.
Results:
The developed method was robust and resolved Ru, Qu, and Ga at Rf 0.08 ± 0.02, 0.76 ± 0.01, and 0.63 ± 0.02, respectively. The intra-day, interday precision, and interanalyst were <2% relative standard deviation. The limit of detection and limit of quantification for Ru, Qu, and Ga were 4.51, 4.2, 5.27, and 13.67, 12.73, 15.98 ng/spot, respectively. Antioxidant activity (Log 50% inhibition) of PG and AM was 4.947 ± 0.322 and 6.498 ± 0.295, respectively.
Conclusion:
The developed HPTLC method was rapid, accurate, precise, reproducible, and specific for the simultaneous estimation of Ru, Qu, and Ga.
SUMMARY
HPTLC method for simultaneous determination and quantification of Rutin, Quercetin and Gallic acid, is reported for quality control of herbal drugs.
Abbreviations Used: A: Aqueous fraction; AM: Aegle marmelos L. Correa; B: Butanol fraction; C: Chloroform fraction; EA: Ethyl acetate fraction; Ga: Gallic acid; H: Hexane fraction; HA: Hydroalcoholic extract; HPTLC: High-performance thin-layer chromatography; PG: Psidium guajava; Qu: Quercetin; Ru: Rutin.
Keywords: Aegle marmelos, gallic acid, high-performance thin-layer chromatography, Psidium guajava, quercetin, rutin
INTRODUCTION
Polyphenols in the form of lignans, flavonoids, stilbene, isoflavones, and phenolic acid derivatives are secondary metabolites of plants that have one or more hydroxylated aromatic rings with the strong reducing property. In plants, they provide defense against biotic and abiotic stress conditions, such as ultraviolet radiation, free radicals, pathogens, etc. Diet rich in polyphenols (fruits, wine, and vegetables) has also been implicated in preventive and therapeutic actions against many pathologies such as metabolic syndrome, cardiovascular diseases, inflammation, diabetes, and cancer.
Quercetin (Qu) (3,3’,4’,5,7-pentahydroxyflavone) a common flavonol, is present as a glycoside in high concentration in fruits and vegetables such as apples, berries, onions, and capers. Qu accounts for nearly 50% of the dietary intake of all flavonols, with a daily intake of about 10–20 mg/day.[1] It is attributed to numerous biological activities that arise from its ability to stimulate cellular defenses.[2,3] Rutin (Ru), chemically Qu -3-rutinoside, was first isolated from buckwheat. It is one of the most widespread of all Qu glycosides and probably occurs in up to 25% of any given local flora. It has a wide spectrum of pharmacological benefits such as antimicrobial, antifungal, antiallergic, anticancer, antidiabetic, and antihypertensive agent.[4] Gallic acid (Ga) (3,4,5 trihydroxybenzoic acid), a natural plant triphenol, occurs widely in vascular plants. It can effectively cross-link with proteins, and this property protects plants against herbivores. Ga is being developed for its free radical scavenging and antitumor properties.[5]
Psidium guajava Linn (PG, Fam: Myrtaceae) is a plant with an enormous medicinal value. Its traditional use as anti-inflammatory, antimicrobial, antioxidant, antidiarrheal, and antimutagenic plant has also been corroborated by pharmacological studies.[6,7] The leaves of PG contain phenols isoflavonoids, Ga, Ru, and Qu.[8] Another important medicinal plant of India is Bael (Aegle marmelos L. Correa. [AM], Fam: Rutaceae). It has been used in ethno medicine as astringent, antidiarrheal, antidysenteric, demulcent, antipyretic, and anti-inflammatory agent.[9,10] AM is a good source of phenolic and flavonoid metabolites which are having antioxidant potential.[11,12]
Qualitative and quantitative analysis of a mixture of phytochemicals is one of the biggest challenges faced by a natural chemist. Although the availability of advanced techniques such as 13C NMR, 1H NMR, mass spectrometry, capillary electrophoresis, and HPLC have helped to make deep inroads into the accurate determination of the complex structure and mlar weight of phytochemicals, there still remain numerous lacunae. Besides, the prohibitive cost of these sophisticated techniques, there is also a prerequisite of high analytical skills for sample and data handling that together render them unsuitable as techniques of choice for routine analysis.
Keeping in view the widespread use of plant-based products for their therapeutic and preventive action in disease and health, it has become essential to standardize them and ensure their quality, so that they are fit for public consumption. For routine qualitative and quantitative assessment and standardization of phytochemical-based products, high-performance thin-layer chromatography (HPTLC) has emerged as a cheap, fast, reproducible, economic, simple, and accurate technique that is finding wide acceptance.
HPLC method for the determination of two compounds – Ru and Qu is already reported in the literature.[13] Here, we report HPTLC-based method for the simultaneous determination of three polyphenolic compounds – Ru, Qu, and Ga. The method has been validated as per the ICH guidelines and is suitable for application for the standardization of plant-based products.[14]
MATERIALS AND METHODS
Standards and chemicals
All chemicals and reagents were of AR grade. Methanol and aluminum-backed TLC plates precoated with 0.2 mm layer of silica gel 60 F254 (20 cm × 10 cm) were purchased from E. Merck (Germany). All standard drugs (Ru trihydrate, Qu, Ga monohydrate) of purity >98% were purchased from Sigma-Aldrich, USA.
Plant collection and identification
Fresh leaves of PG and AM were locally collected and were identified and authenticated by Principal Scientist at the Indian Council of Agricultural Research, New Delhi, India, with a voucher specimen (NHCP/NBPGR/2014-6, 7) that was deposited in the herbarium.
Sample preparation
The fresh leaves of PG were washed, shade dried, and powdered. The leaf powder (500 g) was exhaustively extracted with Ethanol: Water (1:1, v/v) by cold maceration. The extract was filtered, and the filtrate was evaporated to dryness under reduced pressure. The concentrated hydroalcoholic mother extract (PG-HA) was further fractionated sequentially using organic solvents in decreasing order of polarity, i.e., n-hexane, chloroform, ethyl acetate, n-butanol to provide PG-H, PG-C, PG-EA, and PG-B fractions, respectively. The aqueous phase from all steps of partitioning was pooled as an aqueous fraction (PG-A).
Fresh leaves of AM were similarly, processed, and concentrated to yield hydroalcoholic extract (AM-HA) and n-hexane (AM-H), chloroform (AM-C), ethyl acetate (AM-EA), n-butanol (AM-B), and aqueous (AM-A) fractions, respectively. The fractions were concentrated under reduced pressure and % yield was calculated from the weight of dry leaves. All extracts and fractions were clearly labeled and stored at 4°C in an amber-colored container until analysis.
Standard preparation
A stock solution (1 mg/mL) of each standard drug (Qu, Ru, and Ga) was prepared by dissolving 10 mg of accurately weighed drug in methanol and water (1:1, v/v) and diluted to 10 mL in the standard volumetric flask. Working solution was prepared by mixing each stock solution such that the final concentration of each drug was 333.33 ng/mL. The working solution was filtered through a 0.45 μm membrane filter (Millipore, USA) before application on a TLC plate.
High-performance thin-layer chromatography instrumentation and conditions
The sample and standards were separately spotted as bands of width 5 mm with Camag microliter syringe on precoated silica gel aluminum plate 60 F254 (20 cm × 10 cm with 0.2 mm thickness), using a Camag Linomat-V applicator (Camag, Switzerland). The input instructions regarding slit dimension (4 mm × 0.45 mm) and scanning speed (20 mm/s) were defined using win-CAT-V 1.2.3 software (Camag, Switzerland). The mobile phase consisted of toluene: ethyl acetate: formic acid: methanol (3:4:0.8:0.7, v/v/v). The plates were developed up to 85% of total TLC plate height in a horizontal Camag twin trough glass chamber (10 cm × 20 cm) which was saturated with the mobile phase (10 mL in each side) for 30 min at RT and relative humidity 60%. The TLC plate was dried in current air with the help of an air dryer. The densitometric scanning was performed using Camag TLC scanner of III in the absorbance mode at 254 nm using deuterium lamp source.
Validation of the proposed method
The proposed method was validated as per ICH guidelines.
Linearity and calibration plot
A standard linearity was prepared with a specific range to get test results in direct proportion to the concertation of the bio-analyte. Different volumes of standard solution were spotted on the TLC plate in triplicate (0.1–10 μL) to make the concentration of 33.33–1666.66 ng/spot for Qu, Ru, and Ga.
Accuracy (% recovery)
The accuracy of the method was determined by calculating recovery of the standard drugs (Qu, Ru, and Ga) using the standard addition method. A known amount of standard solutions (Qu, Ru, and Ga) were added at 50, 100, and 150% of analyte in analyzed samples and estimated.
Precision
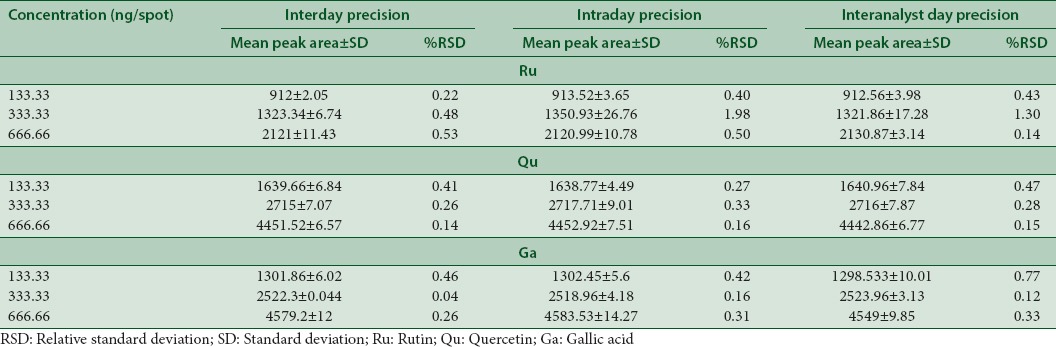
The precision of the system was determined by measuring repeatability of the sample application and measurement of peak areas for six replicates of each of the three concentrations (133.33, 333.33 and 666.66 ng/spot) for Qu, Ru, and Ga mixture under same prescribed conditions using interday, intraday, and interanalyst methods. The precision of the method was calculated and expressed as relative standard deviation (RSD %).
Robustness of the method
In the present study, the robustness of the method was evaluated using the Box–Behnken response surface design. Design Expert 10.0 software (State-Ease. Inc., Minneapolis MN, USA) was used to evaluate the result. Three-dimensional graphs represented peak area dependence on the solvent system. Effects of the selected factors were evaluated over a range of conditions by determining the maximum area response of the standard drugs.
The design simultaneously evaluated the effect of a change in the analytical parameters on peak area of the standard drugs. Robustness of the proposed method was performed by introducing very slight changes in the methodology at the same concentration such as changing wavelength, saturation time, and the composition of the mobile phase. The method robustness was calculated as %RSD and provided a measure of its capacity to remain deliberate.
Limit of detection and limit of quantification
The limit of detection (LOD) and limit of quantification (LOQ) were determined by the blank determination method. Blank methanol was spotted six times, and the area estimated for determining the LOD, LOQ, and signal-to-noise ratio, as per the following formulae - LOD = 3.3 × σ/S and LOQ = 10 × σ/S, where, σ is standard deviation of y-intercepts and S is the slope of the regression line of calibration curve.
Plant analysis
Phytochemical screening
The phytochemical investigation of different extracts of PG and AM was carried out using standard protocols.[15]
1,1-Diphenyl-2-picrylhydrazyl radical-scavenging assay
The antioxidant activity of the extracts, and fractions was assessed using the 1,1-diphenyl-2-picrylhydrazyl assay (DPPH) by following a protocol that was a slight modification of the one proposed by Singh et al.[16] Briefly, extract or fraction (1–4 mg/mL, 300 μL), DPPH (0.1 mM, 2 mL), and Trolox (20–1000 μM) were mixed and kept undisturbed at room temperature for 30 min. The absorbance of the mixture was measured at 517 nm against the blank to prepare the standard calibration curve. The decrease in the absorbance indicated an increase in DPPH radical scavenging activity. This percent scavenging activity was calculated using the formula-DPPH scavenging effect (%) = ([A0 − A1]/A0 × 100), where A0 is the absorbance of the control reaction, and A1 is the absorbance in the presence of the standard.
The graph was plotted for inhibition (%) against sample concentration, and the concentration of the sample that provided 50% inhibition (IC50) was read from the graph.
Estimation of total phenolic and flavonoid content
Total phenolic and flavonoid content were estimated as per reported method.[17] Total phenolic content (%) and flavonoid content in the sample were measured using calibration curve of standards Ga and Ru at 765 and 415 nm, respectively.
Sample preparation for high-performance thin-layer chromatography
Hydroalcoholic extracts and their fractions were dissolved in a methanol-water mixture (1:1), vortexed, and sonicated for 20 min at room temperature to prepare the stock solution (50 μg/mL). The solutions were filtered through a sterile membrane filter (0.45 μm, Millipore, USA) before application (5 μL) on TLC plate.
Determination of quercetin, rutin, and gallic acid in Aegle marmelos and Psidium guajava
Each sample (5 μL) was spotted in triplicate on TLC plates. The plates were developed and scanned as per the method detailed in the above sections. The peaks corresponding to Qu, Ru, and Ga were used for their quantification in the sample, using the regression equation. The amount was expressed as an average concentration with standard deviation.
RESULTS AND DISCUSSION
Flavonoids are the present day panacea as they are established to exert protective action in oxidative stress-related pathologies, such as cardiovascular diseases, cancer, and a variety of neurodegenerative disorders.[18] Ru, Qu, and Ga are some of the most important flavonoids that are present in wide variety of medicinal plants including PG and AM and possess a wide variety of pharmacological actions.[19]
Phytochemical analysis and fingerprinting are an important step toward plant identification and detection of impurities.[20] HPTLC is consistently employed for fingerprinting of plant extracts and fractions as it can successfully separate different constituents to provide useful qualitative and quantitative data that are reliable, accurate, and economic for various applications including quality control and standardization of food and marketed herbal formulations.[21,22]
The mother extracts and its fractions were calculated for its percentage yield. Percentage yield of extract and fractions has been shown in Table 2.
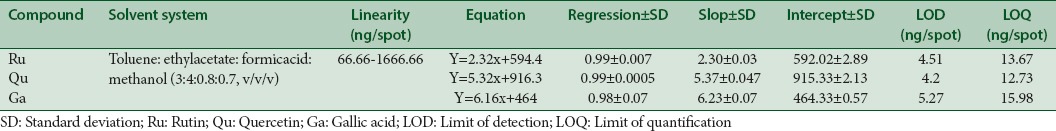
Table 2.
Linearity data of developed high-performance thin-layer chromatography method for simultaneous separation of rutin, quercetin, and gallic acid
PG-HA and AM-HA tested positive for alkaloids, tannins, carbohydrate, and cardiac glycosides but not for proteins. In addition, AM-H but not PG-HA tested positive for anthraquinone glycosides. The compounds (Ru, Qu, and Ga) were estimated in samples using regression equations from the calibration plot and expressed as ng/mL [Table 1].
Table 1.
Total phenolic content, flavonoid content, antioxidant activity and rutin, quercetin and gallic acid content in Psidium guajava Linn.-hydro alcoholic extract and Aegle marmelos (L.) Correa-hydroalcoholic extract and their fractions
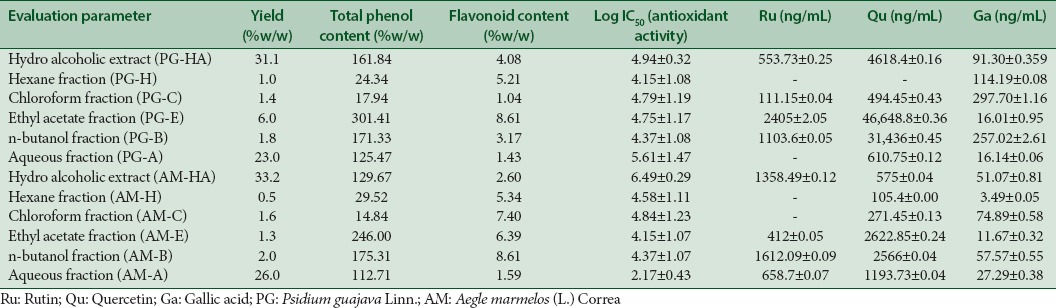
Total phenolic content was calculated from the calibration curve (R2 = 0.999). The total phenolic content in the aqueous extract of leaves of PG and AM was 161.846% and 129.671% Ga equivalent g−1, respectively. Total flavonoid content was calculated from the calibration curve (R2 = 0.989) and was found to be 4.084% and 2.6% Ru equivalent g−1 in PG-HA and AM-HA, respectively. Log IC50 value of each extract and fractions was calculated using Trolox as standard (log IC50: 14.28 ± 0.073) [Table 1].
Leaves of PG have been reported to be a good source of phenolic and flavonoid compound.[23,24] In our study, phenolic content was highest in PG-EA, followed by PG-B, PG-HA, PG-A, PG-H and PG-C [Table 1]. Pari passu, log IC50 value, an indicator of antioxidant activity was highest for PG-HA (4.947 ± 0.322) followed by PG-EA (4.752 ± 1.177). The phenolic content of AM was lower as compared to PG. The highest content of phenolic compounds (129.671%) and concomitant antioxidant activity (6.498 ± 0.295) was recorded in AM-HA.
With the developed TLC method for the separation of Ru, Qu, and Ga, well-resolved, well separated, impenetrable, and compacted spots were obtained when the ratio of mobile phase solvents-toluene: Ethyl acetate: Formic acid: Methanol was fixed as 3:4:0.8:0.7, v/v/v, respectively. The Rf of Ru, Qu, and Ga of standard marker were found to be 0.08, 0.76, and 0.63, respectively [Figure 1a].
Figure 1.

Chromatographic separation of phytoconstituents of Aegle marmelos (L.) Correa was achieved using the mobile phase toluene: Ethyl acetate: Formic acid: Methanol (3:4:0.8:0.7 v/v/v). Typical thin-layer chromatography chromatogram, as detected at 254 nm, of standard drugs Ru (Rf = 0.08), Qu (Rf = 0.76) and Ga (Rf = 0.63) (a); AM-HA (b); AM-H (c); AM-C (d); AM-EA (e); AM-B (f) and AM-A (g) is presented. Ru: Rutin; Qu: Quercetin; Ga: Gallic acid
The method was validated using parameters such as accuracy, precision, robustness, specificity, LOD, and LOQ. The linear regression data for the calibration curves (n = 3) showed excellent linear relationship over the concentration range 33.33–1666.66 ng/spot for Ru, Qu, and Ga [Table 2]. The developed TLC method for extraction and estimation of Ru, Qu, and Ga results showed good recovery of 99.97%–104.44% with %RSD, not more than 2 [Table 3]. The measurement of peak area six times interday, intraday, and intra-analyst showed %RSD (<2), showed that the method was precise [Table 4].
Table 3.
Accuracy data of developed high-performance thin-layer chromatography method for simultaneous separation of rutin, quercetin, and gallic acid
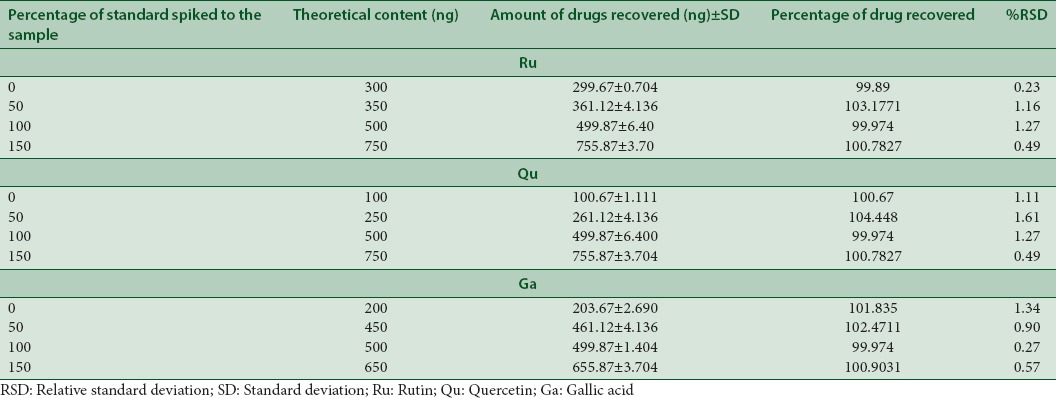
Table 4.
Precision of the developed high-performance thin-layer chromatography method for the simultaneous separation of rutin, quercetin, and gallic acid (n=6)
The analytical robustness is evaluated by slight changes in the solvent system, wavelength, saturation time were deliberately introduced, and the resultant change in the peak of Ru, Qu, and Ga was examined [Figure 1a]. The Design Expert software proposed coded polynomial equation for peak area of Ru, Qu, and Ga.
Peak area of Ru (Y1) =919.20 + 12.38 × A − 4.75 × B + 11.38 × C − 5.50 × AB − 21.25 × AC − 2.50 × BC
Peak area of Qu (Y2) =1653.00 + 25.37 × A − 6.50 × B + 2.38 × C − 3.75 × AB − 16.00 × AC − 11.25 × BC + 29.50 × A2 − 9.75 × B2 − 5.50 × C2
Peak area of Ga (Y3) =1299.00 + 4.62 × A − 15.00 × B + 13.13 × C − 1.25 × AB − 1.00 × AC − 19.75 × BC + 28.25 × A2 − 8.50 × B2 − 20.75 × C2.
Where A is the toluene (v/v), B is wavelength (nm), and C is the saturation time (min).
The above polynomial equation shows that toluene, wavelength, and saturation time, slightly affected peak area, Rf and resolution of Ru, Qu, and Ga. Toluene had a prominent negative effect on the peak area of Ru, Qu, and Ga. As the concentration of toluene increased in the mobile phase, there was an increase in the peak area of the three compounds [Figure 2].
Figure 2.
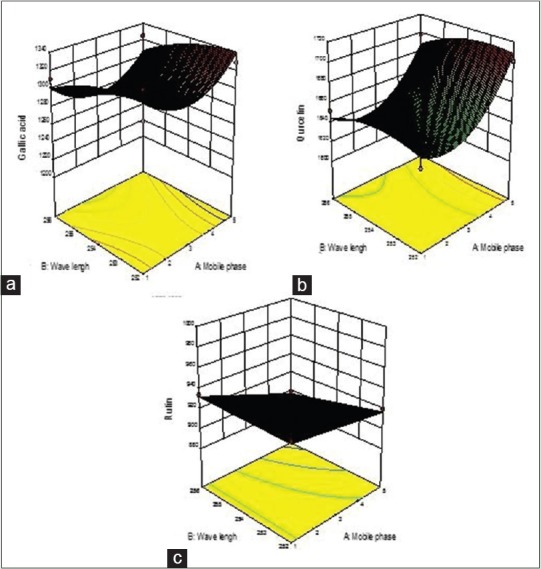
Three-dimensional response graphs of Ru, Qu, and Ga using Box–Behnken experimental design. Factors 9Wavelength: Mobile Phase0 on (a) Ru: Rutin; (b) Qu: Quercetin; (c) Ga: Gallic acid
The peak purity was determined by comparing the Rf value and spectra of spots (peak start, apex, and end position) and good correlation of Ru (0.992), Qu (0.099), and Ga (0.989) with the sample was recorded [Figure 1a]. The LOD for Ru, Qu, and Ga was found to be 4.51, 4.2, and 5.27, respectively. The LOQ for Ru, Qu, and Ga was found to be 13.67, 12.73, and 15.98 ng/spot, respectively [Table 2]. The HPTLC conditions were optimized for the volume of sample, run length, positions, chamber saturation time, humidity, detection wavelength, and the distance between tracks. Consequently, accurate and reproducible Rf values and better determination in the compound peak were achieved.
The developed method was applied for the simultaneous determination of Ru, Qu, and Ga in the aqueous extract of leaves of AM [Figure 1b-g] and PG [Figure 3].
Figure 3.

Chromatographic separation of phytoconstituents of Psidium guajava Linn was achieved using the mobile phase toluene: ethyl acetate: formic acid: methanol (3:4:0.8:0.7 v/v/v). Typical thin-layer chromatography chromatogram, as detected at 254 nm, of PG-HA (a); PG-H (b); PG-C (c); PG-EA (d); PG-B (e) and PG-A (f) is presented
HPTLC-based fingerprinting of Qu and Ru has been earlier reported.[13] Here, we report for the first time, validation of HPTLC-based robust, sensitive, and accurate method for the simultaneous determination of Ru, Qu, and Ga at 254 nm with distinct Rf value. HPTLC fingerprint of the various extract and fractions of AM and PG show the presence of Ru, Qu, and Ga and the same could be quantified using the developed method. The present study reports novel method for simultaneous HPTLC-based quantification of three flavonoids such as Ru, Qu, and Ga that was successfully applied for standardization of AM and PG. In addition, the flavonoid content of the plants could be correlated with their biological activity. For the first time, we report the content of Ga in the leaves of AM and PG that was earlier reported to be present in their fruits.
CONCLUSION
In accordance with the ICH guideline, the HPTLC method for the simultaneous estimation of Ru, Qu, and Ga is precise, specific, and accurate. The method was applied for phytochemical standardization of hydroalcoholic extracts of the leaves of PG and AM and correlated with their antioxidant activity.
Financial support and sponsorship
This study was financially supported by AICTE, India, in the form of QIP fellowship to Mr. Jayachandran Nair. C. V is gratefully acknowledged.
Conflicts of interest
There are no conflicts of interest.
REFERENCES
- 1.Scalbert A, Williamson G. Dietary intake and bioavailability of polyphenols. J Nutr. 2000;130:2073S–85S. doi: 10.1093/jn/130.8.2073S. [DOI] [PubMed] [Google Scholar]
- 2.Kelly GS. Quercetin. Monograph. Altern Med Rev. 2011;16:172–94. [PubMed] [Google Scholar]
- 3.Costa LG, Garrick JM, Roquè PJ, Pellacani C. Mechanisms of neuroprotection by quercetin: Counteracting oxidative stress and more. Oxid Med Cell Longev. 2016;2016:2986796. doi: 10.1155/2016/2986796. [DOI] [PMC free article] [PubMed] [Google Scholar]
- 4.Sharma S, Ali A, Ali J, Sahni JK, Baboota S. Rutin: Therapeutic potential and recent advances in drug delivery. Expert Opin Investig Drugs. 2013;22:1063–79. doi: 10.1517/13543784.2013.805744. [DOI] [PubMed] [Google Scholar]
- 5.Phan AN, Hua TN, Kim MK, Vo VT, Choi JW, Kim HW, et al. Gallic acid inhibition of Src-Stat3 signaling overcomes acquired resistance to EGF receptor tyrosine kinase inhibitors in advanced non-small cell lung cancer. Oncotarget. 2016;7:54702–13. doi: 10.18632/oncotarget.10581. [DOI] [PMC free article] [PubMed] [Google Scholar]
- 6.Kamath JV, Nair R, Ashok CK, Lakshmi M. Psidium guajava L: A review. Int J Green Pharm. 2008;2:9–12. [Google Scholar]
- 7.Mahaseth RK, Kumar S, Dutta S, Sehgal R, Rajora P, Mathur R, et al. Pharmacodynamic study of interaction of aqueous leaf extract of Psidium guajava linn. (Myrtaceae) with receptor systems using isolated tissue preparations. Indian J Pharm Sci. 2015;77:493–9. doi: 10.4103/0250-474x.164778. [DOI] [PMC free article] [PubMed] [Google Scholar]
- 8.Ravi K, Divyashree P. Psidium guajava: A review on its potential as an adjunct in treating periodontal disease. Pharmacogn Rev. 2014;8:96–100. doi: 10.4103/0973-7847.134233. [DOI] [PMC free article] [PubMed] [Google Scholar]
- 9.Maity P, Hansda D, Bandyopadhyay U, Mishra DK. Biological activities of crude extracts and chemical constituents of bael, Aegle marmelos (L.) corr. Indian J Exp Biol. 2009;47:849–61. [PubMed] [Google Scholar]
- 10.Kumar S, Mahaseth RK, Tiwari M, Sehgal R, Rajora P, Mathur R, et al. Interaction of aqueous leaf extract of Aegle marmelos (L.) corr. with cholinergic, serotonergic and adrenergic receptors: An ex vivo study. Indian J Pharmacol. 2015;47:109–13. doi: 10.4103/0253-7613.150374. [DOI] [PMC free article] [PubMed] [Google Scholar]
- 11.Anshu W, Moni G, Mallick SA, Guleria S, Manish S. Antioxidant potential and phenol profile of Bael leaf (Aegle marmelos) Indian J Agric Biochem. 2015;28:138–42. [Google Scholar]
- 12.Kumar D, Dhurandhar K, Verma R, Barman S, Kumar A. Evaluation of total phenolics and flavonoids in different plant of Chhattisgarh. J Pharmacogn Phytochem. 2013;2:116–8. [Google Scholar]
- 13.Amir M, Mujeeb M, Ahmad S, Akhtar M, Ashraf K. Design expert-supported development and validation of HPTLC method: An application in the simultaneous estimation of quercetin and rutin in Punica granatum, Tamarindus indica and Prunus domestica. Pharm Methods. 2013;4:62–7. [Google Scholar]
- 14.Mallick MN, Singh M, Parveen R, Khan W, Ahmad S, Zeeshan Najm M, et al. HPTLC analysis of bioactivity guided anticancer enriched fraction of hydroalcoholic extract of Picrorhiza kurroa. Biomed Res Int. 2015;2015:513875. doi: 10.1155/2015/513875. [DOI] [PMC free article] [PubMed] [Google Scholar]
- 15.Evans WC. Trease and Evans Pharmacognosy. 15th ed. Philadelphia: W.B. Saunders Company Ltd; 2002. [Google Scholar]
- 16.Singh R, Singh S, Kumar S, Arora S. Free radical-scavenging activity of acetone extract/fractions of Acacia auriculiformis A. Cunn. Food Chem. 2007;103:1403–10. [Google Scholar]
- 17.Baba SA, Malik SA. Determination of total phenolic and flavonoid content, antimicrobial and antioxidant activity of a root extract of Arisaema jacquemontii Blume. J Taibah Univ Med Sci. 2015;9:449–54. [Google Scholar]
- 18.Suen J, Thomas J, Kranz A, Vun S, Miller M. Effect of flavonoids on oxidative stress and inflammation in adults at risk of cardiovascular disease: A systematic review. Healthcare (Basel) 2016;4:69. doi: 10.3390/healthcare4030069. doi: 10.3390/healthcarne4030069. [DOI] [PMC free article] [PubMed] [Google Scholar]
- 19.Kim YS, Farrar W, Colburn NH, Milner JA. Cancer stem cells: Potential target for bioactive food components. J Nutr Biochem. 2012;23:691–8. doi: 10.1016/j.jnutbio.2012.03.002. [DOI] [PMC free article] [PubMed] [Google Scholar]
- 20.Attimarad M, Ahmed KK, Aldhubaib BE, Harsha S. High-performance thin layer chromatography: A powerful analytical technique in pharmaceutical drug discovery. Pharm Methods. 2011;2:71–5. doi: 10.4103/2229-4708.84436. [DOI] [PMC free article] [PubMed] [Google Scholar]
- 21.Heyden YV. Extracting information from chromatographic herbal fingerprints. LCGC Europe. 2008;21:438–43. [Google Scholar]
- 22.Loescher CM, Morton DW, Razic S, Agatonovic-Kustrin S. High performance thin layer chromatography (HPTLC) and high performance liquid chromatography (HPLC) for the qualitative and quantitative analysis of Calendula officinalis-advantages and limitations. J Pharm Biomed Anal. 2014;98:52–9. doi: 10.1016/j.jpba.2014.04.023. [DOI] [PubMed] [Google Scholar]
- 23.Laily N, Kusumaningtyas RW, Sukarti I, Kartika Rini MR. The Potency of guava Psidium guajava (L.) leaves as a functional immunostimulatory ingredient. Procedia Chem. 2015;14:301–7. [Google Scholar]
- 24.George L, Rajendran B, Manickam V, Ragothaman A, Sirajudeen KN, Tamizhselvi R. Psidium guajava leaf extract modulate cytokine expression in lipopolysaccharide-activated primary mouse neutrophils thereby inhibiting NF-κB activity. Int J Biol Pharm Res. 2014;5:870–5. [Google Scholar]