

Abstract
Identifying protein-coding genes in eukaryotic genomes remains a challenge in post-genome era due to the complex gene models. We applied a proteogenomics strategy to detect un-annotated protein-coding regions in mouse genome. High-accuracy tandem mass spectrometry (MS/MS) data from diverse mouse samples were generated by LTQ-Orbitrap mass spectrometer in house. Two searchable diagnostic proteomic datasets were constructed, one with all possible encoding exon junctions, and the other with all putative encoding exons, for the discovery of novel exon splicing events and novel uninterrupted protein-coding regions. Altogether 29,586 unique peptides were identified. Aligning backwards to the mouse genome, the translation of 4,471 annotated genes were validated by the known peptides; and 172 genic events were defined in mouse genome by the novel peptides. The approach in the current work can provide substantial evidences for eukaryote genome annotation in encoding genes.
Keywords: Proteogenomics, genome annotation, mouse
1 Introduction
As the post-genomic era gains momentum, identifying protein-coding genes remains a fundamental challenge in genome annotation [1]. Historically, data sources based on gene expression (e.g. ESTs library) have provided valuable information for defining the location of encoding genes in genome [2–4]. On the other hand, the method of ab initio gene prediction has been proved to be rather effective in cataloging prokaryote genomes [5–7]. However, both approaches have to account for an inevitable deficiency that they can not give the direct evidence of an expressed gene being actually translated into its protein product or not. In recent years, the strategy of proteogenomics, which uses proteome information to interpret protein-coding gene models, has been broadly applied to annotate prokaryote and eukaryote genomes. It can complement previous approaches by independently and unambiguously identifying the naturally expressed protein products of the genome, thus provide direct evidences for characterizing protein-coding genes [1].
According to the typical analysis pipeline of bottom-up proteomics, the essential step of proteogenomics is to build a feature database containing diagnostic peptide/protein sequences against which tandem mass spectra data could be searched [8–10]. The diagnostic peptides identified were then aligned backwards to the parent genome to compare with the pre-annotated gene models, to confirm existent protein-coding genes in public databases, determine translation start and stop sites, discover new spliced exon junctions and novel encoded genes [11–13]. In prokaryote genomes, for example, Link et al searched tandem mass spectra against a 6-frame translated Haemophilus influenza genome for the first time. They found 2 genome loci which were not previously annotated [14]. Ishino et al integrated a tandem mass proteomic data with a knowledge system regarding the translation initiation sites in Synechocystis sp. PCC6803 genome. A total of 14 N-terminal annotation errors in current gene boundaries were eventually revised and six probable new candidate ORFs were verified [15].
As for eukaryote genome, the cassette gene models and the complex alternative splicing patterns render the application of proteogenomics far more difficult than for prokaryote genomes. Still, notable progresses have been achieved in this field. Castellina et al searched large amount of tandem mass spectrometry data with three different translation frames of the Arabidopsis thaliana genome. They newly discovered 778 protein-coding genes and refined 695 pre-annotated genes in Arabidopsis thaliana using more than 140,000 identified distinct peptides [11]. On the other hand, Merrihew et al used a general proteomic method to annotate C. elegans genome. In total 6,010 exon-exon splicing junctions were verified in WormBase and 429 new coding sequences were identified, of which 23 were inferred to represent products of pseudogenes, 152 to refine errors in gene models and 245 to provide hints of novel gene discoveries [13]. For human genome, Tanner et al built a compact dataset representing all the exons and introns. The queried results with tandem mass spectra data validated a large number of exons and introns at the level of translation, discovered novel exons or extended exons in 16 human genes and found 40 novel alternative splicing events [12]. Still for human genome, searching against the in silico translation of entire human genome, Bitton et al discovered 346 putative human novel peptides, two of which were validated as novel protein isoforms and the rest were corresponded to novel genome loci [16].
One of the model organisms, mouse, has been an experimental subject for many years. Its genome information has undergone continual updates since the first release of its genome sequence [17]. In the latest release, it was annotated with more than 50,000 full length proteins from more than 20,000 protein-coding genes (Ensembl gene 59), and the protein-coding region only took up about 1% of the whole genome [18]. For sure it is not the final version. Mouse genome annotation had never been tackled with proteogenomics strategy until recently, Brosch et al inferred 10 novel protein-coding loci, 31 alternative splicing events and 53 cases of alternative translation start sites using newly identified peptides from proteomics analysis [19].
Almost concurrently, we made an effort to define un-annotated protein-coding regions in mouse genome using high-accuracy tandem mass spectra data generated in house. Two diagnostic datasets of theoretical peptide sequences were constructed based on mouse genome sequence. In consideration of the cassette model of exon/intron in eukaryote genes, peptides in one dataset (denoted as EJCT dataset) represented spliced exon-exon junctions across the genome, and peptides in the other dataset (denoted as ORF dataset) covered un-interruptive encoding regions embedded in open reading frames. Additionally, a non-redundant competitive dataset (denoted as Annotated dataset) of known mouse proteins was constructed with full mouse protein sequences from NCBI Refseq protein [20], EBI-IPI protein[21] and Ensembl proteins [18]. Combining either EJCT dataset or ORF dataset with Annotated dataset, two searchable proteomic databases can be composed. Overall 494 MS/MS raw files from multiple mouse samples were queried by X!Tandem against these two databases respectively. Finally 28,711 known peptides and 875 novel diagnostic peptides were recovered from both databases through a strict cutoff of peptide false discovery rate (FDR) at spectrum level. For the novel peptides, about 27% (235) could be cross referenced in other independent sources (ESTs library, RNA-Seq data, splicing array data and homolog information).
Aligning the peptides backwards to the mouse chromosome, 4,471 pre-annotated genes (including 296 hypothetical genes) were confirmed of their translation products by the known peptides, and 172 novel genic events were annotated in mouse genome by the novel peptides. Specifically, 88 events could indicate novel ORFs in the un-interpreted genome region, 52 events were related to new exon splicing isoforms, 19 events could indicate retained introns to mature mRNA, 6 events overlapped with pre-annotated 3′/5′ UTR, 2 events possibly defined two new longer exons than previously located, 3 events updated three “Transcript only” genes into protein-coding regions, and 2 events verified translations of two pseudogenes. Our work pipeline is illustrated in Figure 1.
Figure 1.
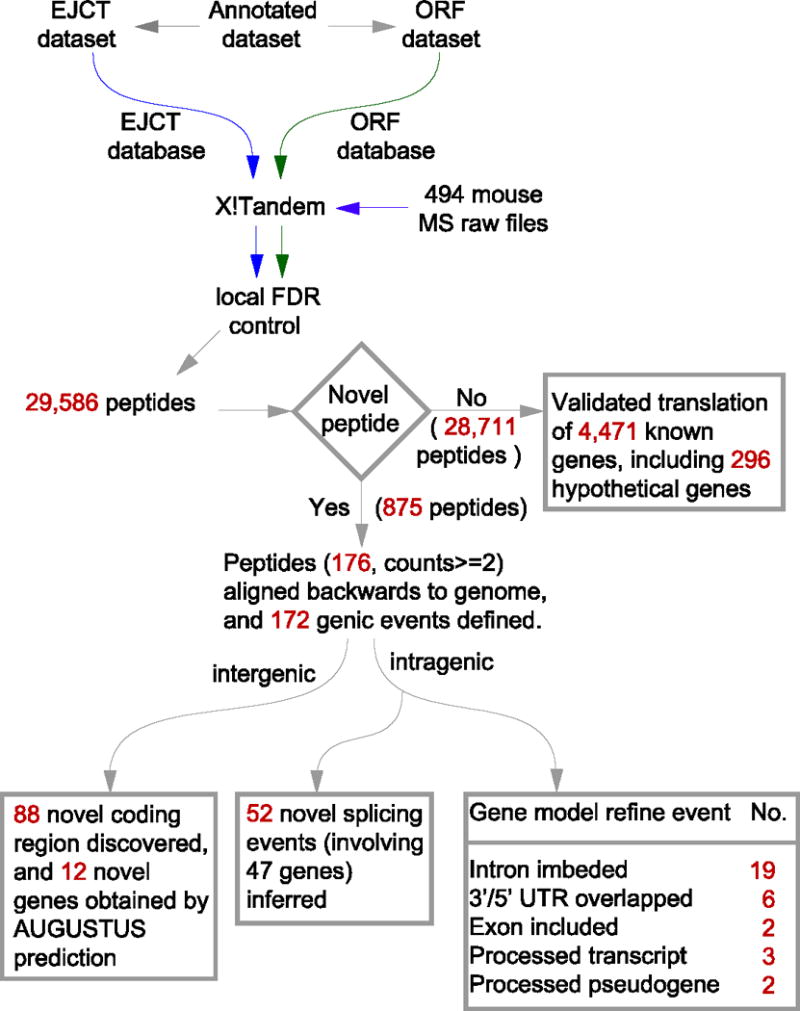
The analysis pipeline for discovery of novel protein-coding features in mouse genome by proteogenomics strategy.
2 Results
2.1 Generation of tandem mass spectrometry data from mouse samples
In order to achieve a relatively high coverage of mouse proteome, 494 mouse MS raw files were generated by intensive liquid chromatography fractionation coupled with high mass accuracy identification with LTQ-Orbitrap mass spectrometer. The samples were collected from mouse embryonic stem cells, differentiation and mature 3T3-L1 adipose cells, mouse brain, muscle and liver tissues. For all of the samples, parallel phosphorylation enrichment was performed with ion exchange chromatography [22] and/or titanium dioxide [23]. By including low-abundance phosphoproteins in living cells, the coverage of proteome identification was increased [24].
2.2 Construction of two diagnostic databases
For diagnostic peptide discoveries one initial step was to build extensive proteomic query sequence databases. Since most of eukaryote genes are modeled by cassette exon/intron(s) in the genome, the novel protein-coding feature regions could be derived from (i) novel splice junctions of known exons in annotated genes and (ii) un-discovered continuous encoding regions located in annotated genes or in un-interpreted regions in mouse genome. To this end, we constructed two diagnostic datasets for peptides discovery (See Materials and methods). EJCT (Exon JunCTion) dataset was built to discover peptides which could indicate exon junctions in annotated genes (Supplementary Figure 1). It included 1,272,627 non-ambiguous peptide sequences. On the other hand, ORF dataset, preliminarily obtained by translating mouse genome sequence in six frames to encompass all possible encoded peptides, was built to discover potential novel encoding regions from ORF in mouse genome. It contained 81,371,189 non-ambiguous peptide sequences.
2.3 Data query by X!Tandem
X!Tandem was chosen as the proteomics search engine in consideration of i) its high speed, which could be a primary advantage for querying large database with large amount of tandem mass spectrometry data, and ii) its probability-based scoring to effectively evaluate the quality of each mapping between a spectrum and candidate peptides [25]. The preliminary evaluation hyper score could be conveniently applied to control the quality of searched peptides. Target/Decoy strategy was adopted to build the input search database EJCT/ORF for X!Tandem, with the decoy dataset being the reversals of EJCT/ORF dataset [26]. In the present work, a competitive Annotated dataset which contained non-redundant mouse full-length protein sequences from NCBI Refseq database, EBI-IPI database and Ensembl protein database, was combined with the target dataset of EJCT/ORF database and was queried by raw MS files. The spectrum hyper score from X!Tandem search results was used to control the local FDR to be less than 1e−6 at the spectrum level (See Materials and methods). Search parameters were set as following: fragment monoisotopic mass error = 0.4Da, parent monoisotopic mass error = ±20 ppm, maximum missed cleavage sites = 1 and modification mass = 57.022Da@cystine. Finally a set of 29,586 unique peptides were identified, of which 28,636 unique peptides (out of 1,029,150 spectra) were from EJCT database and 17,616 unique peptides (out of 690,243 spectra) were from ORF database (Supplementary Table 8). Most of the parsed spectra ppm were distributed in an acceptable range of less than 10 bias (Supplementary Figure 2).
2.4 Determination of novel diagnostic peptides
Diagnostic peptide in our work was defined as the peptide with unique genome locus which could confidently represent a splicing event of two exons in EJCT dataset or a continuous encoding genome region in ORF dataset. After FDR control, 23,399 (79%) peptides were present in both diagnostic EJCT or ORF dataset and Annotated dataset, which demonstrated the effective coverage and representativeness of the newly built diagnostic datasets. 1,285 (4%) peptides were identified only in diagnostic datasets (which could be candidate novel diagnostic peptides). 4,902 (17%) peptides were only present in Annotated dataset. Using the “both present” peptides as direct evidences, we confirmed the translation characteristics of 4,471 genes, and verified 296 hypothetical genes by two peptides-per protein standard (Supplementary Table 1). Further false positives from the 1,285 candidate novel diagnostic peptides were filtered out by blasting against the Annotated dataset (See Materials and methods). Eventually, 875 novel diagnostic peptides without any overlap (2,256 spectra) were finally defined, 284 of which (32%) were from EJCT dataset (Supplementary Table 2) and 591 (68%) from ORF dataset (Supplementary Table 3). The complementarity of the two distinct sets of novel diagnostic peptides proved the necessity of constructing diagnostic peptide datasets with different approaches. Out of the 875 novel diagnostic peptides, 235 (27%) peptides were further cross validated by other independent sources such as transcript evidences or homology hints from other species, some peptides were found with multiple evidences. In detail, 212 peptides were supported by RNA-seq data, 49 by NCBI EST library, and 1 by splicing microarray data, 22 by blasting with NCBI nr database (See Materials and methods).
Huttlin et al built a tissue specific atlas of mouse proteome which translationally validated 6,194 known mouse genes [27]. Comparing to the 4,471 known mouse genes translationally validated by our analysis, 2,186 genes are overlapped (49% of our result) (Supplementary Table 1).
We also compared our identified novel peptides with the work of Brosch et al, which discovered 10 novel protein-coding loci and 31 alternative splicing events in mouse genome by proteogenomics strategy [19]. Only one peptide (“DPFAELSLEDFL” in our work and “AAGKDPFAELSLEDFL” in Brosch et al) was shared that maps to the same chromosome position of mouse genome. This is not so surprising given the fact that the mouse proteome is far from being saturated by mass spectrometry-based peptide identifications. Moreover, protein expression occurs only under specific and transient cellular and developmental conditions [19]. It is very likely that different experiments capture different scenarios on complex mouse proteome. This also implies that there is still a long way to go to refine protein-coding regions in mouse genome by mass spectrometry.
On the other hand, since we used older versions of NCBI and Ensembl databases in our original analysis, we rechecked whether any of our identified novel peptides have been incorporated in current build of these databases. We found out that two of our identified novel peptides, one from EJCT dataset “SIFSGIDGLSSADPSSDWNAPAEEWGNWVDEDR”, the other from ORF dataset “MASNFIGNSTAIQELFK”, have now been incorporated in Mus_musculus.NCBIM37.63 from Ensembl (for details see Materials and methods).
2.5 Inference of genic events at genome level from novel diagnostic peptides
A total of 176 novel diagnostic peptides (identified with at least 2 counts) from 875 were selected to infer 172 genic events at genome level. By their genome loci relative to established gene models, the events could be classified into two types: intragenic-the genome loci of events overlapping within or cross the boundaries of annotated gene models, and intergenic-the genome loci of events locating in un-annotated region of mouse genome. The results were summarized in three categories, i) 52 intragenic events indicated new exon splicing isoforms, ii) 32 intragenic events refined existent gene models, and iii) 88 intergenic events provided evidences for novel protein-coding genes.
2.5.1 Intragenic events to infer novel exon splicing isoforms
In total 52 novel splicing events (involving 47 genes) in the genome were inferred from 52 novel diagnostic peptides from EJCT dataset (Supplementary Table 4). The median straddling distance of newly inferred splicing events was about 214 bp along the chromosome, which was about 20 times longer than the median distances of all known splice events (~210) upon which most prediction algorithms are based. It could partially explain the reason that these novel splicing events have not been annotated by ab initio prediction algorithms, since it is difficult for them to scan the genome sequence to connect two encoding exons together across a much longer distance.
For the 52 novel splicing events, 4 (8%) of them were supported by ESTs library, 3 (6%) of them were found with homology in nr database, and 22 (42%) kept the typical domains that existed in their parent genes (See Materials and methods). For example, 5 novel splicing events were found in gene Ttn (ENSMUSG00000051747), which gene was previously annotated with 31 transcripts (27 protein coding) in Ensembl database. Four of the new events possessed the typical domains of Ttn, “TITIN”, “Fibronectin, type III”, or “Immunoglobulin”, indicating at least one more new transcript of gene Ttn was identified in our work. Another novel splicing event that has not been annotated in current public database was represented by the peptide “WEGEDEDEDVKLEEPEESK”, which linked the exons of ENSMUSE00000684431 and ENSMUSE00000348770, straddling two middle exons (ENSMUSE00000684428 and ENSMUSE00000684427) in gene Eif3j (ENSMUSG00000027236) (Figure 2A). The transcript evidence from ESTs library, dbj|AV470456.1|, obviously supported the novel splicing junction. We also found the homology of the event in species of Macaca mulatta (ref|XP_002804798.1|) and Callithrix jacchus (ref|XP_002753452.1|) from nr database. In addition, all the translation level evidences contained the typical domain of gene Eif3j, “Translation initiation factor eIF3 subunit”. The splicing event therefore should refine the gene annotation of Eif3j by bringing out a novel transcript and the corresponding novel protein.
Figure 2.
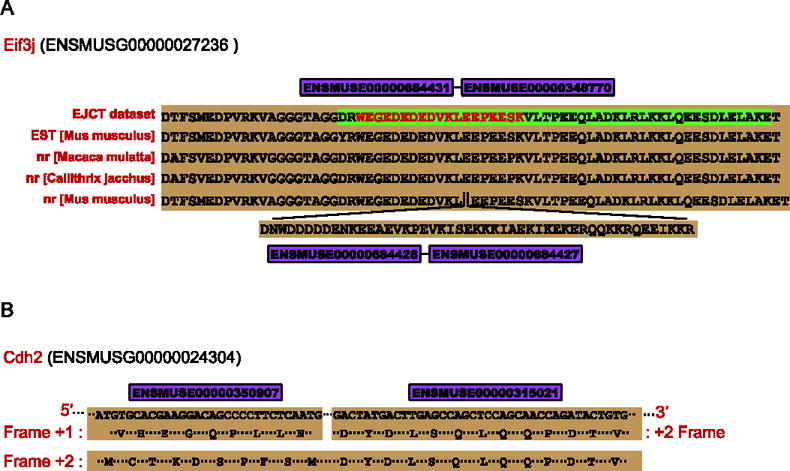
A) One novel diagnostic peptide “MCTKDSPFSMDYDLSQLQQPDTVEPDAIKPVGIR” represents a new exon splicing event with frame shift. B) A new exon splicing event inferred from novel diagnostic peptide “RWEGEDEDEDVKLEEPEESK” is cross supported by transcript evidence from EST library and homolog alignment to nr database.
In total 8 (15%) frame shift splicing events were detected because exon phases were disregarded during the construction of EJCT dataset (See Materials and methods). One new splicing peptide, which straddled the exons ENSMUSE00000350907 and ENSMUSE00000315021 of the gene Cdh2 (ENSMUSG00000024304), was found to be a frame shift event (Figure 2B). In Ensembl database, ENSMUSE00000350907 were translated in Frame +1 and ENSMUSE00000315021 in Frame +2, however, the detection of the peptide “MCTKDSPFSMDYDLSQLQQPDTVEPDAIKPVGIR” suggested that the two exons were joined in order and translated in Frame +2. The “ATG” in the 5′end of exon ENSMUSE00000350907 encoded amino acid “M”, which changed the encoding frame of the exon and made the junction with exon ENSMUSE00000315021 possible. Frame shift events were also discovered in other works of eukaryotic genome annotation with this similar strategy [28]. This indicates the superiority of proteogenomics method, since transcript evidences or ab initio prediction tools can hardly verify events of coding frame shift.
2.5.2 Intragenic events to refine gene models
Thirty two intragenic events which were discrepant with current annotation of gene models were discovered, occurring in the regions of intron (19), exon (2), 3′/5′ UTR (6) or regions inside transcript-only gene (3) or pseudogene (2).
Totally 19 genic events happened within introns. The discoveries of corresponding peptides of which could provide confident evidences for their being finally translated to protein products (Supplementary Table 5). However, it was difficult to infer novel transcript isoforms or correct existing transcript models from these events, because only fragments could be assembled from peptides to genes. Other independent sources were in lack of support in these cases, since out of the 19 intronic protein coding events, only 1 peptide could find evidence from ESTs library, 2 peptides could find nr homolog alignments. Meanwhile, using the 19 novel peptides as hints to AUGUSTUS (a gene prediction tool which could integrate other information as hints of nucleotide sequence to improve accuracy of gene discovery) [29], few could be included into reasonable exon models. However, even the fragment coding information could improve gene annotation. For example, one continuous coding region inferred by the peptide “NPWPKVDAHSGVLLQYNGMLEMNYYTVLFGVSR” located between the two exons (ENSMUSE00000570078, ENSMUSE00000641044) in gene Fam172a (ENSMUSG00000064138, Chr13: 77847983-78305491) (Figure 3A). Homology evidences from nr database indicated that the sequence of the coding region was similar to the corresponding part of one mouse gene “Cs citrate synthase” (Entrez gene ID: 12974) located on chromosome 10, and its homolog gene in Rattus norvegicus (Entrez gene ID: 170587) and Bos Taurus (Entrez gene ID: 280682). It also contained the typical function domain of gene Cs citrate synthase, “Citrate synthase”, across the whole coding region. The evidences here could possibly support a new transcript for gene Fam172a with the partial coding region containing a domain functioning similarly like gene Cs citrate synthase.
Figure 3.
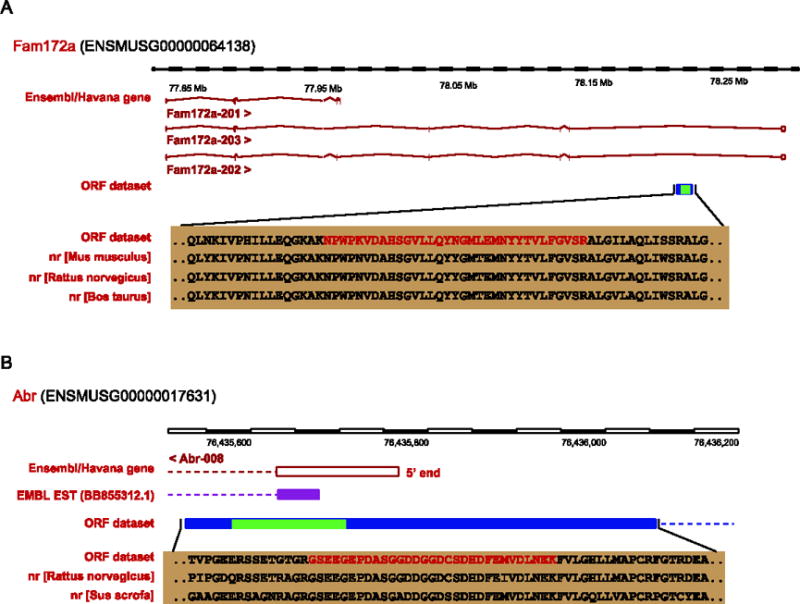
A) A coding region was discovered in an intron of gene Fam172a by inference from peptide “KNPWPKVDAHSGVLLQYNGMLEMNYYTVLFGVSR”. B) The 5′ UTR of gene Abr could be refined by a novel ORF event inferred from a diagnostic peptide “KNPWPKVDAHSGVLLQYNGMLEMNYYTVLFGVSR”.
Two genic events happened to exons. Novel ORFs defined by novel peptides enclosed existent exons (exon ENSMUSE00000803186 in gene ENSMUSG00000068036, and exon ENSMUSE00000496808 in gene ENSMUSG00000063870) (Supplementary Table 5). Because the exon boundaries had already been supported by other protein evidences, and there were no changes of the reading frame between the exons and newly defined ORFs, it was more likely that only new longer exons were discovered towards 3′ and 5′ ends of previous annotated exons (extended exons).
For the 6 events that overlapped with the 3′/5′ UTR, it was likely that they could refine the boundaries of the discrepant genes. Most 3′/5′ UTR regions in transcripts were annotated by ESTs and/or cDNA information, hypothetical protein could be predicted based on encoding un-interrupted region on the transcript. This was the case for one transcript (Abr-008, ENSMUST00000155035) of gene Abr (ENSMUSG00000017631) (Figure 3B). Its 5′ UTR was defined by an EST evidence (BB855312.1). However, one ORF event defined by peptide “GSEEGEPDASGGDDGGDCSDHDFEMVDLNEK” covered the non-coding exon (ENSMUSE00000840191) in the 5′ end of gene Abr. Meanwhile, there was a typical domain, “Bcr-Abl oncoprotein oligomerization domain”, for gene Abr imbedded in the new coding region which provided a reasonable evidence for the elongation of the coding region at 5′end. Moreover, the elongated coding sequences could be supported by its homology in Rattus norvegicus (ref|NP_570111.1|) and Sus scrofa (ref|NP_001038186.1|). In short, the newly defined ORF not only verified the translation of the exon at 5′ end, but also gave a hint of new 5′ UTR waiting to be confirmed in future.
Three genic events happened to “transcript-only” genes and two genic events happened to “pseudogenes”. Some potential protein-coding genes are only annotated with transcripts currently and lack of any evidence for their translation, but proteogenomics method could improve such annotation to protein level. Three genes annotated with “processed transcript only” were refined with translation proofs by our novel diagnostic peptides (Supplementary Table 5). On the other hand, two pseudogenes, “ENSMUSG00000083208” and “ENSMUSG00000083659”, were confirmed as protein-coding genes in our work (Supplementary Table 5). Predictively, the former gene could be associated with U6 snRNA, and the latter could act as an eukaryotic initiation factor.
2.5.3 Intergenic events to discover novel protein-coding genes
In total 88 (51%) newly defined ORF events located in the un-annotated genome regions. About 37 novel ORF events could be cross supported by other independent sources, namely 4 events from nr homolog alignments, 5 events from ESTs libraries, 11 events from possessing typical function domains and 34 events from RNA-seq reads information (Supplementary Table 5). These newly defined ORFs could probably supply supplementary information to assist modeling new genes by ab initio prediction tools. Using the coding regions as hints to AUGUSTUS, we were able to predict 12 reasonable genes each within the range of 1Mb bp up- and down-stream of the corresponding ORF (the median length of protein coding genes is about 0.5 Mb bp in Ensembl database). One predicted gene with two transcripts was located in the forward strand of chromosome 15:60320117-60350476. The hypothetical protein product (1470 aa) was much similar (95%) to one endonuclease/reverse transcriptase in mouse (gb|AAC53542.1|) with the function of DNase I-like Endonuclease/exonuclease/phosphatase (Figure 4A). There were 3 CDS in one of the transcripts, and the third one was supported by the newly defined ORF. We found that this part of the predicted gene was supported by evidences from ESTs library (Mus musculus, gb|BU515235.1|; Rattus norvegicus, gb|CF111220.1|) and nr homology alignments (Rattus norvegicus, ref|NP_787032.1|). It was similar to the corresponding sequence of mouse gene Eef1a1 (eukaryotic translation elongation factor 1 alpha 1, chromosome 8), and contained the typical domain for gene Eefla1, “elongate translation factor”. It seemed that the predicted gene was versatile. Another predicted gene was located in the forward strain of chrX:98899612-98969253 with two transcripts (Figure 4B). The predicted protein (~1100 aa) possessed one function domain “UDP-N-acetylglucosamine”, which was a typical domain for gene Ogt (O-linked N-acetylglucosamine (GlcNAc) transferase). Though currently not supported by any other independent evidence, proteomics confidence of inferring this protein was high: one newly defined ORF was located in the 3′ end and 4 novel diagnostic peptides were located within it.
Figure 4.
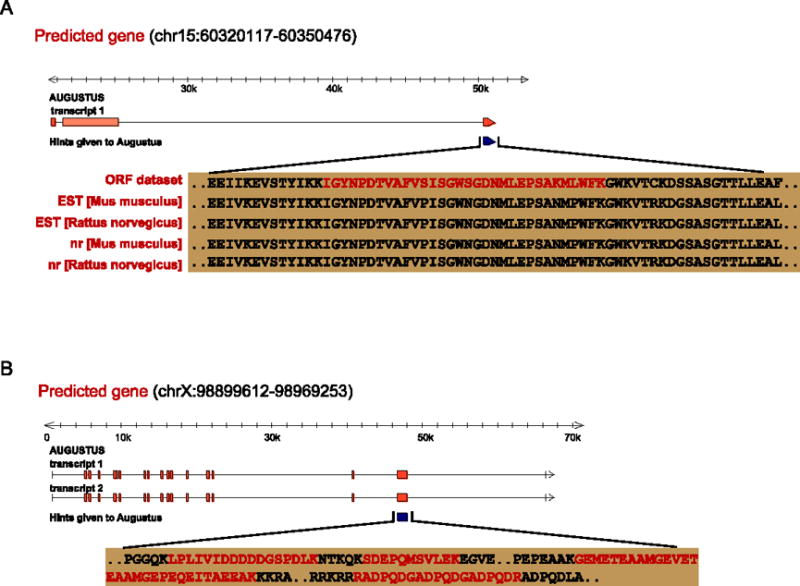
A) One predicted gene by AUGUSTUS was located in the forward strand of chr15:60320117-60350476. The newly discovered diagnostic peptide, “IGYNPDTVAFVSISGWSGDNMLEPSAKMLWFK”, was a proof to AUGUSTUS prediction. B) One predicted gene by AUGUSTUS was located in the forward strand of chrX:98899612-98969253. Four novel diagnostic peptides were found to support AUGUSTUS prediction.
3 Discussion
We tried to discover novel protein-coding feature regions in mouse genome by directly identifying natural peptides from multiple mouse tandem mass spectrometry data. Since the encoding exons in eukaryote genomes were interrupted by non-transcriptional introns, the complex splicing procedure of assembling exons into transcripts was the main mechanism of protein diversity compared with prokaryote genomes. As a result, two main tasks of eukaryote genome annotation were to discover splicing events between two encoding exons and to locate un-interrupted protein-coding regions on chromosomes in the view of proteogenomics. Two diagnostic peptide sequence datasets were constructed for this purpose in the current work. The EJCT dataset (1,272,627 items) could be used to detect splicing junctions between two encoded exons and ORF dataset (81,371,189 items) to identify un-interrupted protein-coding regions in the mouse genome. It is not for sure that these two datasets could include all the protein-coding evens in mouse genome, but they are certainly complementary in identifying novel peptides in our work, as it was shown that for the 875 novel diagnostic peptides, 284 (32%) were from EJCT dataset and 591 (68%) from ORF dataset without any overlap. The coverage and diversity of gene annotation could also be increased by building the two complementary diagnostic peptide datasets. In total, 52 exon splicing events and 120 genic events could be defined by the novel peptides from EJCT dataset and from ORF dataset respectively.
The peptides in the two datasets were theoretical and heterogeneous compared to well annotated full-length proteins in public databases. Also, the numbers of items in the two datasets were much larger than a typical mouse IPI dataset for proteomics search (55,303 protein sequences for IPI mouse v3.52). The above two situations could cause a high degree of signal to noise ratio for peptide identification, but also allows for broad choices for discovering potential un-annotated peptides in mouse proteome. Therefore series of filtration approaches were taken to reduce the redundancy and noise from the diagnostic peptide datasets and obtain reliable novel peptides. (See Material and methods). The filtered diagnostic datasets were about half size of the original ones, yet nearly 80% of identified peptides existed in both diagnostic datasets and the Annotated dataset, which indicated high coverage and broad representativeness of the constructed diagnostic datasets. In consideration of the heterogeneity of EJCT and ORF dataset, a well annotated full-length protein dataset (Annotated dataset) was constructed to be combined with each dataset in the process of database search respectively, which could reduce the possibility of mapping a spectrum to the suboptimum peptide in EJCT/ORF dataset when otherwise it could best map to a well defined peptide. Actually, less than 100 candidate novel peptides were in such cases (a spectrum matched two different peptides from EJCT/ORF dataset and Annotated dataset respectively with both the same E-value and hyper score but with different ppm), and they were filtered out from the final results. Additionally, the peptides existed both in EJCT/ORF dataset and Annotated dataset could be directly treated as known peptides, and the ones which were identified only in diagnostic datasets were considered as novel candidates.
Genome annotation through proteomics strategy should always be concerned of the error rate of spectra mapping to peptides, because of much larger sequence database used than the typical one, as stated above. Castellana et al used a cutoff of 1% cumulative FDR at the spectrum level to determine the confident peptides identified from mass spectra data of Arabidopsis samples [11], and Fermin et al applied a hyper score receiver operator curve (ROC) to reduce the false positive matches made by X!Tandem in detecting human novel genes by proteogenomics [28]. We chose target/decoy strategy to evaluate the quality of peptide identification. It assumes that the distribution of false matches to target sequences is identical to that of matches to decoy peptides [26], and an ideal result of peptide search could be that the peptides identified from decoy dataset only randomly scattered at the bottom of the distribution of the peptides identified from target dataset. In fact, with a relatively large heterogeneous dataset as the query database in our work, setting FDR ~ 1% was not satisfactory to distinguish the decoy peptides from the target ones since the hyper score distribution for the two datasets were both bell shaped and close to each other (data not shown). So a stricter empirical local FDR (< 1e−6) at spectrum-level was applied to filter out almost all the decoy peptides from the final result (See Materials and methods). As a result, instead of providing a much larger volume of novel diagnostic peptides with possibly high false positive rates, we chose to analyze relatively less but more confident novel peptides for the subsequent genome annotation.
After the FDR control, the peptides identified only from diagnostic datasets could still contain false positives derived from several other sources. Differences of peptide sequences could stem from non-synonymous coding single nucleotide polymorphisms, the processes of the local FDR control, EJCT database construction, and the same molecular weight of Ile and Leu. All these kinds of false positives could be detected by blasting with the Annotated dataset, and then were filtered out from the final result. Eventually, we confidently identified 875 novel diagnostic peptides (284 from EJCT dataset and 591 from ORF dataset) with 2,256 spectra. The peptides which were identified at least twice (176 peptide, 20%) were used to infer 172 genic events at genome level.
Genome annotation is more considered as a systematic project which requires and integrates multiple levels of gene related information. Each level of knowledge on gene is fundamentally based on the genome sequences but establishes and develops on its own system. As for their contribution to the discovering process of protein-coding genes, each possesses pros and cons. Confirmation of most protein-coding genes in eukaryotes used to look for transcript deposits, such as in ESTs library, or now in mRNA-seq data. However intrinsic problems such as sequencing error and chimerism are well aware of [30], besides, transcript proof can’t determine the ultimate existence of protein products. Some ab initio gene prediction tools are greatly helpful in modeling genes in completely un-know genome regions. They work well in prokaryotes, but show low accuracy in eukaryotes due to the complex intron/exon gene model and further alternative splicing events. Defining protein-coding regions in eukaryotes by aligning peptides back to genome as proteogenomics does partially solves the problems mentioned above. The advantage of proteogenomics is that it can integrate protein peptide evidences, along with other related information in gene level or RNA level. Nevertheless four other independent sources were made used of in our work, i) transcript evidences from ESTs library, splicing microarray data, mRNA-seq data, ii) nr database for homolog information, iii) gene prediction in silicon by AUGUSTUS, and iv) function domain prediction by InterProScan [31], to supply more hints on the newly discovered events in genome. The homolog evidences from Macaca mulatta (ref|XP_002804798.1|) and Callithrix jacchus (ref|XP_002753452.1|) supported the new splicing junction between two exons (ENSMUSE00000684431 and ENSMUSE00000348770) in mouse gene Eif3j, and the transcript evidence was also helpful to link them together. Since the gene was only annotated with one protein product (ENSMUSP00000028668) in Ensembl and one non-translation transcript, the integration of multiple independent evidences, especially the peptides from EJCT dataset, could refine the gene annotation of Eif3j by giving a strong hint of a new protein-coding transcript. The integration also worked well in the example of revising gene boundary of Abr. The 5′ end of Abr was previously determined by an EST evidence (BB855312.1). A novel defined ORF event in our work could probably revise the previous 5′ UTR into encoding feature and lengthen the coding region. The elongation was supported by homolog evidence of Rattus norvegicus (ref|NP_570111.1|) and Sus scrofa (ref|NP_001038186.1|), and domain prediction with translated ORF obtained a typical function domain for Abr. All of these could partly support the elongation, however, to define the exact boundary of 5′ end of gene Abr need other information in future. The initial step for ab initio gene prediction tools is to define the boundary of encoding exons frequently using sequence patterns such as acceptor splice site (required AG consensus) and donor splice site (required GT consensus). The predicted results usually contain numerous candidate coding regions since only about 1% genome region is encoded in mouse genome.
Proteogenomics strategy could supply the coding boundaries defined by identified peptides as hints to improve the accuracy for prediction tools. As we did in our work, 12 novel genes were predicted by AUGUSTUS which covered 16 novel diagnostic peptides. Some predicted genes could function similarly as known genes, such as predicted gene chr15:60320117-60350476 possessing the similar typical domain like gene DNaseII and Eef1a1. But for some predicted genes (e.g. predicted gene chrX:98899612-98969253), we could not get any information currently other than its protein sequence, further analyses are needed to explore its function.
4 Conclusion
In this work, proteogenomics strategy was applied on mouse mass spectrometry data to discover novel protein-coding regions and amend genome annotation. Two distinctive proteomic searchable datasets were constructed and queried with multi-origin mouse sample tandem mass spectra, in order to identify diagnostic peptides characterizing novel exon junction transcript variants and un-annotated exon-coding regions in mouse genome. Fifty two splice events and 120 ORF events were defined as novel in comparison with mouse genome annotation. After integrating information from other independent sources, such as ESTs library, microarray and mRNA-seq data, homology information, domain prediction analysis, some gene models were refined and a series of novel protein coding regions were defined. Our work proved the applicability of proteogenomics approach on a complex eukaryotic model organism, and the knowledge gained on the refinement of mouse genome annotation events is beneficial. With more in-depth mass spectrometry data generated, and proteogenomics strategy improved, more rounds of protein to gene cross-validation will happen and eventually bring wholesome gene model confirmation and refinement.
5 Materials and Methods
5.1 Tandem mass spectrometry data generation from mouse samples
All the 494 raw files were generated by our own experiments. For the large-scale phosphoproteome analysis of 3T3-L1 adipocyte differentiation (279 raw files) and mature cells (105 raw files), the detailed experimental procedures have been described elsewhere [32, 33] with some modifications. Briefly, the whole process included cell culture with the stable isotope labeling by amino acids in cell culture (SILAC) strategy, differentiation induction stimulated with insulin, 3-isobutyl-1-methylxanthine, and dexamethasone for 0, 5, 15, 30, 60, and 120 min (differentiation), 0, 5, and 10 min (mature), and proteome analyses with online yin-yang multidimensional liquid chromatography (MDLC)-MS/MS system [22] on linear ion trap (LTQ)-Orbitrap hybrid mass spectrometer (ThermoFisher Scientific, San Jose, CA). The NSI nanospray source was mounted and the voltage was set at 1.90 kV. Normalized collision energy was 35%. The data-dependent collection of the ten most intense ions with collision-induced dissociation from each full scan (performed in orbitrap) was selected for MS2 analyses (performed in ion-trap). Dynamic Exclusion settings: repeat count 2, repeat duration 30s, exclusion duration 90s. The resolution of the Orbitrap mass analyzer was set at 100, 000 (m/z 400) for the precursor ion scans. For the in-depth phosphoproteome data set from mES cells (80 raw files), the complete work flow has been stated recently [34]. In addition, phosphoproteome investigation of mouse tissues (liver, muscle and brain) were performed on MDLC-MS/MS platform aforementioned, in which 30 raw files were obtained in total.
5.2 Annotated dataset construction
The competitive Annotated dataset included 68,305 mouse annotated protein sequences from public protein databases of NCBI Refseq [20], Ensembl proteins [18] and EBI-IPI proteins [21]. Proteins with identical sequences from the three sources were recorded as one protein entry.
5.3 The EJCT (Exon JunCTion) dataset construction
The 260,804 mouse protein coding exon sequences were downloaded from Ensembl Biomart (Ensembl gene 59) in FASTA format. All the exons located in one Ensembl gene were ordered from 5′ end to 3′ end by their chromosome loci (Supplementary Figure 1). The exon closer to 5′ end of the gene was in succession joined with each exon closer to 3′ end of the gene without regarding exon phases (The exon phase indicates the position where the coding feature begins with reference to the reading frame. The phase is one of the integers 0, 1, or 2, indicating the number of bases that should be removed from the beginning of this exon to reach the first base of the next codon). The DNA sequence around junction site between each two exons was intercepted for 90bp sequence, and then the 180bp junction DNA sequence was three-frame translated into three theoretical peptide sequences respectively. In the case that exon length was shorter than 90bp, the whole exon sequence was included. The peptide was included into EJCT dataset in FASTA format with the two exon identifiers and the frame as the header information only if i) it didn’t contain any gap, ii) its length was longer than 6aa, iii) it contained Lysine (K) or Arginine (R) of trypsin catalytic sites, iv) the chromosome coordinate was unique when it was aligned backwards to the genome and v) the entry of its sequence was not the same as its reversal. The EJCT dataset eventually contained 1,272,627 non-ambiguous peptide sequences.
5.4 The ORF (Open Reading Frame) dataset construction
The complete mouse genome (NCBI Build 37) was downloaded from the NCBI Genome site in FASTA format. The genome was translated into putative ORF peptide sequence as previously [28]. The peptide was included into ORF dataset with its chromosome locus as the header information only if i) its length was longer than 6aa, ii) it contained Lysine (K) or Arginine (R) of trypsin catalytic sites, iii) the genomic locus was unique when it was aligned backwards to the genome and iv) the entry of its sequence was not the same as its reversal. The ORF dataset eventually contained 81,371,189 non-ambiguous peptide sequences.
5.5 Database search with X!Tandem and local FDR control
All the 494 raw files were converted into mzXML format files and analyzed by X!Tandem software [25]. The Target/Decoy strategy was used to build the input search databases for X!Tandem [26]. The EJCT/ORF databases were comprised of EJCT/ORF dataset (target database) and competitive Annotated dataset along with the reversed sequences of the two datasets as the decoy databases. Search parameters were set as following: Fragment monoisotopic mass error = 0.4Da, Parent monoisotopic mass error = ±20 ppm, Maximum missed cleavage sites = 1 and Modification mass = 57.022Da@cystine. All runs were performed on 96 nodes of Linux x86_64 platform. The 494 XML output files from X!Tandem analysis in EJCT/ORF dataset were parsed using Perl scripts. Each XML result was divided into peptide charge bins, of each charge bin only the spectrum with one unique candidate peptide was used to control the local FDR (2*No. of Decoy(spectra)/(No. of Target(spectra)+Decoy(spectra))) less than 1e−6.
5.6 Filtering of false positives from candidate novel diagnostic peptides
Possible known peptides (false positives) in total of 1,285 candidate novel diagnostic peptides were further filtered out by blasting with the Annotated dataset. These false positives could derive from i) non-synonymous coding single nucleotide polymorphisms of the same gene, yet the correlated peptides of which could be discriminated by X!Tandem because of molecular weight differences; ii) equal local FDR control, which could remove peptides with relatively low hyper scores in one mzXML file, but not the ones with high hyper scores in other mzXML files; iii) the interception of 60aa length for peptides in EJCT dataset, which might allow fragments of 60aa-length peptides with corresponding enzymatically full-length peptides being also identified (Supplementary Figure 1); and iv) the inherent flaw of searching engines not being able to discriminate the same molecular weight between Ile and Leu in peptide sequences. When the comparison mismatch between the candidate novel diagnostic peptide and its corresponding Annotated peptide of the highest blast similarity was less than or equal to 2 aa, it was defined as false positive and filtered out.
5.7 Diagnostic peptides cross-supported by mouse transcript data
The mouse transcripts data were collected from EST libraries in NCBI, mRNA-seq data [3] (The work mapped the transcriptomes of mouse brain, liver and muscle tissues by deep sequencing) and splicing microarray data [4] (The work used microarray platform to quantity tissue-specific alternative splicing events in major mouse tissues). All our identified 875 novel diagnostic peptides were aligned to EST libraries and microarray splicing evidences with tblastn algorithms. The local perfect alignment between transcript evidences and novel peptides from EJCT dataset should include at least 3 amino acids from each peptide adjoining the junction site. Peptides with less than 2 mismatches were annotated to be with “transcript support”. The mouse RNA-Seq data was downloaded from http://woldlab.caltech.edu/rnaseq/. The BED files of the reads from all the samples were compared to the coordinates of the novel peptides using BEDTools [35]. The uniquely and multiply mapped RNA-Seq reads whose coordinates overlapped at least one nucleotide with that of novel ORF peptides were considered as the evidence of peptides on the transcript level (As for cross supporting genic events, we required at least two RNA reads being imbedded in the encoding region). The coordinates of exon-junctions mapped by RNA-Seq reads were compared with that of novel peptides from EJCT dataset using BEDTools and a custom Perl script. The RNA-Seq reads were considered supportive to the novel peptides when their exon-junction sites were the same.
5.8 Cross comparison of novel peptides
Recently, Brosch M et al published a similar work, using shotgun proteomics to aid discovery of novel protein-coding events on mouse genome [19]. They supplied 68 newly identified peptides. In our work, we totally identified 875 novel peptides for mouse proteome. Two steps were taken to compare our results with Broach’s work. Firstly, the two sets of novel peptides were blast against each other directly (blastp parameters, E-value: 1e-5 and match coverage: 95%). Secondly, the correlating chromosome positions of the two sets of novel peptides on mouse genome were mapped. As a result, only one peptide was shared that map to the same chromosome position on mouse genome, “DPFAELSLEDFL” in our work and “AAGKDPFAELSLEDFL” in Brosch et al work.
In addition, we performed overlap comparison between our results and the latest version of mouse protein databases, which were not available in our original analysis. We downloaded the Mus musculus protein sequences from both Ensembl Mus_musculus.NCBIM37.63 and Uniprot Release 2011_07. Blastp parameters were set the same as above and mis-match was set at less than 2. The final results showed that two of our identified novel peptides, one from EJCT dataset “SIFSGIDGLSSADPSSDWNAPAEEWGNWVDEDR”, the other from ORF dataset “MASNFIGNSTAIQELFK”, are now incorporated as peptide “SIFSGIDGLSSADPSSDWNAPAEEWGNWVDEDR” in current ENSMUSP00000130190, and peptide “MASTFIGNSTAIQELFK” in current ENSMUSP00000130756, respectively.
5.9 Genic domain prediction
InterProScan was used to scan and predict protein domains based on sequence [31]. The full-length peptides of the two adjacent exons which contained novel diagnostic peptides from EJCT dataset were used as the input. The predicted domain region should include at least 5 amino acids at each side of the junction site of the two exons. The results are listed in Supplementary Table 6. The full-length ORF sequences which contained novel diagnostic peptides from ORF dataset were also used as the input for InterProScan and the predicted protein domains are provided in Supplementary Table 7.
Supplementary Material
Supplementary Figure 1 The construction of Exon JunCTion diagnostic dataset. Supplementary Figure 2 The ppm bias distribution of peptides identified in EJCT database (A) and ORF database (B).
Supplementary Table 1 The list of translation validation of annotated protein-coding genes by 2 peptides per protein. The genes marked with “MODEL”, “PREDICTED” or “INFERRED” are hypothetical. The comparison results with Hutlin et al work (Ref. 27) are also provided.
Supplementary Table 2 The list of novel diagnostic peptides identified from EJCT dataset.
Supplementary Table 3 The list of novel diagnostic peptides identified from ORF dataset.
Supplementary Table 4 The list of novel exon splicing events inferred from novel diagnostic peptides from EJCT dataset.
Supplementary Table 5 The list of novel ORF events inferred from novel diagnostic peptides from ORF dataset.
Supplementary Table 6 The list of domains predicted by InterProScan in newly defined exon splicing events.
Supplementary Table 7 The list of domains predicted by InterProScan in newly defined ORF events.
Supplementary Table 8 The list of relative information for all peptides identified in this work.
Acknowledgments
We thank Yi-Bo Wu, Rong-Xia Li, Wei Guo, Kun-Ming Zhang for kindly providing their mass spectrometry data for analysis. This project was supported by grants from Basic Research Program (2010CB912702) and High Technology Development Project (2009AA02Z304) from the Ministry of Science and Technology of China, and National Natural Science Foundation of China (31070752).
Footnotes
Publisher's Disclaimer: This is a PDF file of an unedited manuscript that has been accepted for publication. As a service to our customers we are providing this early version of the manuscript. The manuscript will undergo copyediting, typesetting, and review of the resulting proof before it is published in its final citable form. Please note that during the production process errors may be discovered which could affect the content, and all legal disclaimers that apply to the journal pertain.
References
- 1.Ansong C, Purvine SO, Adkins JN, Lipton MS, Smith RD. Proteogenomics: needs and roles to be filled by proteomics in genome annotation. Brief Funct Genomic Proteomic. 2008;7(1):50–62. doi: 10.1093/bfgp/eln010. [DOI] [PubMed] [Google Scholar]
- 2.Boguski MS. The turning point in genome research. Trends Biochem Sci. 1995;20(8):295–296. doi: 10.1016/s0968-0004(00)89051-9. [DOI] [PubMed] [Google Scholar]
- 3.Mortazavi A, Williams BA, McCue K, Schaeffer L, Wold B. Mapping and quantifying mammalian transcriptomes by RNA-Seq. Nat Methods. 2008;5(7):621–628. doi: 10.1038/nmeth.1226. [DOI] [PubMed] [Google Scholar]
- 4.Pan Q, et al. Revealing global regulatory features of mammalian alternative splicing using a quantitative microarray platform. Mol Cell. 2004;16(6):929–941. doi: 10.1016/j.molcel.2004.12.004. [DOI] [PubMed] [Google Scholar]
- 5.Peterson JD, Umayam LA, Dickinson T, Hickey EK, White O. The Comprehensive Microbial Resource. Nucleic Acids Res. 2001;29(1):123–125. doi: 10.1093/nar/29.1.123. [DOI] [PMC free article] [PubMed] [Google Scholar]
- 6.Meyer F, et al. GenDB–an open source genome annotation system for prokaryote genomes. Nucleic Acids Res. 2003;31(8):2187–2195. doi: 10.1093/nar/gkg312. [DOI] [PMC free article] [PubMed] [Google Scholar]
- 7.Van Domselaar GH, et al. BASys: a web server for automated bacterial genome annotation. Nucleic Acids Res. 2005;33:W455–459. doi: 10.1093/nar/gki593. Web Server issue. [DOI] [PMC free article] [PubMed] [Google Scholar]
- 8.Walther TC, Mann M. Mass spectrometry-based proteomics in cell biology. J Cell Biol. 190(4):491–500. doi: 10.1083/jcb.201004052. [DOI] [PMC free article] [PubMed] [Google Scholar]
- 9.Edwards NJ. Novel peptide identification from tandem mass spectra using ESTs and sequence database compression. Mol Syst Biol. 2007;3:102. doi: 10.1038/msb4100142. [DOI] [PMC free article] [PubMed] [Google Scholar]
- 10.Mo F, et al. A compatible exon-exon junction database for the identification of exon skipping events using tandem mass spectrum data. BMC Bioinformatics. 2008;9:537. doi: 10.1186/1471-2105-9-537. [DOI] [PMC free article] [PubMed] [Google Scholar]
- 11.Castellana NE, et al. Discovery and revision of Arabidopsis genes by proteogenomics. Proc Natl Acad Sci U S A. 2008;105(52):21034–21038. doi: 10.1073/pnas.0811066106. [DOI] [PMC free article] [PubMed] [Google Scholar]
- 12.Tanner S, et al. Improving gene annotation using peptide mass spectrometry. Genome Res. 2007;17(2):231–239. doi: 10.1101/gr.5646507. [DOI] [PMC free article] [PubMed] [Google Scholar]
- 13.Merrihew GE, et al. Use of shotgun proteomics for the identification, confirmation, and correction of C. elegans gene annotations. Genome Res. 2008;18(10):1660–1669. doi: 10.1101/gr.077644.108. [DOI] [PMC free article] [PubMed] [Google Scholar]
- 14.Link AJ, Hays LG, Carmack EB, Yates JR., 3rd Identifying the major proteome components of Haemophilus influenzae type-strain NCTC 8143. Electrophoresis. 1997;18(8):1314–1334. doi: 10.1002/elps.1150180808. [DOI] [PubMed] [Google Scholar]
- 15.Ishino Y, Okada H, Ikeuchi M, Taniguchi H. Mass spectrometry-based prokaryote gene annotation. Proteomics. 2007;7(22):4053–4065. doi: 10.1002/pmic.200700080. [DOI] [PubMed] [Google Scholar]
- 16.Bitton DA, Smith DL, Connolly Y, Scutt PJ, Miller CJ. An integrated mass-spectrometry pipeline identifies novel protein coding-regions in the human genome. PLoS One. 5(1):e8949. doi: 10.1371/journal.pone.0008949. [DOI] [PMC free article] [PubMed] [Google Scholar]
- 17.Bult CJ, Kadin JA, Richardson JE, Blake JA, Eppig JT. The Mouse Genome Database: enhancements and updates. Nucleic Acids Res. 38:D586–592. doi: 10.1093/nar/gkp880. Database issue. [DOI] [PMC free article] [PubMed] [Google Scholar]
- 18.Flicek P, et al. Ensembl’s 10th year. Nucleic Acids Res. 38:D557–562. doi: 10.1093/nar/gkp972. Database issue. [DOI] [PMC free article] [PubMed] [Google Scholar]
- 19.Brosch M, et al. Shotgun proteomics aids discovery of novel protein-coding genes, alternative splicing, and “resurrected” pseudogenes in the mouse genome. Genome Res. 21(5):756–767. doi: 10.1101/gr.114272.110. [DOI] [PMC free article] [PubMed] [Google Scholar]
- 20.Pruitt KD, Tatusova T, Klimke W, Maglott DR. NCBI Reference Sequences: current status, policy and new initiatives. Nucleic Acids Res. 2009;37:D32–36. doi: 10.1093/nar/gkn721. Database issue. [DOI] [PMC free article] [PubMed] [Google Scholar]
- 21.Kersey PJ, et al. The International Protein Index: an integrated database for proteomics experiments. Proteomics. 2004;4(7):1985–1988. doi: 10.1002/pmic.200300721. [DOI] [PubMed] [Google Scholar]
- 22.Dai J, et al. Protein phosphorylation and expression profiling by Yin-yang multidimensional liquid chromatography (Yin-yang MDLC) mass spectrometry. J Proteome Res. 2007;6(1):250–262. doi: 10.1021/pr0604155. [DOI] [PubMed] [Google Scholar]
- 23.Li QR, Ning ZB, Tang JS, Nie S, Zeng R. Effect of peptide-to-TiO2 beads ratio on phosphopeptide enrichment selectivity. J Proteome Res. 2009;8(11):5375–5381. doi: 10.1021/pr900659n. [DOI] [PubMed] [Google Scholar]
- 24.Grimsrud PA, Swaney DL, Wenger CD, Beauchene NA, Coon JJ. Phosphoproteomics for the masses. ACS Chem Biol. 5(1):105–119. doi: 10.1021/cb900277e. [DOI] [PMC free article] [PubMed] [Google Scholar]
- 25.Craig R, Beavis RC. TANDEM: matching proteins with tandem mass spectra. Bioinformatics. 2004;20(9):1466–1467. doi: 10.1093/bioinformatics/bth092. [DOI] [PubMed] [Google Scholar]
- 26.Elias JE, Gygi SP. Target-decoy search strategy for mass spectrometry-based proteomics. Methods Mol Biol. 604:55–71. doi: 10.1007/978-1-60761-444-9_5. [DOI] [PMC free article] [PubMed] [Google Scholar]
- 27.Huttlin EL, et al. A tissue-specific atlas of mouse protein phosphorylation and expression. Cell. 143(7):1174–1189. doi: 10.1016/j.cell.2010.12.001. [DOI] [PMC free article] [PubMed] [Google Scholar]
- 28.Fermin D, et al. Novel gene and gene model detection using a whole genome open reading frame analysis in proteomics. Genome Biol. 2006;7(4):R35. doi: 10.1186/gb-2006-7-4-r35. [DOI] [PMC free article] [PubMed] [Google Scholar]
- 29.Stanke M, et al. AUGUSTUS: ab initio prediction of alternative transcripts. Nucleic Acids Res. 2006;34:W435–439. doi: 10.1093/nar/gkl200. Web Server issue. [DOI] [PMC free article] [PubMed] [Google Scholar]
- 30.Castellana N, Bafna V. Proteogenomics to discover the full coding content of genomes: a computational perspective. J Proteomics. 73(11):2124–2135. doi: 10.1016/j.jprot.2010.06.007. [DOI] [PMC free article] [PubMed] [Google Scholar]
- 31.Zdobnov EM, Apweiler R. InterProScan–an integration platform for the signature-recognition methods in InterPro. Bioinformatics. 2001;17(9):847–848. doi: 10.1093/bioinformatics/17.9.847. [DOI] [PubMed] [Google Scholar]
- 32.YB Wu, et al. Concurrent quantification of proteome and phosphoproteome to reveal system-wide association of protein phosphorylation and gene expression. Mol Cell Proteomics. 2009;8(12):2809–2826. doi: 10.1074/mcp.M900293-MCP200. [DOI] [PMC free article] [PubMed] [Google Scholar]
- 33.Guo W, et al. Adipogenesis licensing and execution are disparately linked to cell proliferation. Cell Res. 2009;19(2):216–223. doi: 10.1038/cr.2008.319. [DOI] [PubMed] [Google Scholar]
- 34.QR Li, et al. Large-scale phosphoproteome profiles comprehensive features of mouse embryonic stem cells. Mol Cell Proteomics. doi: 10.1074/mcp.M110.001750. [DOI] [PMC free article] [PubMed] [Google Scholar]
- 35.Quinlan AR, Hall IM. BEDTools: a flexible suite of utilities for comparing genomic features. Bioinformatics. 26(6):841–842. doi: 10.1093/bioinformatics/btq033. [DOI] [PMC free article] [PubMed] [Google Scholar]
Associated Data
This section collects any data citations, data availability statements, or supplementary materials included in this article.
Supplementary Materials
Supplementary Figure 1 The construction of Exon JunCTion diagnostic dataset. Supplementary Figure 2 The ppm bias distribution of peptides identified in EJCT database (A) and ORF database (B).
Supplementary Table 1 The list of translation validation of annotated protein-coding genes by 2 peptides per protein. The genes marked with “MODEL”, “PREDICTED” or “INFERRED” are hypothetical. The comparison results with Hutlin et al work (Ref. 27) are also provided.
Supplementary Table 2 The list of novel diagnostic peptides identified from EJCT dataset.
Supplementary Table 3 The list of novel diagnostic peptides identified from ORF dataset.
Supplementary Table 4 The list of novel exon splicing events inferred from novel diagnostic peptides from EJCT dataset.
Supplementary Table 5 The list of novel ORF events inferred from novel diagnostic peptides from ORF dataset.
Supplementary Table 6 The list of domains predicted by InterProScan in newly defined exon splicing events.
Supplementary Table 7 The list of domains predicted by InterProScan in newly defined ORF events.
Supplementary Table 8 The list of relative information for all peptides identified in this work.