

ABSTRACT
Purpose
Although a single bout of continuous exercise (≥30 min) reduces postprandial triglyceride (TG), little evidence is available regarding the effect of multiple short (≤10 min) bouts of exercise on postprandial TG in individuals at increased risk for cardiovascular diseases. This study compared the effects of different patterns of walking on postprandial TG in postmenopausal, older women with hypertriglyceridemia.
Methods
Twelve inactive women (mean age ± SD, 71 ± 5 yr) with hypertriglyceridemia (fasting TG ≥1.70 mmol·L−1) completed three, 1-d laboratory-based trials in a random order: 1) control, 2) continuous walking, and 3) multiple short bouts of walking. On the control trial, participants sat in a chair for 8 h. For the walking trials, participants walked briskly in either one 30-min bout in the morning (0900–0930 h) or twenty 90-s bouts over 8 h. Except for walking, both exercise trials mimicked the control trial. In each trial, participants consumed a standardized breakfast (0800 h) and lunch (1100 h). Venous blood samples were collected in the fasted state and at 2, 4, 6, and 8 h after breakfast.
Results
The serum TG incremental area under the curve was 35% and 33% lower on the continuous and multiple short bouts of walking trials than that on the control trial (8.2 ± 3.1 vs 8.5 ± 5.4 vs 12.7 ± 5.8 mmol per 8 h·L−1, respectively; main effect of trial: effect size = 0.459, P = 0.001).
Conclusions
Accumulating walking in short bouts limits postprandial TG in at-risk, inactive older women with fasting hypertriglyceridemia.
Key Words: POSTPRANDIAL TRIGLYCERIDE, HYPERTRIGLYCERIDEMIA, WALKING, POSTMENOPAUSAL WOMEN, OLDER ADULTS
The most recent US recommendation for physical activity, jointly published by the American College of Sports Medicine and American Heart Association, states that adults should accumulate moderate-intensity physical activity for a minimum of 30 min for 5 d each week (1). These recommendations are similar to those put forth by the World Health Organization (2). Moreover, both sets of recommendations include the caveat that activity can be accumulated throughout the day in a minimum of 10-min bouts to attain the 30 min needed (1). Although the concept of accumulation is embedded within these recommendations, the US Physical Activity Guidelines Advisory Committee Report in 2008 (3) highlighted that only “limited data” indicated that accumulating activity in bouts of 8–10 min was able to improve selected cardiovascular disease biomarkers in a manner similar to that observed for the same volume of continuous activity.
Elevated nonfasting triglyceride (TG) concentrations are a causal risk factor for cardiovascular disease and all-cause mortality in men and women (4,5). The effectiveness of accumulating short bouts of activity to reduce concentrations of postprandial TG has been addressed in previous efficacy studies (6–12) (for a review of these, see Refs. [13–15]). Collectively, these studies have reported that accumulation of physical activity in shorts bouts, lasting 1.5–10 min in length, over a day confers a reduction in postprandial TG that is comparable to, or greater than, a similar volume of continuous activity (8–12). These findings have practical implications for the general public because participation in accumulated activity may be easier to incorporate into a daily schedule (16). Furthermore, a recent review has addressed that time spent in sedentary behavior, predominantly prolonged sitting, is independently associated with all-cause and cardiovascular disease mortality and cardiovascular disease incidence (17), although very high levels of moderate-intensity physical activity abolish this association (18). Laboratory-based studies demonstrate that regular interruption of sedentary time with brief bouts of physical activity can lower postprandial glucose (19–22) and insulin (21,22) and, in some studies, postprandial TG (21). However, despite clear evidence demonstrating that short durations of exercise accumulated in bouts of <10 min can reduce postprandial TG, no studies have addressed this in physically inactive older individuals at elevated risk for cardiovascular diseases. This issue is important to address because TG excursions after meals are often exaggerated in these individuals compared with their healthy peers (23).
Thus, the purpose of the present study was to examine postprandial TG concentrations in postmenopausal, older women with hypertriglyceridemia after either 30 min of continuous walking or 30 min of walking accumulated in twenty, 1.5-min bouts performed throughout a single day. Most previous studies have examined the delayed (next-day) effects of accumulating exercise on postprandial TG, rather than the same-day effects (24), partly because of the delayed expression of lipoprotein lipase (LPL), which is responsible for TG clearance from the circulation. However, some studies (11,14,21), but not all (19,25), have shown that postprandial TG can be reduced when activity is performed on the same day. From the perspective of daily metabolic control, it may be beneficial if reductions in postprandial TG occurred in tandem with reductions in glucose and insulin, which have been shown to occur in many studies (19–22). In addition, we wanted to evaluate whether this protocol is effective in reducing postprandial TG in at-risk individuals as it was in our previous study of normolipidemic, postmenopausal women (11).
METHODS
Participants
After approval from the institutional ethical advisory committee, 12 Japanese postmenopausal women with hypertriglyceridemia (fasting TG ≥1.70 mmol·L−1) gave written informed consent to participate in this study. Exclusion criteria for the study were as follows: fasting TG <1.70 mmol·L−1, current smoker, major illness, or physical problems (acute or chronic) limiting the ability to perform low-intensity physical activities. Initial information obtained via interview and questionnaire also indicated that no participant met current international public health guidelines for physical activity (i.e., moderate-intensity physical activity for at least 150 min·wk−1 or vigorous-intensity physical activity for 75 min·wk−1 or an equivalent combination of moderate and vigorous-intensity physical activity) (2). Nine women possessed the E3/E3 apolipoprotein (apo) E phenotype, two women possessed the E4/E3 apo E phenotype and one woman possessed the E4/E4 apo E phenotype. The physical characteristics of the participants (mean ± SD) were as follows: age of 70.5 ± 4.6 yr, body mass index of 25.3 ± 3.5 kg·m−2, systolic blood pressure of 144 ± 19 mm Hg, and diastolic blood pressure of 85 ± 11 mm Hg.
Anthropometry
Body mass was measured to the nearest 0.1 kg using a digital scale (Inner Scan 50; Tanita Corporation, Tokyo, Japan). Height was measured to the nearest 0.1 cm using a wall-mounted stadiometer (YS-OA; AS ONE Corporation, Osaka, Japan). Body mass index was calculated as weight in kilograms divided by the square of height in meters. Waist circumference was measured to the nearest 0.1 cm at the level of the umbilicus using a flexible plastic tape. Arterial blood pressure was measured from the right arm in a seated position by a standard mercury sphygmomanometer (605P; Yagami Co Ltd, Yokohama, Japan). Participants were seated on a chair for 5 min before measurements. Two measurements were taken, and the mean of these values was recorded.
Preliminary test
After a treadmill familiarization session, each participant was asked to walk “briskly” on a motorized treadmill (JOG NOW 700; Technogym, Milan, Italy) for several minutes to determine their walking speed for the main trial. “Brisk” walking was defined as feeling slightly out of breath while walking but still able to hold a conversation.
Standardization of diet and exercise
Participants weighed and recorded all food and drink consumed the day before each trial and refrained from drinking alcohol during this period. Participants replicated their dietary intake from the first trial in subsequent trials ensuring that meals were standardized across trials. Food diaries were analyzed by a registered dietitian to determine energy intake and macronutrient content. In addition, the participants were asked to remain inactive the day before each main trial. Participants wore a uniaxial accelerometer (Lifecoder-EX; Suzuken Co Ltd, Nagoya, Japan) to monitor daily activity during this period. The accelerometer defined 11 levels of activity intensity (0, 0.5, and 1–9), with 0 indicating the lowest intensity and 9 being the highest intensity. A level of 4 corresponds to an intensity of ~3 metabolic equivalents (26). In addition, total step count (steps per day) was recorded and calculated from the accelerometer using computerized software (Lifelyzer 05 Coach; Suzuken Co Ltd).
Study design
Each participant underwent three, 1-d laboratory-based trials in a randomized, counterbalanced order: 1) control, 2) continuous walking, and 3) multiple short bouts of walking. The interval between trials was 7–8 d. A schematic illustration of the study protocol is shown in Figure 1. Participants reported to the laboratory at 0745 h after a 10-h overnight fast (no food or drink except water). After a 15-min rest, a fasting venous blood sample was collected in a seated position by venipuncture at 0800 h. On all trials, participants were then fed a standardized meal for breakfast. For the control trial, participants then sat in a chair (reading, writing, working at a computer, or watching television) in the laboratory until 1600 h. For the continuous walking trial, participants rested for 40 min after breakfast before walking briskly for 30 min in the morning from 0900 to 0930 h and were then seated for the remainder of the trial. For the multiple short bouts of walking trial, participants rested for 40 min after consuming breakfast before performing twenty, 1.5-min bouts of brisk walking on a treadmill throughout the day. During each trial, participants consumed a standardized first test meal for breakfast after collecting the fasting blood samples by venipuncture. A clock was started when participants began eating. A second test meal was consumed for lunch 3 h after the initiation of the first meal. Further venous blood samples were collected by venipuncture at 2 h (1000 h), 4 h (1200 h), 6 h (1400 h), and 8 h (1600 h) after the initiation of breakfast for the measurement of circulating concentrations of TG, nonesterified fatty acids (NEFA), acetoacetic acids, total ketone bodies, apo B-48, apo B-100, preheparin LPL, glucose, and insulin.
FIGURE 1.
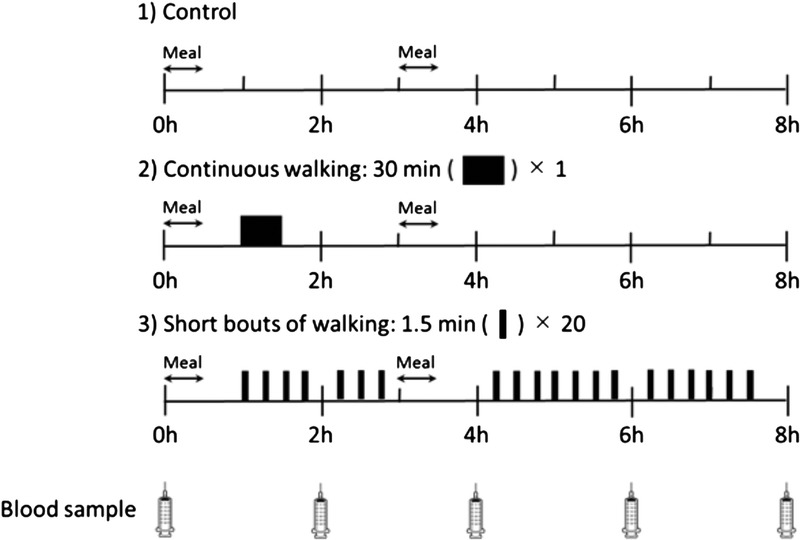
A schematic representation of the study protocol. For the control trial, participants sat in a chair (reading, writing, working at a computer, or watching television) in the laboratory until 1600 h. For the continuous walking trial, participants rested for 40 min after breakfast before walking briskly for 30 min in the morning from 0900 to 0930 h and were then seated for the remainder of the trial. For the multiple short bouts of walking trial, participants rested for 40 min after consuming breakfast before performing twenty, 1.5-min bouts of brisk walking on a treadmill throughout the day.
Exercise
On both exercise trials, the speed of walking was at a self-selected pace as determined by the preliminary visit. For the continuous walking trial, participants walked briskly for 30 min in the morning from 0900 to 0930 h. For the multiple short bouts of walking trial, participants walked on a treadmill throughout the day at 0900, 0915, 0930, 0945, 1015, 1030, 1045, 1215, 1230, 1245, 1300, 1315, 1330, 1345, 1415, 1430, 1445, 1500, 1515, and 1530 h. The spacing of the walks was every 15 min with three longer breaks to allow for blood sampling and consumption of a lunch. This timing was chosen because we have shown that a similar pattern of walking can reduce postprandial TG in healthy, postmenopausal women (11). Moreover, longer but less frequent bouts of regular activity, taken the previous or same day as high-fat or mixed meals have been consumed, can mitigate postprandial TG concentrations (11,14,15). Heart rate was monitored throughout both walking trials using short-range telemetry (Polar RS400; Polar Electro Oy, Espoo, Finland), and ratings of perceived exertion (RPE) were assessed periodically (27). Except for prescribed walking and toilet breaks, all trials followed the same format with participants seated throughout.
Test meals
A continental breakfast was provided as the first meal and consisted of white bread with butter, a salad (made of lettuce, tomato, and ham with an Italian dressing), scrambled egg (one egg with tomato ketchup and soybean oil), soup (made of whole milk with corn soup powder), apple, and yogurt. It provided 0.34 g fat, 1.13 g carbohydrate, 0.35 g protein, and 38 kJ energy per kilogram of body mass. Mean macronutrient content of the breakfast was 20.9 ± 3.8 g fat, 69.5 ± 12.6 g carbohydrate, and 21.5 ± 3.9 g protein, which provided 2.3 ± 0.4 MJ energy (35% from fat, 50% from carbohydrate, and 15% from protein). The test lunch consisted of a typical Japanese fish dish (made from grilled salmon), a bowl of white rice, soup (made with soybean curd, seaweed, soybean paste, and deep-fried soybean curd), and steamed vegetables (cabbage, carrot, cucumber, potato, and broccoli with a mayonnaise dressing) with ham and a cream cracker. It provided 0.34 g fat, 1.13 g carbohydrate, 0.35 g protein, and 38 kJ energy per kilogram of body mass. Mean macronutrient content of the lunch was 21.5 ± 3.9 g fat, 67.6 ± 12.2 g carbohydrate, and 20.9 ± 3.8 g protein, which provided 2.3 ± 0.4 MJ energy (35% from fat, 50% from carbohydrate, and 15% from protein). Participants were asked to consume each test meal within 30 min, and consumption time was recorded and replicated in subsequent trials. Mean time to consume breakfast and lunch was 16.1 ± 2.6 and 16.8 ± 2.1 min, respectively. None of the participants reported nausea or any gastrointestinal discomfort during or after either meal. Participants consumed water ad libitum during the first trial, and the pattern and volume ingested was replicated in subsequent trials. Average water intake was 783 ± 281 mL over 8 h.
Analytical methods
For serum TG, NEFA, acetoacetic acids, and total ketone body measurements, venous blood samples were collected into tubes containing clotting activators for isolation of serum. Thereafter, samples were allowed to clot for 30 min at room temperature and then centrifuged at 1861g for 10 min at 4°C. Serum was removed, divided into aliquots, and stored at −80°C for later analysis. For plasma apo B-48, apo B-100, preheparin LPL, and insulin measurements, venous blood samples were collected into tubes containing dipotassium salt–EDTA. For plasma glucose measurements, venous blood samples were collected into tubes containing sodium fluoride–EDTA. Thereafter, both tubes were immediately centrifuged and treated as previously mentioned. Enzymatic, colorimetric assays were used to measure serum TG (Pure Auto S TG-N; Sekisui Medical Co Ltd, Tokyo, Japan), serum NEFA (NEFA-HR; Wako Pure Chemical Industries, Ltd, Osaka, Japan), serum acetoacetic acid (KAINOS 3-HB; Kainos Laboratories, Inc, Tokyo, Japan), serum total ketone bodies (KAINOS TKB-L; Kainos Laboratories, Inc), and plasma glucose (GLU-HK(M); Shino-Test Corporation, Kanagawa, Japan). Enzyme-linked immunosorbent assays (ELISA) were used to measure plasma insulin (Mercodia Insulin ELISA; Mercodia AB, Uppsala, Sweden), apo B-48 (Human Apo B-48 ELISA; Shibayagi, Ishihara, Japan), apo B-100 (Human ApoB-100 assay kit; IBL, Gunma, Japan), and preheparin LPL (Lipoprotein lipase ELISA; Cell Biolabs, Inc, San Diego, CA). All analyses for each participant were completed within the same run for each measure. Intra-assay coefficients of variation were 0.3% for TG, 0.8% for NEFA, 1.5% for acetoacetic acids, 1.4% for total ketone bodies, 6.3% for apo B-48, 3.5% for apo B-100, 7.3% for preheparin LPL, 2.8% for insulin, and 0.4% for glucose.
Calculations and statistical analysis
Data were analyzed using the Predictive Analytics Software (PASW) version 23.0 for Windows (SPSS Japan Inc, Tokyo, Japan). The Shapiro–Wilk test was used to check for normality of distribution, and all parameters were found not to differ significantly from normal. Eight-hour total area under the serum or plasma concentration versus time curves (AUC) were calculated using the trapezium rule. The incremental AUC values were calculated using the same method after correcting for fasting (0 h) concentrations. Repeated-measures one-factor ANOVA was used to examine differences among the three trials for fasting serum or plasma concentrations, AUC values, and dietary and physical activity data. Repeated-measures two-factor ANOVA was used to examine differences among the three trials over time for serum or plasma constituents. Repeated-measures generalized estimating equations were used to adjust for potential confounding covariates (i.e., fasting serum TG concentrations and the step counts recorded the day before each main trial) when examining differences among the three trials for the TG total and incremental AUC values and to adjust for the influence of step counts on secondary outcome measures from serum and plasma. Where significant interactions were detected, post hoc multiple comparisons were made using the Bonferroni method. The 95% confidence intervals (CIs) for the mean absolute pairwise differences between trials were calculated using the t-distribution and degrees of freedom (n − 1). Absolute standardized effect sizes (ES) are provided to supplement the findings. Statistical significance was accepted at the 5% level. Results are reported as mean ± SD.
RESULTS
Dietary data
Energy intake for the day before the trials was 7.1 ± 1.1 MJ. Energy intake equated to 27% ± 17% (54.1 ± 36.2 g·d−1) from fat, 55% ± 15% (222.1 ± 67.5 g·d−1) from carbohydrate, and 18% ± 6% (66.6 ± 18.2 g·d−1) from protein.
Accelerometer data
The step counts recorded the day before the trials differed significantly among trials (7264 ± 2944 vs 9523 ± 4557 vs 9659 ± 2425 steps per day for the control, continuous walking, and multiple bouts of walking respectively; ES = 0.289, P = 0.033), but subsequent post hoc tests did not reveal where the between-trial differences were. For the day before each main trial, accelerometer recorded frequencies for light (levels 1–3; 55 ± 24 vs 59 ± 32 vs 68 ± 21 min·d−1 for the control, continuous walking, and multiple bouts of walking, respectively; ES = 0.202, P = 0.084), moderate (levels 4–6; 19 ± 13 vs 33 ± 26 vs 27 ± 19 min·d−1 for the control, continuous walking, and multiple short bouts of walking, respectively; ES = 0.242, P = 0.063), and vigorous (levels 7–9; 1 ± 1 vs 2 ± 2 vs 1 ± 1 min·d−1 for the control, continuous walking, and multiple bouts of walking, respectively; ES = 0.065, P = 0.477) activity did not differ significantly, although values for light and moderate activity tended to be higher on the exercise trials than on the control trial.
Responses during brisk walking
Self-selected brisk walking speed during the walking trials was 3.6 ± 0.2 km·h−1. The mean heart rate and RPE were significantly higher on the continuous walking trial (heart rate, 106 ± 14 bpm; RPE, 12 ± 2) than on the multiple short bouts of walking trial (heart rate, 92 ± 11 bpm; RPE, 11 ± 1; heart rate: 95% CI, 10–18 bpm (ES = 1.158; P < 0.001); RPE: 95% CI, 0.6–3.0 (ES = 1.099, P = 0.008)).
Fasting serum/plasma concentrations
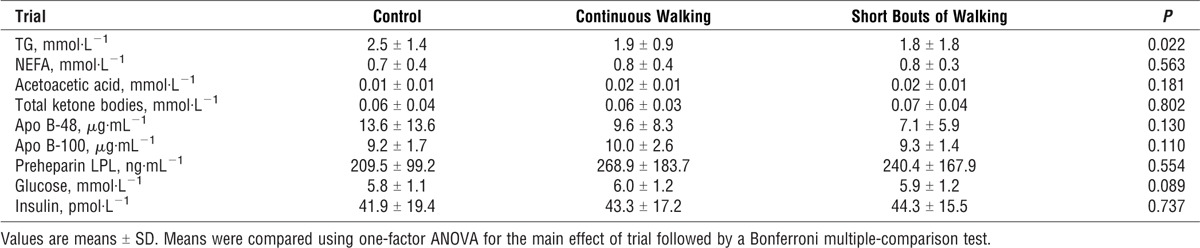
Fasting plasma and serum concentrations for each trial are shown in Table 1. One-factor ANOVA revealed that there was a significant difference among trials in fasting serum TG (P = 0.022). Subsequent post hoc tests did not reveal where the between-trial difference in fasting TG occurred (control vs continuous walking, P = 0.208; short bouts of walking vs control, P = 0.073; continuous walking vs short bouts of walking, P = 1.000). For fasting serum NEFA, acetoacetic acid, total ketone bodies, and plasma apo B-48, apo B-100, preheparin LPL, insulin, and glucose concentrations, there were no significant differences among trials.
TABLE 1.
Fasting concentrations of TG, NEFA, acetoacetic acids, total ketone bodies, apo B-48, apo B-100, preheparin LPL, insulin, and glucose during the control, continuous walking, and multiple short bouts of walking trials (n = 12).
Postprandial serum/plasma concentrations
Serum TG concentrations during each trial are shown in Figure 2. Serum TG concentrations differed significantly among trials (main effect of trial: ES = 0.465, P = 0.001), with post hoc tests indicating lower TG concentrations during the multiple bouts (95% CI, −2.228 to −0.181 mmol·L−1; ES = 0.763; P = 0.021) and continuous (95% CI, −2.043 to −0.221 mmol·L−1; ES = 0.707; P = 0.015) walking trials compared with the control trial. There were no significant differences in serum TG concentrations between walking trials (95% CI, −0.558 to 0.703 mmol·L−1; ES = 0.064; P = 1.000). For all trials, TG concentrations increased over the morning, peaking at 4 h after breakfast before falling in the afternoon (main effect of time: ES = 0.656, P < 0.001). However, the rate of increase in TG was greater on the control trial than on the walking trials during the first 4 h (trial–time interaction: ES = 0.262, P = 0.036). Subsequent post hoc tests revealed that TG was greater on the control trial than on the multiple bouts and continuous walking trials 4, 6, and 8 h after breakfast.
FIGURE 2.
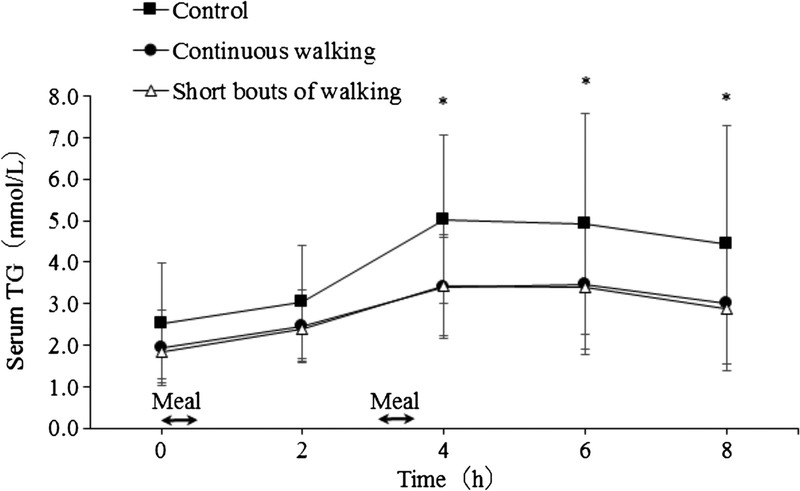
Fasting and postprandial serum TG concentrations during the control, continuous walking, and multiple short bouts of walking trials (n = 12). Data are means ± SD. The black arrows indicate the times that the test meals were consumed. Data were analyzed using two-factor ANOVA followed by a Bonferroni multiple-comparison test. There was a significant main effect of trial (P = 0.001), main effect of time (P < 0.001), and trial–time interaction (P = 0.036). *Significantly different from the short bouts of walking and continuous walking trials, P < 0.05.
The TG total AUC (Fig. 3) differed among trials (ES = 0.474, P = 0.001) and was 30% and 28% lower on the multiple short bouts of walking (95% CI, −18.024 to −1.596 mmol per 8 h·L−1; ES = 0.781; P = 0.019) and the continuous walking (95% CI, −16.541 to −2.102 mmol per 8 h·L−1; ES = 0.734; P = 0.012) trials than on the control trial, respectively. Similarly, the incremental AUC was 33% and 35% lower on the multiple short bouts of walking (95% CI, −7.966 to −0.535 mmol per 8 h·L−1; ES = 0.762; P = 0.024) and the continuous walking (95% CI, −7.566 to −1.570 mmol per 8 h·L−1; ES = 0.984; P = 0.004) trials than on the control trial, respectively. Because physical activity can potentially affect TG outcomes for 24–48 h, we examined the relationship between measures of physical activity on the day before each main trial, which differed among trials, and the TG total and incremental AUC on all trials. No significant correlation was seen for step counts (r = −0.157, P = 0.360), or time spent in light (r = −0.014, P = 0.933), moderate (r = −0.237, P = 0.171), or vigorous (r = −0.106, P = 0.539) physical activity with TG total AUC. A similar finding was seen for the relationships between step counts, and light and vigorous physical activity with TG incremental AUC (all P > 0.1), although moderate physical activity did tend to be negatively associated with incremental AUC (r = −0.323, P = 0.058). When moderate physical activity was placed into a linear regression, however, it did not significantly explain any proportion of the TG incremental AUC (P = 0.116). Furthermore, generalized estimating equations for the TG total AUC after adjusting for fasting TG concentrations differed among trials (P < 0.001) and were lower on the multiple short bouts of walking (95% CI, −16.5 to −3.1 mmol per 8 h·L−1; P = 0.001) and the continuous walking (95% CI, −15.2 to −3.5 mmol per 8 h·L−1; P < 0.001) trials than on the control trial. Similarly, the TG incremental AUC was lower on the multiple short bouts of walking (95% CI, −7.3 to −1.2 mmol per 8 h·L−1; P = 0.002) and the continuous walking (95% CI, −7.0 to −2.1 mmol per 8 h·L−1; P < 0.001) trials than on the control trial. These findings were also confirmed by the generalized estimating equation analysis after adjusting for the step counts recorded the day before each main trial (data not shown).
FIGURE 3.
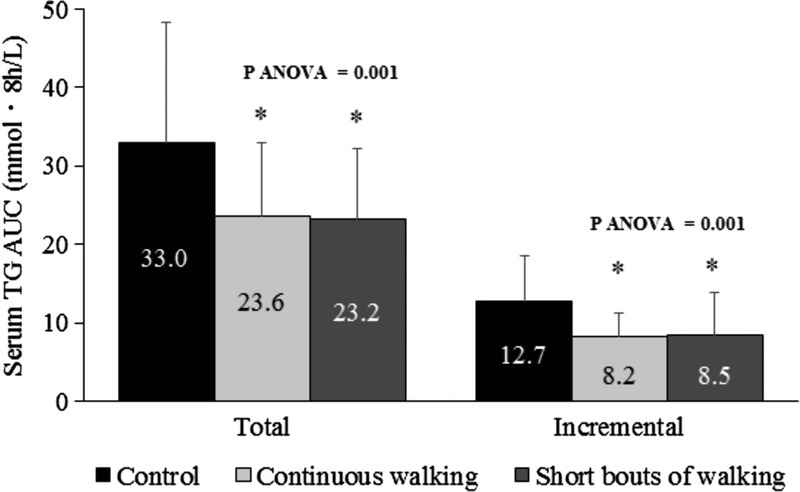
Serum TG total (AUC)/incremental area under the curve (iAUC) values over 8 h after the consumption of the test meals in the control, continuous walking, and multiple short bouts of walking trials (n = 12). Data are means ± SD. Means were compared using one-factor ANOVA for the main effect of trial followed by a Bonferroni multiple-comparison test. *Significantly different from the control, P < 0.05.
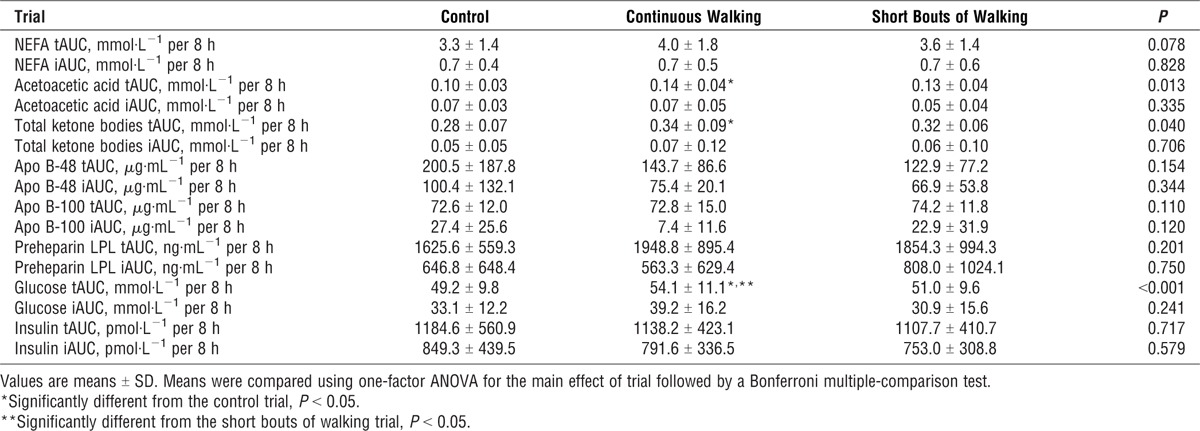
The 8-h total and incremental AUC values for NEFA, acetoacetic acid, total ketone bodies, apo B-48, apo B-100, preheparin LPL, insulin, and glucose are shown in Table 2. For acetoacetic acids, total AUC was greater on the continuous walking trial compared with the control trial (P = 0.014). In a similar manner, total ketone body AUC concentrations were higher on the continuous walking trial than on the control trial (P = 0.032). The 8-h total glucose concentrations were greater on the continuous walking trial than on the control (P = 0.007) or multiple short bouts of walking (P = 0.016) trials. The NEFA, apo B-48, apo B-100, preheparin LPL, and insulin total and incremental AUC values did not differ among the trials. The use of generalized estimating equations adjusting for the influence of step counts on these AUC measures did not change these differences.
TABLE 2.
Serum NEFA, acetoacetic acids, total ketone bodies, apo B-48, apo B-100, preheparin LPL, and plasma insulin, and glucose total (t) and incremental (i) area AUC values over 8 h after the consumption of the test meals in the control, continuous walking, and multiple short bouts of walking trials (n = 12).
DISCUSSION
The present study is, to our knowledge, the first to compare how different patterns of brisk walking influence serum TG in postmenopausal, older women with hypertriglyceridemia. Our findings indicate that accumulating 30 min of brisk walking in short (1.5 min) bouts is as effective in attenuating postprandial TG concentrations as the same volume of exercise taken in a continuous pattern. These findings support previous observations from studies in healthy adults (9,10,12) and add to a growing body of evidence substantiating public health recommendations on accumulating physical activity for health (1,3,28). Moreover, our study design is supportive of the many emerging studies that show the benefit of interrupting sedentary time with regular activity breaks on improved glycemic control over a day (19–22) (for a review of these, see Ref. [29]). The present study is one of few to demonstrate a beneficial effect on same-day postprandial TG excursions (11,12,21), and the observation is important because potentially postprandial glucose and TG control might be achieved in tandem.
We found comparable reductions in the TG incremental AUC over 8 h with either twenty, 1.5-min bouts of brisk walking (33%) or one, 30-min bout of brisk walking (35%) of equal intensity in older women with hypertriglyceridemia. Our findings are consistent with previous studies employing active young (9,10) and sedentary middle-age individuals (7,12). Moreover, our data corroborate experimental studies and meta-analyses that demonstrate that the energy expenditure of exercise is the primary determinant of the extent of exercise-induced reductions in postprandial TG (24) irrespective of the pattern of exercise. Our data are of value in showing that short bouts of physical activity accumulated throughout a day could provide additional benefit to cardiovascular disease risk factors. In addition, given that high levels of physical activity seem to eliminate the increased risk for death associated with high sitting time (18), our data may imply that increased regular physical activity irrespective of the pattern of exercise could beneficially modify disease risk markers.
The reduction of postprandial TG concentrations after exercise observed in the present study may have been mediated via several mechanisms. One is increased muscle LPL activity, which is a major factor for the removal of TG from the circulation (30). However, no differences in circulating concentrations of inactive monomeric LPL or insulin, which can suppress LPL activity in skeletal muscle, were observed among the three trials. Thus, the single-day design of the present study may have meant that increases in LPL activity in the two exercise trials were not yet apparent because the activity of this enzyme is thought not to peak until ≥8 h after exercise (30). Rather, the sitting on the control trial may have been more important in our study because observations in rats have shown 10- to 20-fold decreases in LPL activity in red oxidative muscle and 50% decreases in white glycolytic muscle, which begin to occur within 4–6 h of initiating inactivity (31). These alterations in LPL activity occur without any change in the messenger RNA expression of the enzyme, and the time course of 4–6 h is well within that of the present experiment.
Alternatively, more recently, it has been proposed that reductions in VLDL-TG result from improved clearance from the circulation after exercise, because these particles become TG enriched increasing their affinity for LPL–mediated hydrolysis (32). This mechanism may have been present here, but our assays were unable to distinguish changes in the size of VLDL particles and did not directly measure LPL activity but rather concentration. A final possibility is that increases in circulating blood flow may also have enhanced TG clearance by increasing the exposure of LPL to circulating TG in lipoproteins (12), a mechanism that may be of more importance in a 1- than 2-d design.
Another potential mechanism for the TG reductions seen during the exercise trials is reduced secretion of hepatic VLDL (33). Postprandial apo B-100 concentrations did not differ among the three trials but total ketone bodies (a marker for hepatic fatty acid oxidation), including acetoacetic acids, were elevated, particularly with continuous exercise. Thus, hepatic fatty acid availability for incorporation into VLDL-TG may have been reduced with exercise. An alternative explanation is that postprandial exercise impeded or slowed the entry of chylomicrons into the circulation because the rate of increase in TG concentrations was greater in the first 4 h after breakfast in the control trial. However, postprandial apo B-48 concentrations did not differ among the three trials in the present study, which is consistent with previous observations measuring TG concentrations directly in the chylomicron fraction with exercise (34).
In contrast to TG reductions with both patterns of walking and in contrast with many recent studies (19–22), there were no improvements in postprandial glucose or insulin. It is worth noting that the glucose total AUC was greater in the continuous walking trial than in the short bouts of walking and control trials in the present study, a similar observation to our previous study in healthy postmenopausal women who completed the same exercise protocol (11). It is likely that when exercise is performed in the postprandial state that rates of glucose appearance from both exogenous and endogenous sources supersede the rate of glucose clearance into muscle and that glycemic responses to second meals are elevated, a phenomenon documented by others (35). This phenomenon may be part adrenaline-induced hyperglycemia, which can occur with prolonged or intense exercise (36). Indeed, higher mean HR and RPE were observed in the continuous walking than in the short bouts of walking trial in the present study. Thus, brisk walking for 30 min continuously may be harder exercise than accumulating the same amount of walking in these inactive, older individuals. Other studies that interrupted sitting time with short bouts of light- or moderate-intensity exercise (≤3 min) have found that exercise during the postprandial period attenuates postprandial glucose and insulin (21,22,25). The discrepancy among studies (21,22,25) may be partly explained by the genetic background of the participants because we studied Japanese participants, whereas all other studies have examined participants from Western countries (21,22,25). East Asians have been shown to have limited innate capacity for insulin secretion compared with Caucasians (37). This is similar to other Asian populations, such as South Asians, who have lower insulin sensitivity than Europeans (38). Thus, carbohydrate metabolism in response to exercise may differ between ethnic groups.
This study has several strengths. First, we examined postmenopausal, older women with hypertriglyceridemia, whereas few previous studies examining the effects of exercise on TG have employed at-risk older adults (24). Perturbations in TG concentrations after meals are more likely to be exaggerated in such individuals compared with their healthy younger peers (39). Second, Asian (Japanese) women were employed in the present study. The effects of exercise on postprandial TG have been studied less frequently in women than in men, perhaps because of the need to control for the menstrual cycle in premenopausal women. Moreover, most studies examining the effects of exercise on postprandial TG have employed populations of white European descent (for a review of these, see Ref. [15]) with only a small number of studies in Asians (8,11,40). A recent review suggests that while nonwhite populations do receive health benefit from increased physical activity levels, the ideal physical activity required to lower cardiometabolic disease risk may differ by ethnic group (41). Indeed, South Asians require a greater amount of physical activity to gain a similar cardiometabolic risk profile to that of individuals of white European descent (42). At least two studies have directly examined this issue for postprandial TG. Although there was a greater elevation in TG after meals in South Asian than in white European men (43,44), acute exercise was equally effective for reducing TG concentrations in both populations (43) and the extent of the reduction may be even greater in South Asians than in white Europeans (44). No similar comparison has been made with individuals of East Asian origin that we are aware of. Thus, future studies should better characterize the TG responses to exercise in different ethnic groups. Third, although the investigation of the mechanism underlying exercise-induced reductions in postprandial TG was not our primary purpose, we examined various markers of postprandial TG metabolism, including acetoacetic acid, apo B-48, apo B-100, and preheparin LPL, which have not been examined in previous studies on accumulated exercise and postprandial TG (6–11). Finally, the magnitude of reduction in postprandial TG observed after multiple short bouts of exercise in the present study was large (~33%) compared with those observed in other studies with healthy individuals (~27%) (11–13). Although the clinical significance of our findings is uncertain, the finding is important because such a reduction by exercise may be equally, if not more, effective for reducing the risk for ischemic heart disease (30%–40%) than that seen with pharmaceutical therapy (45). Indeed, an epidemiological study has shown that nonfasting TG concentrations are predictive of risk for ischemic heart disease in Japanese men and women (4). Thus, it is feasible to speculate that the reduction in postprandial TG observed in the present study could have important public health implications with respect to cardiovascular disease risk.
This study has several limitations. The use of a single-day design to compare the immediate (same-day) effect of different patterns of walking on postprandial TG metabolism may have provided insufficient time for an elevation in LPL activity as previously discussed. Another limitation is the relatively small sample size, which may explain the lack of statistical significance for our secondary outcomes, including glucose and insulin. A third limitation is the standardization of the participants’ pretrial physical activity. Although the total and incremental TG AUC values after adjusting for fasting TG concentrations or the step counts recorded the day before each main trial were lower on the multiple short bouts of walking and the continuous walking trials than on the control trial, differences in activity levels, including step counts, which were higher the day before the exercise trials, could have influenced LPL activation and therefore enhanced TG clearance during the walking trials.
In conclusion, 30 min of continuous brisk walking or the same amount of walking achieved by accumulating very short (1.5 min) bouts of walking over the course of a day can attenuate postprandial TG concentrations in physically inactive, postmenopausal, older women with hypertriglyceridemia. These findings substantiate recommendations in physical activity guidelines that similar health benefits can be obtained through accumulated versus continuous activity in at-risk older adults.
Acknowledgments
This study was supported by Waseda University Grant for Special Research Projects (2016B-258, 2016-2017) and MEXT-Supported Program for the Strategic Research Foundation at Private Universities, 2015-2019, from the Ministry of Education, Culture, Sports, Science, and Technology (S1511017). D. J. S. acknowledges support from the National Institute for Health Research Leicester Biomedical Research Centre, which is a partnership between University Hospitals of Leicester NHS Trust, Loughborough University, and the University of Leicester.
All authors declare that there is no conflict of interest. The results of the present study do not constitute endorsement by the American College of Sports Medicine. All authors declare that the findings of the present study are presented clearly, honestly, and without fabrication, falsification, or inappropriate data manipulation.
REFERENCES
- 1.Haskell WL, Lee IM, Pate RR, et al. Physical activity and public health: updated recommendation for adults from the American College of Sports Medicine and the American Heart Association. Med Sci Sports Exerc. 2007;39(8):1423–34. [DOI] [PubMed] [Google Scholar]
- 2.World Health Organization. Global Recommendations on Physical Activity for Health. Geneva (Switzerland): World Health Organization; 2010. [cited 7 February 2017]. Available from: http://www.who.int/409dietphysicalactivity/publications/9789241599979/en. [PubMed] [Google Scholar]
- 3.US Department of Health and Human Services. Physical Activity Guidelines Advisory Committee Report. Washington (DC): US Department of Health and Human Services; 2008. p. 35. [Google Scholar]
- 4.Iso H, Imano H, Yamagishi K, et al. Fasting and non-fasting triglycerides and risk of ischemic cardiovascular disease in Japanese men and women: the Circulatory Risk in Communities Study (CIRCS). Atherosclerosis. 2014;237(1):361–8. [DOI] [PubMed] [Google Scholar]
- 5.Nordestgaard BG, Varbo A. Triglycerides and cardiovascular disease. Lancet. 2014;384(9943):626–35. [DOI] [PubMed] [Google Scholar]
- 6.Altena TS, Michaelson JL, Ball SD, Thomas TR. Single sessions of intermittent and continuous exercise and postprandial lipemia. Med Sci Sports Exerc. 2004;36(8):1364–71. [DOI] [PubMed] [Google Scholar]
- 7.Gill JM, Murphy MH, Hardman AE. Postprandial lipemia: effects of intermittent versus continuous exercise. Med Sci Sports Exerc. 1998;30(10):1515–20. [DOI] [PubMed] [Google Scholar]
- 8.Miyashita M. Effects of continuous versus accumulated activity patterns on postprandial triacylglycerol concentrations in obese men. Int J Obes (Lond). 2008;32(8):1271–8. [DOI] [PubMed] [Google Scholar]
- 9.Miyashita M, Burns SF, Stensel DJ. Accumulating short bouts of brisk walking reduces postprandial plasma triacylglycerol concentrations and resting blood pressure in healthy young men. Am J Clin Nutr. 2008;88(5):1225–31. [DOI] [PubMed] [Google Scholar]
- 10.Miyashita M, Burns SF, Stensel DJ. Exercise and postprandial lipemia: effect of continuous compared with intermittent activity patterns. Am J Clin Nutr. 2006;83(1):24–9. [DOI] [PubMed] [Google Scholar]
- 11.Miyashita M, Edamoto K, Kidokoro T, et al. Interrupting sitting time with regular walks attenuates postprandial triglycerides. Int J Sports Med. 2016;37(2):97–103. [DOI] [PubMed] [Google Scholar]
- 12.Murphy MH, Nevill AM, Hardman AE. Different patterns of brisk walking are equally effective in decreasing postprandial lipaemia. Int J Obes Relat Metab Disord. 2000;24(10):1303–9. [DOI] [PubMed] [Google Scholar]
- 13.Miyashita M, Burns SF, Stensel DJ. An update on accumulating exercise and postprandial lipaemia: translating theory into practice. J Prev Med Public Health. 2013;46(1 Suppl):S3–11. [DOI] [PMC free article] [PubMed] [Google Scholar]
- 14.Murphy MH, Blair SN, Murtagh EM. Accumulated versus continuous exercise for health benefit: a review of empirical studies. Sports Med. 2009;39(1):29–43. [DOI] [PubMed] [Google Scholar]
- 15.Peddie MC, Rehrer NJ, Perry TL. Physical activity and postprandial lipidemia: are energy expenditure and lipoprotein lipase activity the real modulators of the positive effect? Prog Lipid Res. 2012;51(1):11–22. [DOI] [PubMed] [Google Scholar]
- 16.Hardman AE. Accumulation of physical activity for health gains: what is the evidence? Br J Sports Med. 1999;33(2):87–92. [DOI] [PMC free article] [PubMed] [Google Scholar]
- 17.Biswas A, Oh PI, Faulkner GE, et al. Sedentary time and its association with risk for disease incidence, mortality, and hospitalization in adults: a systematic review and meta-analysis. Ann Intern Med. 2015;162(2):123–32. [DOI] [PubMed] [Google Scholar]
- 18.Ekelund U, Steene-Johannessen J, Brown WJ, et al. Does physical activity attenuate, or even eliminate, the detrimental association of sitting time with mortality? A harmonised meta-analysis of data from more than 1 million men and women. Lancet. 2016;388(10051): 1302–10. [DOI] [PubMed] [Google Scholar]
- 19.Bailey DP, Locke CD. Breaking up prolonged sitting with light-intensity walking improves postprandial glycemia, but breaking up sitting with standing does not. J Sci Med Sport. 2015;18(3):294–8. [DOI] [PubMed] [Google Scholar]
- 20.Dempsey PC, Blankenship JM, Larsen RN, et al. Interrupting prolonged sitting in type 2 diabetes: nocturnal persistence of improved glycaemic control. Diabetologia. 2017;60(3):499–507. [DOI] [PubMed] [Google Scholar]
- 21.Dempsey PC, Larsen RN, Sethi P, et al. Benefits for type 2 diabetes of interrupting prolonged sitting with brief bouts of light walking or simple resistance activities. Diabetes Care. 2016;39(6):964–72. [DOI] [PubMed] [Google Scholar]
- 22.Dunstan DW, Kingwell BA, Larsen R, et al. Breaking up prolonged sitting reduces postprandial glucose and insulin responses. Diabetes Care. 2012;35(5):976–83. [DOI] [PMC free article] [PubMed] [Google Scholar]
- 23.Karpe F, Hellénius ML, Hamsten A. Differences in postprandial concentrations of very-low-density lipoprotein and chylomicron remnants between normotriglyceridemic and hypertriglyceridemic men with and without coronary heart disease. Metabolism. 1999;48(3):301–7. [DOI] [PubMed] [Google Scholar]
- 24.Freese EC, Gist NH, Cureton KJ. Effect of prior exercise on postprandial lipemia: an updated quantitative review. J Appl Physiol (1985). 2014;116(1):67–75. [DOI] [PubMed] [Google Scholar]
- 25.Peddie MC, Bone JL, Rehrer NJ, Skeaff CM, Gray AR, Perry TL. Breaking prolonged sitting reduces postprandial glycemia in healthy, normal-weight adults: a randomized crossover trial. Am J Clin Nutr. 2013;98(2):358–66. [DOI] [PubMed] [Google Scholar]
- 26.Kumahara H, Schutz Y, Ayabe M, et al. The use of uniaxial accelerometry for the assessment of physical-activity–related energy expenditure: a validation study against whole-body indirect calorimetry. Br J Nutr. 2004;91(2):235–43. [DOI] [PubMed] [Google Scholar]
- 27.Borg GA. Perceived exertion: a note on “history” and methods. Med Sci Sports. 1973;5(2):90–3. [PubMed] [Google Scholar]
- 28.UK Department of Health. At Least Five a Week: Evidence on the Impact of Physical Activity. London: UK Department of Health; 2004. p. 27. [Google Scholar]
- 29.Dempsey PC, Owen N, Yates TE, Kingwell BA, Dunstan DW. Sitting less and moving more: improved glycaemic control for type 2 diabetes prevention and management. Curr Diab Rep. 2016;16(11):114. [DOI] [PubMed] [Google Scholar]
- 30.Seip RL, Semenkovich CF. Skeletal muscle lipoprotein lipase: molecular regulation and physiological effects in relation to exercise. Exerc Sport Sci Rev. 1998;26:191–218. [PubMed] [Google Scholar]
- 31.Hamilton MT, Hamilton DG, Zderic TW. Exercise physiology versus inactivity physiology: an essential concept for understanding lipoprotein lipase regulation. Exerc Sport Sci Rev. 2004;32(4):161–6. [DOI] [PMC free article] [PubMed] [Google Scholar]
- 32.Ghafouri K, Cooney J, Bedford DK, Wilson J, Caslake MJ, Gill JM. Moderate exercise increases affinity of large very low-density lipoproteins for hydrolysis by lipoprotein lipase. J Clin Endocrinol Metab. 2015;100(6):2205–13. [DOI] [PubMed] [Google Scholar]
- 33.Gill JM, Frayn KN, Wootton SA, Miller GJ, Hardman AE. Effects of prior moderate exercise on exogenous and endogenous lipid metabolism and plasma factor VII activity. Clin Sci (Lond). 2001;100(5):517–27. [PubMed] [Google Scholar]
- 34.Aoi W, Yamauchi H, Iwasa M, et al. Combined light exercise after meal intake suppresses postprandial serum triglyceride. Med Sci Sports Exerc. 2013;45(2):245–52. [DOI] [PubMed] [Google Scholar]
- 35.Gonzalez JT, Veasey RC, Rumbold PL, Stevenson EJ. Breakfast and exercise contingently affect postprandial metabolism and energy balance in physically active males. Br J Nutr. 2013;110(4):721–32. [DOI] [PubMed] [Google Scholar]
- 36.Marliss EB, Vranic M. Intense exercise has unique effects on both insulin release and its roles in glucoregulation: implications for diabetes. Diabetes. 2002;51(1 Suppl):S271–83. [DOI] [PubMed] [Google Scholar]
- 37.Kodama K, Tojjar D, Yamada S, Toda K, Patel CJ, Butte AJ. Ethnic differences in the relationship between insulin sensitivity and insulin response: a systematic review and meta-analysis. Diabetes Care. 2013;36(6):1789–96. [DOI] [PMC free article] [PubMed] [Google Scholar]
- 38.Hall LM, Moran CN, Milne GR, et al. Fat oxidation, fitness and skeletal muscle expression of oxidative/lipid metabolism genes in South Asians: implications for insulin resistance? PLoS One. 2010;5(12):e14197. [DOI] [PMC free article] [PubMed] [Google Scholar]
- 39.Fisher RM, Coppack SW, Gibbons GF, Frayn KN. Post-prandial VLDL subfraction metabolism in normal and obese subjects. Int J Obes Relat Metab Disord. 1993;17(5):263–9. [PubMed] [Google Scholar]
- 40.Tan MS, Mok A, Yap MC, Burns SF. Effect of sprint interval versus continuous cycling on postprandial lipaemia. J Sports Sci. 2013;31(9):989–95. [DOI] [PubMed] [Google Scholar]
- 41.Gill JM, Celis-Morales CA, Ghouri N. Physical activity, ethnicity and cardio-metabolic health: does one size fit all? Atherosclerosis. 2014;232(2):319–33. [DOI] [PubMed] [Google Scholar]
- 42.Iliodromiti S, Ghouri N, Celis-Morales CA, Sattar N, Lumsden MA, Gill JM. Should physical activity recommendations for South Asian adults be ethnicity-specific? Evidence from a cross-sectional study of South Asian and white European men and women. PLoS One. 2016;11(8):e0160024. [DOI] [PMC free article] [PubMed] [Google Scholar]
- 43.Arjunan SP, Bishop NC, Reischak-Oliveira A, Stensel DJ. Exercise and coronary heart disease risk markers in South Asian and European men. Med Sci Sports Exerc. 2013;45(7): 1261–8. [DOI] [PubMed] [Google Scholar]
- 44.Arjunan SP, Deighton K, Bishop NC, et al. The effect of prior walking on coronary heart disease risk markers in South Asian and European men. Eur J Appl Physiol. 2015;115(12):2641–51. [DOI] [PubMed] [Google Scholar]
- 45.Robins SJ, Collins D, Wittes JT, et al. Relation of gemfibrozil treatment and lipid levels with major coronary events: VA-HIT: a randomized controlled trial. JAMA. 2001;285(12):1585–91. [DOI] [PubMed] [Google Scholar]