Abstract
Study Design.
This was a retrospective study focusing on dynamic contrast-enhanced magnetic resonance imaging (DCE-MRI) to assess treatment response in patients with spinal metastases.
Objective.
To demonstrate DCE-MRI changes before and after radiation treatment and correlating with other imaging and clinical findings.
Summary of Background Data.
Currently, conventional imaging is limited in evaluating early treatment success or failure, which impacts patient care.
Methods.
Consecutive patients with known spinal metastases underwent DCE-MRI before and after radiotherapy. Perfusion data on 19 lesions were analyzed. Radiotherapy was classified as success (n = 17) or failure (n = 2) on the basis of evidence of tumor contraction (n = 4), negative positron emission tomography (n = 2), or stability for more than 11 months (n = 11). Perfusion parameters blood plasma volume (Vp), time-dependent leakage (Ktrans), area under the curve, and peak enhancement were derived from the signal intensity-time curves and changes in parameter values from pre- to post-treatment were calculated. Curve morphologies were also qualitatively assessed in 13 pre- and 13 post-treatment scans.
Results.
Vp was the strongest predictor of treatment response (false-positive rate = 9.38 × 10⁻⁹ and false-negative rate = 0.055). All successfully treated lesions showed decreases in Vp, and the 2 treatment failures showed drastic increases in Vp. Changes in area under the curve and peak enhancement demonstrated similar relationships to the observed treatment response, whereas changes in Ktrans showed no significant relationship. Signal intensity curve morphologies also demonstrated specificity for active disease (11 of 13) and treated disease (8 of 13).
Conclusion.
Changes in perfusion, particularly Vp, reflect tumor responses to radiotherapy in spinal bone metastases. These changes were able to predict positive outcomes earlier than 6 months after treatment in 16 of 17 tumors. The ability of DCE-MRI to detect early treatment response has the potential to improve patient care and outcome.
Keywords: spinal metastases, perfusion, dynamic contrast-enhanced (DCE) MRI, radiotherapy, permeability, plasma volume
The skeletal system is the third most common site of cancer metastasis after the lung and the liver, and the most common site of skeletal involvement is the spine.1 Spinal metastases develop and cause substantial morbidity in 5% to 10% of patients with cancer. Magnetic resonance imaging (MRI) has become the “gold standard” imaging modality for the detection and evaluation of spinal neoplasms.2 Images acquired using T1-weighted and short-tau inversion recovery sequences allow very accurate detection of spinal metastases3 but are limited for the purpose of treatment follow-up.4–7
New contrast mechanisms have emerged in recent years that enable the investigation of physiological parameters. In particular, dynamic contrast-enhanced (DCE) MRI perfusion imaging provides functional information on tumor vascularity and hemodynamics. This technique involves rapid intravenous injection of gadolinium diethylene triamine pentaacetic acid (Gd-DTPA), measured with a dynamic T1-weighted imaging sequence. Pharmacokinetic modeling of contrast agent uptake is applied to the measured signal intensity changes (ΔSI) over time, allowing for the quantitative estimation of vascular characteristics. In a 2-compartment kinetic model8–10 based on the exchange of contrast between the vascular and interstitial spaces, contrast agent is initially assumed to be distributed in the blood plasma volume (Vp), with a time-dependent leakage (Ktrans) into the interstitial space. The relationship between these kinetic parameters and the ΔSI on dynamic imaging is mathematically determined and thus provides quantitative estimation of vascular characteristics—for instance, Vp estimates tumor vascularity and Ktrans estimates vessel permeability. Additional parameters such as peak enhancement (PE) and area under the curve (AUC) are also derived directly from the SI curve and characterize the influx of contrast to the region of interest.
There are no established functional imaging criteria for the assessment of response of metastatic bone lesions. This study examines 2 model-based perfusion parameters, Ktrans and Vp, as well as SI curve descriptors PE and AUC. We hypothesize that these parameters will change significantly in spine metastases after irradiation and that the changes in perfusion will be significantly different in cases of treatment success versus treatment failure.
MATERIALS AND METHODS
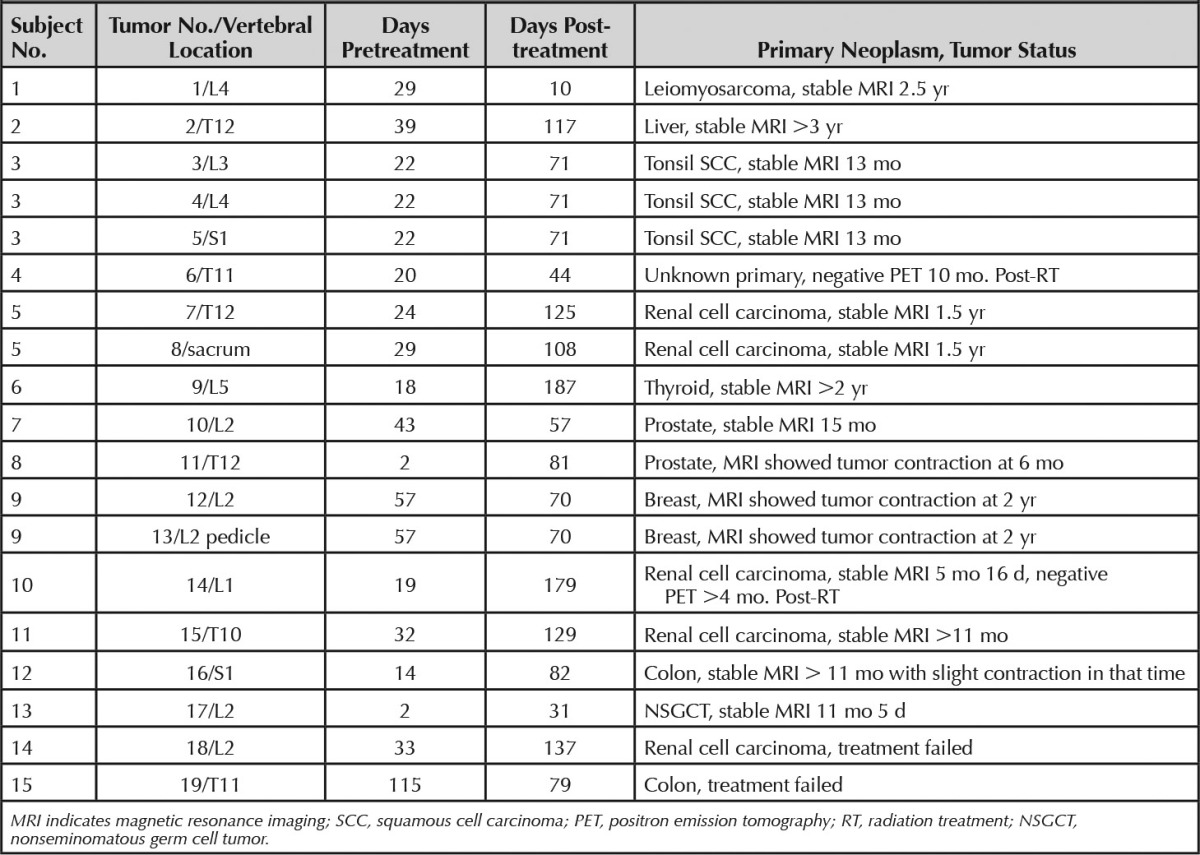
This retrospective study was granted a waiver of authorization from the institutional review board in full compliance with Health Insurance Portability and Accountability Act regulations. Consecutive patients with known spinal metastases underwent DCE-MRI in addition to the routine MRI assessment from January 2008 to March 2011. Patients who received external beam radiation therapy were eligible for this study. Those who underwent surgery or kyphoplasty in the area of interest were also excluded. DCE-MRI data were analyzed for 19 tumors from 15 patients. Seventeen tumors from 13 patients were classified as cases of successful treatment. Treatment success was assessed by evidence of tumor contraction, negative positron emission tomographic-computed tomographicscan, or long-term tumor stability. Contraction of a lesion on MRI was defined as either decreased size of the outer borders of the abnormal signal lesion or increasing treatment changes within the lesion such as areas of normalizing marrow signal or fat (n = 4). Normalization of fludeoxyglucose uptake defined treatment success if the MRI findings were equivocal (n = 2). For lesions that remained stable both in size and in internal SI, more than 11 months without change was used to determine treatment success (n = 11). Two lesions from 2 patients progressed despite radiotherapy and were classified as treatment failures. For each tumor, postprocessing analysis was performed on the pre- and post-treatment scans closest to the time of radiotherapy. Table 1 lists scanning time intervals, primary neoplasms, and details on tumor status for each lesion.
TABLE 1.
Clinical Data
MRI studies were acquired with a 1.5T scanner (GE Healthcare, Milwaukee, WI), using an 8-channel cervical-thoracic-lumbar surface spinal coil. Routine MRI assessment involved axial and sagittal T1 (repetition time [TR] = 400 ms, echo delay time [TE] = 14 ms) and T2 (TR = 3000 ms, TE = 131 ms), short-tau inversion recovery (TR = 4000 ms, TE = 68 ms, inversion time [TI] = 150 ms) and T1 with DCE, followed by postcontrast T1. T1-weighted DCE-MR images were obtained with 3-dimensional fast spoiled gradient recalled with number of phases = 80, temporal resolution = 6.5 seconds, TR = 3.6 seconds, TE = 1.1 seconds, slice thickness = 10 mm with no gap, flip angle = 25°, field of view = 34 cm, and matrix size = 256 × 128 in the sagittal plane. The first 5 time points were acquired to establish a precontrast T1 value. At the fifth acquisition, Gd-DTPA at a dose of 0.1 mmol/kg of body weight was administered at a rate of 2.5 mL/s by power injector.
Data pre- and postprocessing were obtained using dynamic image-processing software (NordicICE: version 2.3; NordicNeuroLab [NNL], Bergen, Norway). Preprocessing steps included background noise removal, spatial and temporal filtering, and automatic detection of the arterial input function (AIF) from the aorta. AIF was individually measured in each acquisition of every patient. Proper shape of the AIF curve was verified visually before processing steps continued. The Tofts 2-compartment pharmacokinetic model was applied for calculation of parameters Vp and Ktrans, AUC, and PE.8
Because anatomic images did not match exactly for all subjects, regions of interest (ROIs) were drawn freehand by the same investigator in the tumor area around hot spots on the perfusion maps, which defined regions of higher overall perfusion. If tumor was present in multiple slices, ROI values were determined for each slice and averaged to yield a final parameter value.
Values obtained in each lesion before and after radiotherapy were compared in terms of percent change, calculated as
For each parameter, the difference between the mean percent changes for the treatment-success and treatment-failure groups was assessed using the Mann-Whitney U test (2-tailed) evaluated. This level was achieved after a Bonferroni adjustment. To assess the parameters as predictors of treatment response, we constructed a classification scheme to predict treatment success versus failure. In this scheme, we used Δparameter = 0 as a cutoff value so that a decrease in the parameter value after radiotherapy (Δparameter < 0) predicts treatment success and an increase (Δparameter > 0) predicts treatment failure. To assess the sensitivity and specificity of this classification scheme, we assumed that Δparameter values are drawn from either of 2 Gaussian distributions: fs(x) denotes the probability distribution function of Δparameter for the treatment-success group and ff(x) for the treatment-failure group. Given a cutoff value of Δparameter = 0, we used the t statistic to estimate the false-positive probability  and false-negative probability
  . The terminology used in this article defines a “positive” test result as a prediction of treatment failure and a “negative” test result as a prediction of treatment success.
SI-time curves were also measured in tumor hot spots before and after radiotherapy and compared. From the 17 successfully treated cases, 13 pretreatment SI curves and 13 post-treatment SI curves were assessed (4 pretreatment and 4 post-treatment scans were too short to allow assessment of outflow patterns). Curve morphologies in active and treated tumors were examined for similarity to 2 general curve types described previously by Chen et al11 as specific for either metastatic disease or general inflammation.
RESULTS
Of the 4 parameters (Vp, Ktrans, AUC, and PE), Vp was the best predictor of treatment response (Figure 1). After radiotherapy, a decrease in Vp was observed in all 17 successfully treated tumors (mean ΔVp=−65.66%; range, −21.31% to −99.26%). Conversely, drastic increases in Vp were demonstrated in the 2 cases of treatment failure (ΔVp= 145.27% and 206.79%). The difference between the means of ΔVp in the 2 groups was significant (P = 0.01, 2-tailed). The false-positive rate of Vp as a predictor was 9.38 × 10⁻⁹ and the false-negative rate was 0.055.
Figure 1.
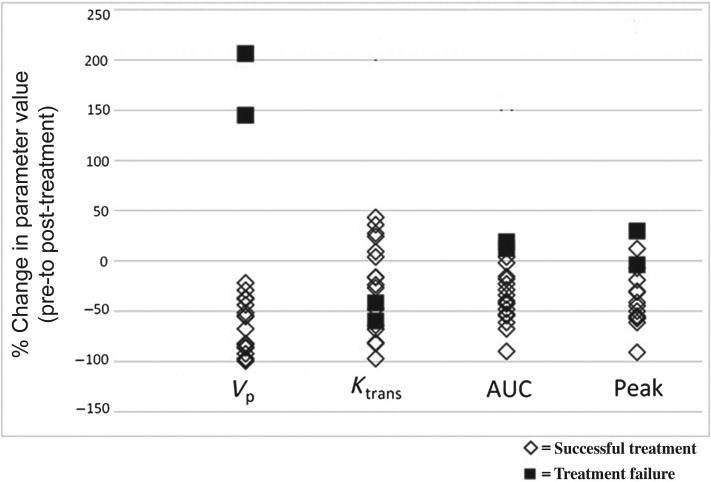
Scatter plot showing percent change of each parameter. One outlier from each of ΔKtrans, ΔAUC, and ΔPE (seen in the scatter plot as the data points with % change > 150%) was removed prior to statistical analysis. ΔVp, ΔAUC, and ΔPE showed significant differences in means between treatment successes and failures (P = 0.01 for ΔVp, P = 0.02 for ΔAUC, and P = 0.03 for ΔPE). ΔKtrans showed no significant difference in means between treatment successes and failures. AUC indicates area under the curve.
The differences between the means of the treatment success and failure groups for the other 3 parameters reached significance for ΔAUC and ΔPE (P = 0.02 and P = 0.03, respectively). No significant difference in the means was found for Ktrans (P = 0.48, 2-tailed). The false-positive rates for ΔAUC and ΔPE as predictors of treatment success were also quite low (8.51 × 10⁻⁶ for ΔAUC and 1.79 × 10⁻⁶ for ΔPE). On the contrary, false-negative rates were higher (0.067 for ΔAUC and 0.288 for ΔPE).
For 1 case (Figure 2), ΔVp detected a positive treatment response within 10 days after treatment—much earlier than stable disease could be suggested by conventional imaging. Perfusion data for the other cases were not acquired so soon after treatment and ranged from 31 to 187 days after radiotherapy. Nevertheless, changes in perfusion predicted treatment success earlier than 6 months after radiotherapy in 16 of 17 tumors—nearly half the follow-up time required to determine successful treatment of a stable tumor on conventional MRI.
Figure 2.
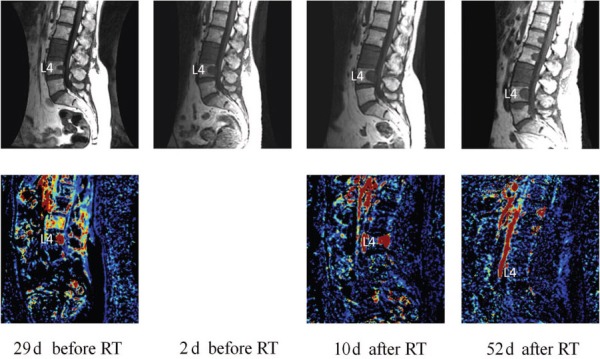
Case of leiomyosarcoma metastasis to the spine. The tumor in L4 is observed to progress between the first and second pretreatment scans on T1-weighted imaging (upper row). No changes in tumor size are apparent on the T1-weighted images on either the first or second post-treatment scans. Vp on the contrary (lower row) decreased from 7.30 on the scans 29 days before RT to 3.27 on the scans 10 days after RT (55.12% decrease). On the scans 52 days after RT, a visible reduction on the Vp color map can be seen in the region of L4. Vp on this day was 0.45 (93.83% decrease from the original pretreatment scans). Perfusion data were not acquired with the pretreatment scans 2 days before RT. Note that the large L3 metastasis is hyperperfused on the pre-treatment scans, which decreases significantly on the post-treatment scans, yet its size and signal characteristics remain the same on the routine MR images. RT indicates radiation treatment.
Qualitative assessment of 11 of 13 pretreatment scans (active tumors) had SI curves resembling characteristic type D curve (sharp, rapidly rising slope, followed by a downsloping washout phase) of Chen et al,11 previously found to be specific for active metastatic disease. Although some post-treatment curves may resemble curves those of Chen et al,11 histological heterogeneity and inconsistent intervals of imaging of this retrospective study preclude a meaningful comparison with curves of Chen et al.11 In contrast, only 2 of 13 post-treatment scans of successfully treated lesions generated SI curves with this pattern. Eight of the 13 post-treatment scans revealed SI curves that resembled the type E curve (wash-in, followed by a second, slower-rising phase), described in the same study as specific for general inflammation (Figure 3).
Figure 3.
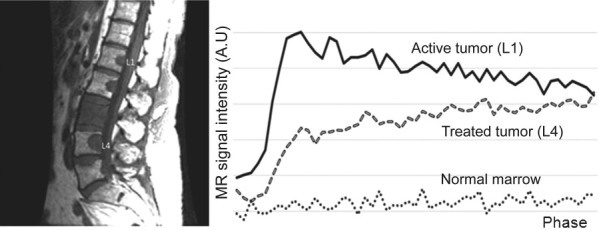
Signal intensity (SI) curves measured from an untreated tumor (L1) and a successfully treated tumor (L4) demonstrate distinct morphologies. The SI curve for the untreated tumor displays a sharp, rapidly rising slope, followed by a washout phase (type D curve), whereas the treated tumor SI curve is characterized by an initial rising slope, followed by a second slower rising phase (type E curve). MR indicates magnetic resonance; AU, arbitrary unit.
The remaining 2 pretreatment and 3 post-treatment curves out of the successfully treated cases all showed curve morphologies of undetermined significance, characterized by an initial rise, followed by a plateau phase. Twelve tumors had adequate scan durations for both the pre- and post-treatment scans and, of these, 5 showed both a type D curve in the pretreatment scan and a type E curve in the post-treatment scan. Of the 2 treatment-failure cases (Figure 4), 1 tumor had SI curves that appeared unchanged in shape from pre- to post-treatment (both showed a rise, followed by a plateau phase), whereas the other tumor had SI curves that demonstrated the same pattern as the majority of successfully treated tumors (type D in the pretreatment scan and type E in the post-treatment scan).
Figure 4.
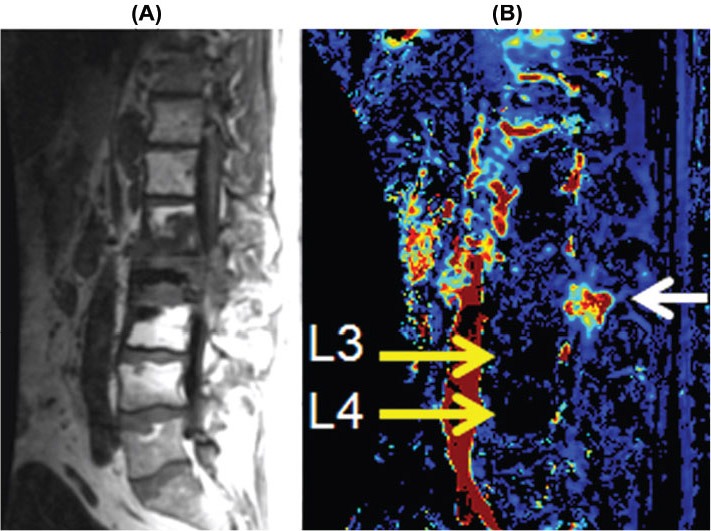
Sagittal T1-weighted image (A) showing metastatic lesions at L1, L2, and L3 that were previously treated with radiation. The Vp color map (B) demonstrates recurrent disease involving the posterior elements at L2 (white arrow), which is indistinguishable from treated nonviable tumor at other locations. Note the postradiation changes of the marrow at L3 and L4 (high signal on the T1-weighted images) that are markedly hypoperfused (yellow arrows). The signal void (black region) in L2 body is polymethylmethacrylate cement from kyphoplasty for pathological collapse.
Untreated lesions presumably continue to grow until treatment, so the timing of the pretreatment scan relative to the rate of tumor progression is likely to influence the pretreatment perfusion values. We hypothesized that pretreatment scans acquired later in time, or closer to the time of treatment, would show higher relative perfusion values, leading to greater percent decreases in perfusion (i.e., ΔVp) after treatment. Absolute parameter measurements could not be used to compare individual tumors, because they were not all of the same primary origin. Therefore, we compared the time interval before radiotherapy of each pretreatment scan with the eventual change seen in Vp after treatment. Figure 5 plots the time before treatment against ΔVp and demonstrates the hypothesized negative relationship between days before radiotherapy and magnitude of ΔVp. Regression analysis shows a significant difference from zero (P = 0.016), indicating a real influence of pretreatment time of acquisition on ΔVp.
Figure 5.
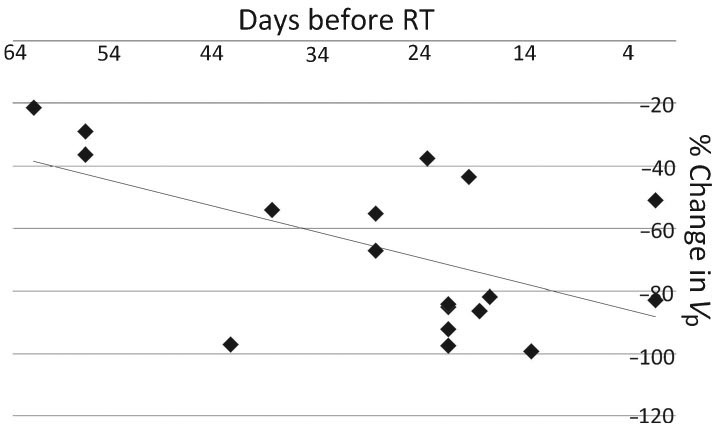
Diagram showing the negative relationship between pretreatment time of acquisition and ΔVp. The linear curve was obtained using ordinary least squares regression. The slope coefficient was −0.813, with a standard error of 0.301, which differs significantly from zero (P = 0.016). R2 = 0.304.
DISCUSSION
DCE-MRI with Gd-DTPA has been used to measure perfusion in brain, heart, and several neoplasms.12 Gd-DTPA–enhanced MRI has been validated for bone perfusion studies of normal and infiltrated bone.13–17 However, to our knowledge, this is the first study to evaluate the use of DCE-MRI in bone marrow for monitoring tumor responses to radiation therapy.
We show that changes in blood perfusion, particularly the vascular parameter Vp, reflect tumor responses to radiation therapy in bone marrow. Vp is a measure of intravascular volume, and the decrease in Vp observed after radiotherapy likely represents the diminished vascularity of successfully treated lesions. The increase in Vp seen in treatment-failure cases supports the observation that progressing bone metastases secrete angiogenesis-inducing factors such as vascular endothelial growth factor, attracting the increased vasculature required for further growth.1
The parameters AUC and PE estimate relative perfusion changes. However, measurements are imprecise and susceptible to variability in scanning procedures. Because many of the patients in this study had lesions in multiple vertebrae throughout the field of view, it was often difficult to draw ROIs in normal marrow for the purpose of normalizing parameters to a ratio of tumor value/normal value. Rather than introduce an additional variable and likely source of error, we used absolute parameter values in the final analysis. However, this could partially account for the less robust findings demonstrated in AUC and PE. The fact that the values obtained for the 2 model-based parameters fell within their respective distributions suggests a nonphysiologic source of the variation. The outlier in Ktrans was measured in a tumor positioned off midline and quite possibly involving other tissues, for example, the cartilage of the adjacent rib facet joint. The resulting tissue heterogeneity within the ROI might then have contributed to measurements that were not specific to the bony area of interest.
Ktrans estimates the velocity of blood transfer from the vascular compartment to the interstitial space, and it is influenced by vessel permeability, surface area, and vascular density.18 Although our study found the change in Ktrans to have no correlation to the observed tumor response, Ktrans is a widely used parameter for assessing tumor vascular properties in the brain and other soft tissues. The discrepancy could exist for several reasons, one being the fundamental difference in vascular physiology between brain and bone tissue. A tumor growing in the brain disrupts endothelial tight junctions of the blood-brain barrier and leads to increased capillary permeability. In bone, however, blood flow through sinusoidal capillaries is dynamic and reactive to metabolic activity and controlled transcapillary mineral exchange. Our results agree with studies of bone capillary permeability performed in models of osteoarthritis development, which concluded that signal enhancement in pathologic bone is independent of transvascular movement of Gd into the extravascular intraosseous compartment.19 Interestingly, a prior DCE-MRI study on irradiated bone marrow in an animal mode20 reports increased permeability after radiation, corresponding with ultrastructural changes in the blood-bone marrow barrier seen on electron microscopy. Radiation effects unrelated to tumor status may thus account for our findings that 6 of 17 successfully treated tumors showed an increase in permeability after radiotherapy, even when other perfusion parameters decreased. Future studies are warranted to further characterize the effects of radiation on this particular perfusion parameter.
Regarding the SI curve morphology analysis, the type D curve seen in 11 of 13 pretreatment scans of active tumors and the type E curve seen in 8 of 13 postsuccessful treatment scans may be explained by proposals made in the earlier study11: areas packed with viable tumor cells have little interstitial volume and thus demonstrate an early washout. Healing regions of benign injury or, in this case, treated disease might be highly vascular due to the inflammatory reaction but lack the venous drainage to prevent contrast from sequestering in the interstitial space. With only 2 cases of treatment failure, the observed SI curve patterns in this group are inconclusive; larger sample sizes and longer DCE-MRI measurement times in future studies may allow a more fruitful investigation of the predictive value of qualitative SI curve assessments.
The ability of DCE-MRI to predict treatment success within 6 months for 16 of 17 tumors (and as early as 10 days after radiotherapy in the case with the shortest post-treatment time interval) has clinical implications. The practical advantages to early detection of treatment response are numerous: identification of poor responders at an early stage would lead to timely treatment modification and potentially improved outcome. Likewise, stress and costs endured by successfully treated patients would be reduced by early recognition of positive response. Presently, a determination of successful treatment can be confirmed only by stability of findings on multiple scans during a very prolonged period of time. The early decrease in the perfusion parameter Vp consistently observed in good responders suggests a role for DCE-MRI as a predictive marker for treatment outcome.
Larger sample sizes, especially of the treatment-failure group, will permit receiver operator characteristic analysis and more definitive estimation of the predictive value of various parameters. The sample size was limited in this study, because only subjects who received external beam radiotherapy obtained pre- and post-treatment scans with high temporal resolution and no complicating surgical procedures were included. To apply a pharmacokinetic model for quantitative analysis, both the precontrast T1 value and AIF must be accurately measured. In the design of DCE-MRI studies, competing demands for high spatial resolution, coverage, and signal-to-noise often result in inadequate temporal resolution for reliable measurement of the AIF. Saturation effects and mis-sampling can affect the AIF time course and initial contrast bolus, and dispersion of the AIF before it reaches the ROI can also affect DCE-MRI quantification. In addition, the precise mechanism leading to the perfusion differences between successfully and unsuccessfully treated tumors has not been elucidated, and it is probable that the perfusion changes reflect a combination of radiation- and therapy-induced changes, healing bone, and reconstitution of hematopoietic marrow. However, given that successfully and unsuccessfully treated tumors could be differentiated by the perfusion changes by a statistically significant margin in our patient population, the results are meaningful regardless of the precise mechanism. The heterogeneity of histology and inconsistent follow-up MRI examinations are unavoidable limitations of this retrospective study. Further study to isolate the different components of healing bone response and serial DCE-MRI studies at constant and frequent intervals would be useful.
CONCLUSION
Changes in blood perfusion reflect tumor responses to radiation therapy in bone marrow. We show that quantitative evaluation of DCE-MRI has the ability to detect vascular treatment responses. Perfusion imaging has the potential to serve as a noninvasive predictive marker of treatment efficacy, and our results suggest that tumor responses observed by DCE-MRI may predate conventional response parameters that rely on morphological changes. The prognostic value of DCE-MRI in detecting early treatment response has potential clinical use and may significantly impact patient care outcomes.
Key Points.
All successfully treated lesions showed decreases in plasma volume (Vp), and the 2 treatment failures showed drastic increases in Vp.
Changes in AUC and PE demonstrated similar relationships to the observed treatment response, whereas changes in Ktrans showed no significant relationship.
SI curve morphologies also demonstrated specificity for active disease (11 of 13) and treated disease (8 of 13).
The ability of DCE-MRI to detect early treatment response has prognostic value and the potential to improve patient care and outcome.
Footnotes
The device(s)/drug(s) is/are FDA approved or approved by corresponding national agency for this indication.
No funds were received in support of this work.
Relevant fi nancial activities outside the submitted work: board membership, consultancy, grants/grants pending, payment for lectures, and royalties.
References
- 1.Togawa D, Lewandrowski K-U. The pathophysiology of spinal metastases. In:McLain R, Lewandrowski K-U, Markman M, et al. eds. Current Clinical Oncology: Cancer in the Spine: Comprehensive Care. Totowa, NJ: Humana Press, Inc.; 2006:17–23. [Google Scholar]
- 2.Traill Z, Richards MA, Moore NR. Magnetic resonance imaging of metastatic bone disease. Clin Orthop Relat Res 1995;312:76–88. [PubMed] [Google Scholar]
- 3.Biffar A, Dietrich O, Sourbron S, et al. Diffusion and perfusion imaging of bone marrow. Eur J Radiol 2010;76:323–328. [DOI] [PubMed] [Google Scholar]
- 4.Yankelevitz DF, Henschke CI, Knapp PH, et al. Effect of radiation therapy on thoracic and lumbar bone marrow: evaluation with MR imaging. AJR Am J Roentgenol 1991;157:87–92. [DOI] [PubMed] [Google Scholar]
- 5.Otake S, Mayr NA, Ueda T, et al. Radiation-induced changes in MR signal intensity and contrast enhancement of lumbosacral vertebrae: do changes occur only inside the radiation therapy field? Radiology 2002;222:179–83. [DOI] [PubMed] [Google Scholar]
- 6.Koo KH, Dussault R, Kaplan P, et al. Age-related marrow conversion in the proximal metaphysis of the femur: evaluation with T1-weighted MR imaging. Radiology 1998;206:745–8. [DOI] [PubMed] [Google Scholar]
- 7.Vande Berg BC, Malghem J, Lecouvet FE, et al. Magnetic resonance imaging of the normal bone marrow. Skeletal Radiol 1998;27:471–83. [DOI] [PubMed] [Google Scholar]
- 8.Tofts PS, Brix G, Buckley DL, et al. Estimating kinetic parameters from dynamic contrast-enhanced T(1)-weighted MRI of a diffusable tracer: standardized quantities and symbols. J Magn Reson Imaging 1999;10:223–32. [DOI] [PubMed] [Google Scholar]
- 9.Dyke JP, Aaron RK. Noninvasive methods of measuring bone blood perfusion. Ann N Y Acad Sci 2010;1192:95–102. [DOI] [PMC free article] [PubMed] [Google Scholar]
- 10.Hylton N. Dynamic contrast-enhanced magnetic resonance imaging as an imaging biomarker. J Clin Oncol 2006;24:3293–8. [DOI] [PubMed] [Google Scholar]
- 11.Chen WT, Shih TT, Chen RC, et al. Blood perfusion of vertebral lesions evaluated with gadolinium-enhanced dynamic MRI: in comparison with compression fracture and metastasis. J Magn Reson Imaging 2002;15:308–14. [DOI] [PubMed] [Google Scholar]
- 12.Pauliah M, Saxena V, Haris M, et al. Improved T(1)-weighted dynamic contrast-enhanced MRI to probe microvascularity and heterogeneity of human glioma. Magn Reson Imaging 2007;25:1292–9. [DOI] [PubMed] [Google Scholar]
- 13.Moehler TM, Hawighorst H, Neben K, et al. Bone marrow microcirculation analysis in multiple myeloma by contrast-enhanced dynamic magnetic resonance imaging. Int J Cancer 2001;93:862–8. [DOI] [PubMed] [Google Scholar]
- 14.Baur A, Stabler A, Bartl R, et al. MRI gadolinium enhancement of bone marrow: age-related changes in normals and in diffuse neoplastic infiltration. Skeletal Radiol 1997;26:414–8. [DOI] [PubMed] [Google Scholar]
- 15.Cova M, Kang YS, Tsukamoto H, et al. Bone marrow perfusion evaluated with gadolinium-enhanced dynamic fast MR imaging in a dog model. Radiology 1991;179:535–9. [DOI] [PubMed] [Google Scholar]
- 16.Shih TT, Liu HC, Chang CJ, et al. Correlation of MR lumbar spine bone marrow perfusion with bone mineral density in female subjects. Radiology 2004;233:121–8. [DOI] [PubMed] [Google Scholar]
- 17.Northam M, de Campos RO, Ramalho M, et al. Bone metastases: evaluation of acuity of lesions using dynamic gadolinium-chelate enhancement, preliminary results. J Magn Reson Imaging 2011;34:120–7. [DOI] [PubMed] [Google Scholar]
- 18.Dyke JP. Perfusion imaging. In: Holodny A, ed. Functional Neuroimaging: A Clinical Approach. New York, NY: Informa Healthcare USA, Inc; 2008:249–72. [Google Scholar]
- 19.Lee JH, Dyke JP, Ballon D, et al. Subchondral fluid dynamics in a model of osteoarthritis: use of dynamic contrast-enhanced magnetic resonance imaging. Osteoarthritis Cartilage 2009;17:1350–5. [DOI] [PMC free article] [PubMed] [Google Scholar]
- 20.Daldrup-Link HE, Link TM, Rummeny EJ, et al. Assessing permeability alterations of the blood-bone marrow barrier due to total body irradiation: in vivo quantification with contrast enhanced magnetic resonance imaging. Bone Marrow Transplant 2000;25:71–8. [DOI] [PubMed] [Google Scholar]


