

Supplemental digital content is available in the text.
Key words/Abbreviations: cumulative life stress, assessment, measurement, risk, health, disease, BIC = Bayesian Information Criterion, CTQ-SF = Childhood Trauma Questionnaire—Short Form, K-6 = Kessler 6-Item Psychological Distress Inventory, PHQ = Physical Health Questionnaire, PSQI = Pittsburgh Sleep Quality Inventory, PSS = Perceived Stress Scale, STRAIN = Stress and Adversity Inventory
ABSTRACT
Objective
Numerous theories have proposed that acute and chronic stressors may exert a cumulative effect on life-span health by causing biological “wear and tear,” or allostatic load, which in turn promotes disease. Very few studies have directly tested such models, though, partly because of the challenges associated with efficiently assessing stress exposure over the entire life course. To address this issue, we developed the first online system for systematically assessing lifetime stress exposure, called the Stress and Adversity Inventory (STRAIN), and describe its initial validation here.
Methods
Adults recruited from the community (n = 205) were administered the STRAIN, Childhood Trauma Questionnaire—Short Form, and Perceived Stress Scale, as well as measures of socioeconomic status, personality, social desirability, negative affect, mental and physical health complaints, sleep quality, computer-assessed executive function, and doctor-diagnosed general health problems and autoimmune disorders.
Results
The STRAIN achieved high acceptability and was completed relatively quickly (mean = 18 minutes 39 seconds; interquartile range = 12–23 minutes). The structure of the lifetime stress data best fit two latent classes overall and five distinct trajectories over time. Concurrent associations with the Childhood Trauma Questionnaire—Short Form and Perceived Stress Scale were good (r values = .147–.552). Moreover, the STRAIN was not significantly related to personality traits or social desirability characteristics and, in adjusted analyses, emerged as the measure most strongly associated with all six of the health and cognitive outcomes assessed except current mental health complaints (β values = .16–.41; risk ratios = 1.02–1.04). Finally, test-retest reliability for the main stress exposure indices over 2–4 weeks was excellent (r values = .904–.919).
Conclusions
The STRAIN demonstrated good usability and acceptability; very good concurrent, discriminant, and predictive validity; and excellent test-retest reliability.
INTRODUCTION
Life stress is a central construct in most contemporary models of human health (1,2). Although the utility of this construct has been questioned because of definitional issues and poor conceptual boundaries—such as not distinguishing between life stressors (e.g., getting divorced) and the psychobiological consequences of such stressors (e.g., feeling distressed) (3,4)—the fact remains that thousands of studies are published annually on the question of how stress affects health (5). The resulting consensus from this body of work is that acute life events (e.g., getting divorced or fired from a job) and chronic difficulties (e.g., ongoing marital or financial problems) increase risk for a wide variety of mental and physical health problems, including anxiety disorders, depression, autoimmune disorders, cardiovascular disease, certain cancers, and Alzheimer's disease (6–10). Life stress exposure is also a strong predictor of biological aging and premature mortality (11,12), which has prompted extensive research on how stress has such widespread effects on health.
One prevailing view involves the idea that stressors occurring across the life course may exert a cumulative effect on biological processes that underlie disease. From this perspective, during times of social-environmental adversity, the body mounts a neural, physiologic, and immunologic response that enhances neural threat sensitivity, and upregulates hypothalamic-pituitary-adrenal axis, sympathetic-adrenal-medullary axis, and systemic inflammatory activity (13–15). This integrated, multilevel response is thought to be critical for survival during times of threat (16–19). When this stress response is repeatedly engaged or prolonged, however, biological “wear and tear”—sometimes referred to as allostatic load—occurs (14), and greater allostatic load in turn increases risk for disease and premature mortality (14,15).
Because frequent or chronic activation of this stress-related biological response is believed to be a key factor promoting disease, theoretical models like those described above have generated substantial interest in whether greater stress exposure across the life course is associated with poorer life-span health. However, very few studies have actually assessed lifetime stress exposure, in large part because of the substantial challenges associated with obtaining a detailed account of all of the acute life events and chronic difficulties that a person has experienced over his or her life-span. As a result, although the theoretical literature on lifetime stress exposure and health is rich, the empirical literature is almost nonexistent, even though studies on this topic are critical for advancing our understanding of how stressors occurring across the life course exert a cumulative effect on health (20).
Stress and Adversity Inventory: An Overview
To address the challenges associated with measuring stress over the life course, G. M. Slavich began developing an online system for assessing lifetime stress exposure in 2008 that aims to combine the sophistication of an interview-based system for assessing life stress with the simplicity of a self-report instrument. The result of this effort is the Stress and Adversity Inventory for Adults (Adult STRAIN), which is designed to be an inexpensive, user-friendly, scalable, and reliable measure that can be self- or interviewer-administered (see http://www.strainsetup.com). Questions written in colloquial English are presented one at a time, and participants (or interviewers) register responses by touching or clicking the respondent's answers on the computer screen. For each stressor that is endorsed, respondents are asked a series of tailored follow-up questions that ascertain each stressor's frequency, timing, and duration. The system also measures the perceived severity of each stressor that is reported, thus permitting researchers to assess individuals' “objective” stress exposure (i.e., their lifetime stressor count) as well as their “subjective” stress experience (i.e., their lifetime stressor severity). This measurement approach is consistent with commonly agreed-upon best practices in the conceptualization and assessment of life stress, which underscore the importance of assessing the specific timing of stress exposure, distinguishing between different forms and types of life stress, and measuring both objective and subjective aspects of the stressors that individuals experience (10,21–26).
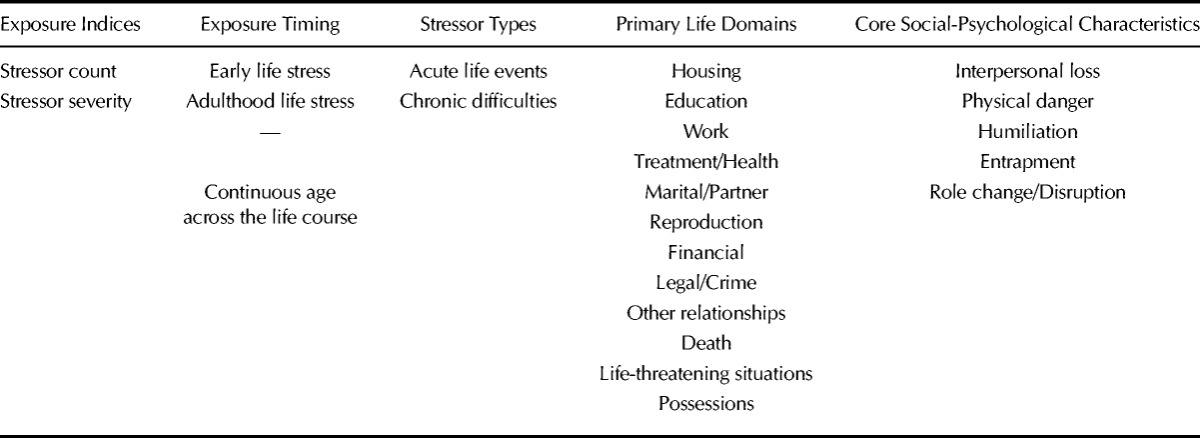
The STRAIN interview takes approximately 18 minutes to complete and enquires about 55 different stressors—including 26 acute life events and 29 chronic difficulties—that are known to affect health. As described in Table 1, these stressors span 2 stressor types, 12 major life domains, and 5 different social-psychological characteristics. In addition, the summary scores produced include the two exposure indices described above (i.e., stressor count and severity) and two distinct timing categories (i.e., early life and adulthood). The resulting lifetime stress exposure data can thus be aggregated across stressor categories to create overall stress exposure summary scores or disaggregated to create more nuanced scores that differ along several important dimensions.
TABLE 1.
Dimensions of Life Stress Assessed by the Stress and Adversity Inventory (STRAIN)
Given the challenges associated with developing a psychometrically sound stress assessment instrument, a “soft launch” approach was employed for initially testing the STRAIN that involved integrating the system into ongoing studies spanning different age groups, populations, and psychological, biological, and clinical outcomes. This approach yielded eight preliminary studies, showing that the STRAIN predicts biological reactivity to acute stress (27), metabolic function (28), memory (29), diurnal cortisol levels in women diagnosed with ovarian cancer (30), depression and fatigue in women diagnosed with breast cancer (31,32), and self-reported mental and physical health in the general population (33,34). Although these studies have provided important pilot data on the STRAIN, they were designed to address specific research questions, not to comprehensively describe the instrument's predictive validity. These studies also did not examine the STRAIN's usability, psychometric properties, concurrent or discriminant validity, or reliability. The goal of the present validation study, therefore, was to comprehensively assess the STRAIN's usability, acceptability, latent structure, concurrent validity, discriminant validity, predictive validity, and test-retest reliability in a community-based sample of adults.
METHODS
Participants and Procedure
Participants were 205 young, middle-aged, and older adults (96 men, 107 women, 2 transgender) who were recruited from the community to complete an “online study of stress and health” that occurred from March 23, 2016, to April 29, 2016. Of these 205 participants, 100 individuals, selected at random, were followed over time to examine the test-retest reliability of the STRAIN, with 100% compliance. The mean age of this convenience sample was 37.82 years old (standard deviation [SD] = 11.72; range, 19–68 years old), with 85.4% of participants self-reporting as white, 5.9% as black or African American, 3.9% as Asian, 2.4% as Hispanic, 2.0% as mixed/biracial, and 0.5% as declined to answer.
Potential participants who saw an online advertisement were directed to the study website where they read an overview of the study that described the topics covered and expected time commitment of 45 minutes. The overview also noted that the survey would include several “attention checks” that they needed to pass for their responses to be valid (e.g., “If you are reading this question, please answer C”). Individuals who read these instructions and subsequently provided their electronic consent then began the study, which assessed their stress levels, personality and social desirability characteristics, demographic factors, executive function, and health status (see below). Participants completed all of the measures online and data were retained for those who answered all of the questions without failing the attention checks (45.7% of respondents). All study procedures were approved by the institutional review board of the University of California, Los Angeles.
Life Stress Measures
Stress and Adversity Inventory
Lifetime stress exposure was assessed using the Adult STRAIN, which is described in the Introduction and in greater detail on the STRAIN website (http://www.strainsetup.com). Stressors were originally identified for possible inclusion in the STRAIN using a seven-step process. First, existing interview-based measures of life stress were reviewed to catalog stressors that are frequently assessed. Second, an exhaustive review of existing studies on stress and health was conducted to identify stressors that consistently predict poor health. Third, a team of expert life stress raters, trained in the state-of-the-art Life Events and Difficulties Schedule (26), was assembled to review the initial list of possible stressors and make consensus judgments to (a) eliminate stressors that were redundant or not moderate-to-severe in nature, (b) categorize stressors into life domains (e.g., work, financial, housing, marital/partner, etc.), and (c) identify the core social-psychological characteristic of each stressor (e.g., interpersonal loss, physical danger, role change/disruption, etc.). Fourth, consultation sessions were convened with experts who specialize in the assessment of stress. These experts provided high-level input regarding the instrument, and reviewed and suggested revisions for the reduced question set. Fifth, the wording of each stressor item was refined to ensure maximum clarity and readability. Sixth, the question order was adjusted to improve the interview flow and user experience. Finally, the interview was pilot tested with individuals who were recruited from the community and, based on user feedback, the question set, item order, and specific wording of each item was finalized.
For each stressor that is endorsed, respondents are asked a series of follow-up questions that ascertain the severity, frequency, timing, and duration of the stressor. Based on this information, the STRAIN can produce a variety of stress exposure indices and life charts that span several different types of stress (see Table 1). Presently, this information can be combined to generate 115 different lifetime stress exposure summary scores for each participant, and we report on a subset of the main indices here to describe the psychometric properties of the instrument.
Childhood Adversity
Participants' levels of childhood adversity were measured using the Childhood Trauma Questionnaire—Short Form (CTQ-SF; (35)). The CTQ-SF is a 28-item questionnaire that assesses experiences of childhood physical, emotional, and sexual abuse, and emotional and physical neglect (25 questions), as well as reporting biases (3 questions). Responses to the 25 early adversity items were provided on a 1 (never true) to 5 (very often true) scale and were averaged to create an overall CTQ-SF score, with higher scores indicating more adversity. Internal consistency for this scale was excellent, α = .94.
Perceived Stress
Participants' present levels of perceived stress were assessed using the 10-item version of the Perceived Stress Scale (PSS) (36,37), which assesses how uncontrollable and unpredictable respondents regard their lives. Responses to each item were provided on a 0 (never) to 4 (very often) scale, and all responses were averaged to create an overall perceived stress score, with higher scores indicating more perceived stress. Internal consistency for this scale was excellent, α = .90.
Demographic and Potential Confounding Factors
Socioeconomic Status
Participants reported their annual household income and personal highest educational achievement level, and answers to these questions were standardized and averaged to create an overall index of socioeconomic status.
Big Five Personality Traits
Participants' Big Five personality traits were assessed using the Ten Item Personality Inventory (38), which is a 10-item instrument for measuring openness to experience, conscientiousness, extraversion, agreeableness, and neuroticism. The Ten Item Personality Inventory has good convergent validity and correlates strongly with longer measures of the Big Five personality traits, such as the Big Five Inventory (38).
Social Desirability
Participants' tendency to exhibit social desirability was assessed using the 17-item Social Desirability Scale (39). Respondents indicated True (1) or False (0) for each item, and these responses were then summed to create an overall index of socially desirable responding. Internal consistency for this scale was excellent, α = .94.
Negative Affect
Participants' levels of negative affect over the past week were assessed using the Positive and Negative Affect Schedule (40). Participants were asked to report the extent to which they felt 10 negative and 10 positive emotions (20 items total). Responses to each item were provided on a 1 (very slightly or not at all) to 5 (extremely) scale, and responses to the 10 questions assessing negative affect were then averaged to create an overall index of negative affect, with higher scores indicating more negative affect. Internal consistency for this scale was excellent, α = .92.
Cognitive Measures
Executive Function
Participants' executive function ability was assessed using a version of the Stroop task scripted in jsPsych (41), which has been extensively validated for collecting reaction time data on the Internet (42–44). Participants saw the words RED, BLUE, and GREEN written in 70px boldface red, blue, or green font, and were given 1800 milliseconds to indicate the color of the font in which each word was written. Of the 180 nonpractice trials, 120 were color-word congruent (e.g., GREEN, written in green font) and 60 were color-word incongruent (GREEN, written in blue font), which engages both facets of inhibitory control—namely, response inhibition and interference control (45). Reaction times were measured for each response, and the classic Stroop interference effect was in turn calculated by subtracting reaction times of correct responses to color-word congruent trials from correct responses to color-word incongruent trials (for additional technical details, see the Supplemental Digital Content, http://links.lww.com/PSYMED/A421). We observed the classic Stroop effect in this study, with participants exhibiting longer reaction times for incongruent than for congruent words (Mdiff = 119.5 milliseconds, t(204) = 25.78, p < .001). Generally speaking, greater Stroop interference effects indicate poorer executive function.
Health Measures
Sleep Quality
Participants' sleep quality was assessed using the 10-item Pittsburgh Sleep Quality Inventory (PSQI) (46), which has been shown to have good test-retest reliability over 1 year (47). The PSQI assesses both objective indices of sleep quality (e.g., how often participants wake up during the night) and subjective indices of sleep quality (e.g., how rested they typically feel after a night of sleep). Answers on the PSQI were scored using the standard scoring system and then summed to create a global PSQI score, with higher scores indicating worse sleep quality.
Mental and Physical Health Complaints
We used the Kessler 6-Item Psychological Distress Inventory (K-6) (48) and the Physical Health Questionnaire (PHQ) (49) to assess mental health and physical health, respectively, over the preceding month. The K-6 is a 6-item scale that shows good convergence with DSM-IV–based measures of mental health symptoms (48), and the PHQ is a 14-item scale that shows good convergence with general health and divergence with work stress (49). Scores on the K-6 and PHQ were summed to create indices of mental and physical health, respectively, with higher scores indicating more mental or physical health complaints over the preceding month. The K-6 and PHQ both demonstrated very good internal consistency (α = .91 and α = .84, respectively).
Doctor-Diagnosed General Health Problems
The presence of general health problems diagnosed by a medical doctor was assessed by asking participants whether a medical doctor had ever diagnosed them with any of the following conditions: anxiety, arthritis (not rheumatoid or psoriatic), asthma, cancer, chronic pain, coronary heart disease, depression, gastroesophageal reflex disease (or chronic heartburn), heart attack, high blood pressure, insomnia, kidney stone(s), migraines, overweight, posttraumatic stress disorder, stomach ulcer(s), and stroke. Endorsed conditions were then summed to create a count of each participant's general health problems, with higher scores indicating more health problems diagnosed by a medical doctor.
Doctor-Diagnosed Autoimmune Disorders
The presence of autoimmune disorders diagnosed by a medical doctor was assessed by asking participants whether a medical doctor had ever diagnosed them with any of the following conditions: Addison's disease, celiac disease, dermatomyositis, Grave's disease, Hashimoto's thyroiditis, inflammatory bowel disease (i.e., Crohn's disease, ulcerative colitis), multiple sclerosis, myasthenia gravis, pernicious anemia, psoriasis (or psoriatic arthritis), rheumatoid arthritis, Sjögren's syndrome, lupus (systemic lupus erythematosus), and other autoimmune disorder (please specify). Endorsed conditions were then summed to create a count of each participant's autoimmune disorders, with higher scores indicating more autoimmune disorders diagnosed by a medical doctor.
Data Analyses
All analyses were conducted in R, version 3.2.5. Correlation and linear models were used to analyze continuous outcomes, and generalized linear models were used to analyze count outcomes (e.g., number of doctor-diagnosed general health problems). To conduct the latent class analysis, we used the mclust package, version 5.1. Using the expectation-maximization algorithm, one through nine Gaussian clusters were fit to the lifetime stressor count data with either equal or unequal variance modeled between clusters, yielding a total of 17 models. The optimal model selected was the model with the best fit according to the Bayesian Information Criterion (BIC). BIC values for the models ranged from −1728.00 to −1795.56. To conduct the latent trajectory analysis, we used the flexmix package, version 2.3-13. Parameters were estimated according to the expectation-maximization algorithm and random intercepts were fit for each participant. One through nine Gaussian clusters were fit regressing lifetime stressor count onto a quintic polynomial; the fifth-degree polynomial was determined to best fit the overall data. To provide a more accurate BIC statistic for each model, each model was estimated three times and the average BIC was taken as the BIC value for that model of interest. BIC values for the models ranged from 29029.87 to 34225.86.
RESULTS
Usability and Acceptability of the STRAIN
We first examined the STRAIN's usability and acceptability. Out of the 369 participants who began the STRAIN, 34 discontinued participation while completing the STRAIN, yielding a high completion rate of 90.8%, and 130 failed an attention check or discontinued the study after completing the STRAIN, leaving the final sample of 205 participants. These participants reported that the STRAIN was “interesting” and “easy-to-use.” In addition, one participant stated that the STRAIN follow-up questions were “repetitive” and a second said that “thinking about stressful experiences was mildly distressing.” The average time to complete the STRAIN was 18 minutes and 39 seconds (interquartile range = 11 minutes 45 seconds–22 minutes 58 seconds).
Next, we examined whether taking the STRAIN altered participants' mood, as assessed by pre- to post-changes in negative affect. However, negative affect did not change from pre-STRAIN (M = 1.65, SD = 0.83) to post-STRAIN (M = 1.67, SD = 0.85; t(170) = −0.96, p = .341, d = 0.03), indicating that the STRAIN does not induce negative mood.1
Descriptive Statistics
Participants experienced an average of 25.77 stressors over the life-span (SD = 16.85; range, 1–83; possible range, 0–166), with an average overall severity score of 63.26 (SD = 37.73; range, 0–167; possible range, 0–265). This corresponds to an average severity rating between “moderately” and “quite” stressful for each stressor experienced. Because the findings were similar for lifetime stressor count and severity, for ease of interpretation, we focus the main results below on lifetime stressor count.
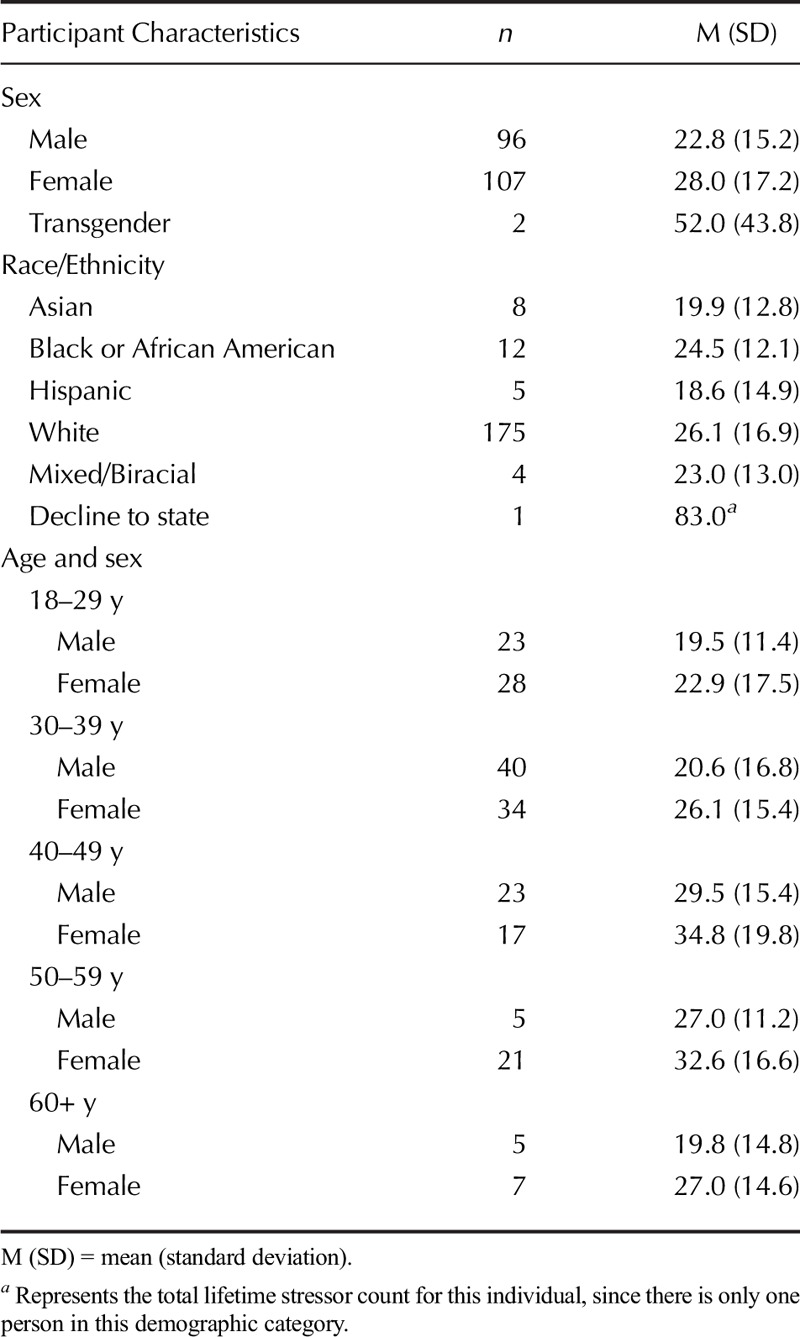
As summarized in Table 2, overall stressor count was associated with participants' sex (F(2,202) = 5.05, p = .007), age (r =.185, p = .008), and socioeconomic status (r = −.290, p < .001), but was unrelated to race (F(4,199) = 0.54, p = .708). Each of these associations followed patterns that could be expected based on prior research. Namely, more lifetime stressors were experienced by females, older individuals, and socioeconomically disadvantaged groups.
TABLE 2.
STRAIN Total Lifetime Stressor Count by Participant Characteristics
Latent Structure of the Lifetime Stressor Data
Using a latent class analysis assessing the fit of 1–9 latent classes, we found that two latent classes best fit (i.e., had the lowest BIC value for) the underlying distribution of overall lifetime stressor counts. As depicted in Figure 1A, there was a low-stress group (n = 116; M = 13.90 lifetime stressors, SD = 6.49) and a high-stress group (n = 89; M = 41.25 lifetime stressors, SD = 13.25).
FIGURE 1.
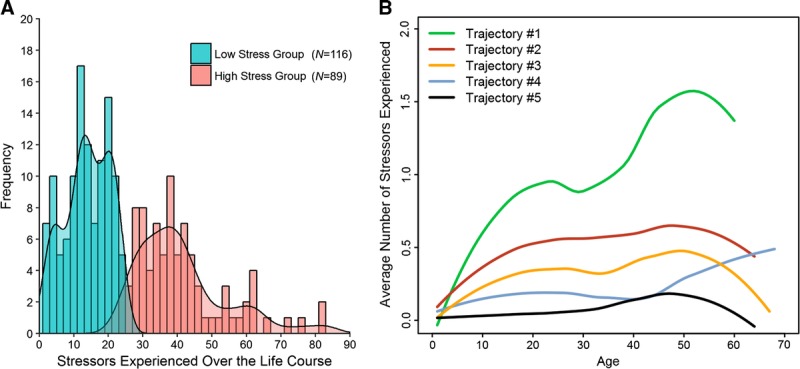
Latent structure of lifetime stressor data. (A) Latent class analysis revealed that two latent classes best fit the overall lifetime stressor count data. The low-stress group (n = 116) experienced 13.90 lifetime stressors (SD = 6.49) on average, whereas the high-stress group (n = 89) experienced 41.25 lifetime stressors (SD = 13.25) on average. (B) In turn, latent trajectory analysis revealed that five latent trajectories best fit the lifetime stressor count data over time. Trajectory #1 (n = 37) exhibited a substantial increase in stress exposure over time; Trajectory #2 (n = 70) exhibited a moderate increase in stress exposure over time; Trajectory #3 (n = 60) exhibited a mild increase in stress exposure over time, followed by a substantial decrease in later life; Trajectory #4 (n = 26) exhibited low levels of stress exposure through midlife, but an increase in stress exposure in later life; and Trajectory #5 (n = 13) exhibited very low levels of stress exposure over the entire life course (N = 205). Color image is available only in online version (www.psychosomaticmedicine.org).
Because the STRAIN obtains continuous timing information for all stressors experienced over the life course, we also examined the latent structure of participants' lifetime stressor count as a function of age of exposure. As shown in Figure 1B, five latent trajectories best fit the lifetime stressor count distribution data. Of the 205 participants, 37 were classified into Trajectory #1, 70 into Trajectory #2, 60 into Trajectory #3, 26 into Trajectory #4, and 13 into Trajectory #5.
Validity
Concurrent Validity
We expected total lifetime stressor count to correlate with participants' scores on the most commonly used instruments for assessing childhood adversity (i.e., CTQ-SF) and adulthood life stress (i.e., PSS). As expected, total lifetime stressor count was strongly correlated with participants' CTQ-SF total score (r = .552, p < .001) and significantly (but more weakly) correlated with participants' PSS total score (r = .147, p = .035), thus providing evidence of the STRAIN's concurrent validity.
Discriminant Validity
Next, we assessed the discriminant validity of the STRAIN and compared it with the discriminant validity of the CTQ-SF and PSS. Because the STRAIN was designed to assess stress exposure (e.g., as opposed to stress-related emotional distress, or reporting biases or personality characteristics), we expected lifetime stressor count to be unrelated to participants' Big Five personality characteristics and social desirability. In unadjusted bivariate associations, lifetime stressor count was not significantly associated with any of the Big Five personality traits, with or without adjusting for covariates, nor was it related to social desirability (p values ≥ .08). The two traits that most closely approached significance were neuroticism (r = .123, p = .080) and openness to experience (r = .120, p = .087). In analyses that adjusted for age, sex, race, and socioeconomic status, however, these associations were attenuated (p = .122 and p = .164, respectively). Therefore, responses to the STRAIN are not influenced by personality traits or by social desirability.
In comparison, in unadjusted bivariate associations, the CTQ-SF was significantly correlated with neuroticism in an unadjusted bivariate correlation (r = .148, p = .035), but this association was no longer significant when adjusting for age, sex, race, and socioeconomic status (β = .08, p = .269). The CTQ-SF was not related to any of the other Big Five personality traits, with or without adjusting for covariates (|r values| ≤ .12, |β values| ≤ .11, p values ≥ .10), nor was it associated with social desirability with or without adjusting for covariates (r = .04, β = .02, p values ≥ .573). The PSS, in contrast, was positively or negatively correlated with all five Big Five personality traits (i.e., openness, conscientiousness, extraversion, agreeableness, and neuroticism; |r values| ≥ .17, p values ≤ .014) and marginally inversely correlated with social desirability (r = −.128, p = .068). Moreover, the strength of these associations each increased when adjusting for participants' age, sex, race, and socioeconomic status (|β values| ≥ .11, p values ≤ .052). The discriminant validity of the STRAIN is thus slightly better than the CTQ-SF and substantially better than the PSS.
Predictive Validity
Next, we assessed the STRAIN's predictive validity in relation to several different health and cognitive outcomes—namely, self-reported current mental and physical health complaints, sleep quality over the past month, executive function, doctor-diagnosed general health problems, and doctor-diagnosed autoimmune disorders. As shown in Figure 2, the STRAIN demonstrated outstanding predictive validity across all of the outcomes measured. Lifetime stressor count was significantly associated with more self-reported current physical health complaints (r = .321, p < .001) and physical health complaints (r = .469, p < .001), as well as with worse sleep quality over the past month (r = .493, p < .001) and poorer executive function (r = .185, p = .008). Similarly, lifetime stressor count was significantly related to more doctor-diagnosed general health problems (risk ratio [RR] = 1.026, 95% confidence interval [CI] = 1.019–1.034, p < .001) and more doctor-diagnosed autoimmune disorders (RR = 1.034, 95% CI = 1.017–1.051, p < .001). Interpreting these risk scores reveals that, for every additional lifetime stressor detected by the STRAIN, participants were 2.6% more likely to be diagnosed with a major general health condition (e.g., high blood pressure, kidney stones, and cancer) and 3.4% more likely to be diagnosed with an autoimmune disorder.
FIGURE 2.
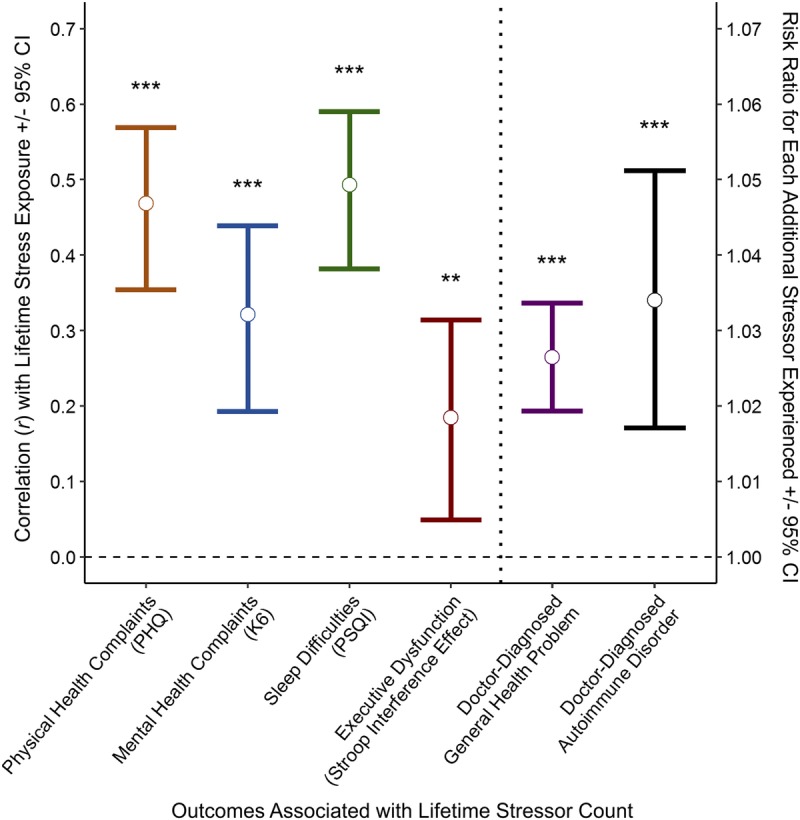
Predictive validity of the STRAIN. Lifetime stressor count as assessed by the STRAIN strongly predicted each of the six health-related outcomes assessed, including current physical health complaints, current mental health complaints, sleep difficulties over the past month, executive dysfunction, and doctor-diagnosed general health problems and autoimmune disorders. **p < .01, ***p < .001 (N = 205). Color image is available only in online version (www.psychosomaticmedicine.org).
In analyses that examined these associations while adjusting for participants' age, sex, race, socioeconomic status, and negative affect, lifetime stressor count remained a significant predictor of more mental health complaints (β = .168, p < .001) and physical health complaints (β = .401, p < .001), as well as worse sleep quality over the preceding month (β = .362, p < .001) and poorer executive function (β = .270, p = .010). Lifetime stressor count also remained a significant predictor of both doctor-diagnosed general health problems (RR = 1.021, 95% CI = 1.015–1.030, p < .001) and doctor-diagnosed autoimmune disorders (RR = 1.038, 95% CI = 1.013–1.055, p < .001). In sum, then, the STRAIN demonstrated excellent predictive validity across a variety of different health-related and cognitive outcomes, and these associations were robust while adjusting for participants' age, sex, race, socioeconomic status, and negative affect.
Comparative Predictive Validity
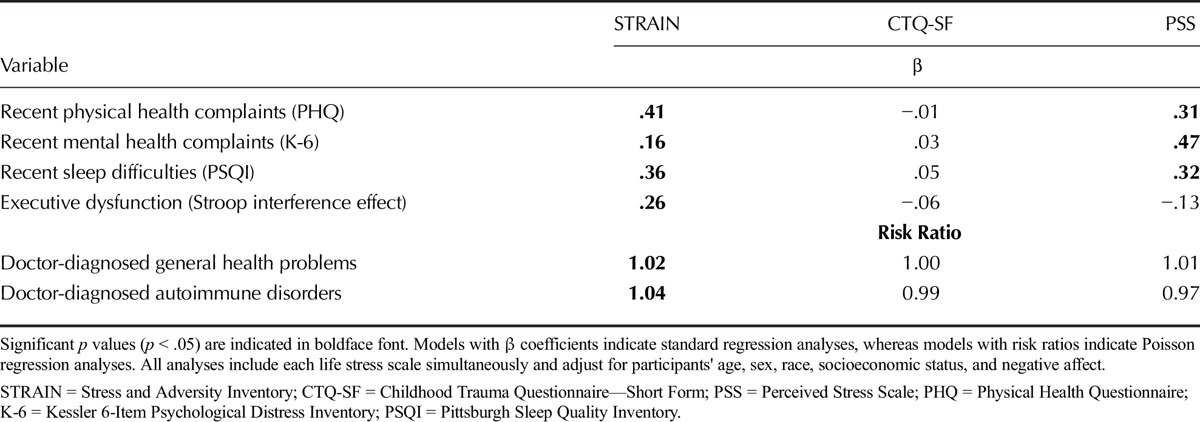
To examine the comparative predictive validity of the STRAIN, CTQ-SF, and PSS, we conducted analyses that included each instrument simultaneously, and that adjusted for participants' age, sex, race, socioeconomic status, and negative affect. As shown in Table 3, the STRAIN emerged as a significant predictor of all six health and cognitive outcomes measured. In addition, the STRAIN was the measure that correlated most strongly with every outcome assessed except for current mental health complaints, which was predicted more strongly by the PSS. In contrast, the CTQ-SF was not significantly associated with any of the health or cognitive outcomes measured, and the PSS was associated with only half of the outcomes measured. Notably, only the STRAIN predicted computer-assessed executive function ability, and doctor-diagnosed general health problems and autoimmune disorders, which are the three outcomes that are least likely to be influenced by respondent bias. In sum, then, the STRAIN exhibited outstanding predictive validity and outperformed the CTQ-SF and PSS in all but one instance.
TABLE 3.
Comparative Predictive Validity of the STRAIN, CTQ-SF, and PSS
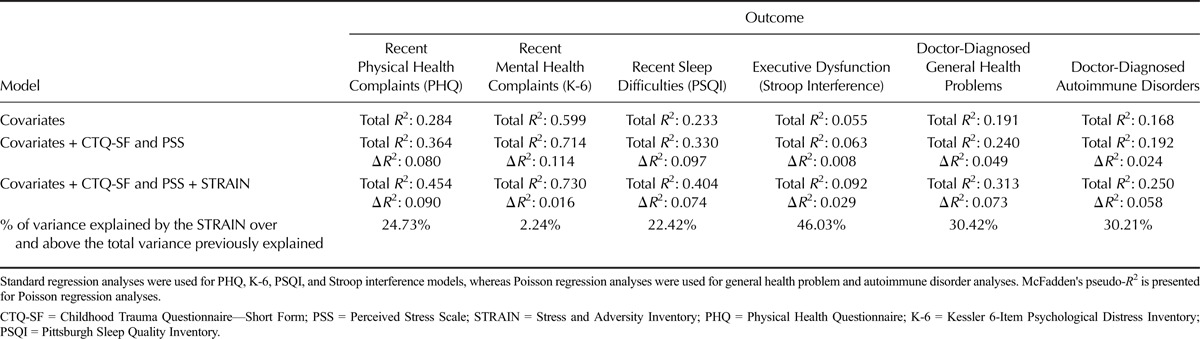
To more directly compare the STRAIN with the CTQ-SF and PSS, we followed these analyses by examining the percent of variance in each health and cognitive outcome that was explained by the STRAIN over and above the total percent of variance previously explained by the CTQ-SF, PSS, age, sex, race, socioeconomic status, and negative affect. As shown in Table 4, the STRAIN explained substantial amounts of variance above the total variance previously explained by the other stress scales and relevant covariates.
TABLE 4.
Variance Explained in Each Outcome in Each Hierarchical Regression Model
Test-Retest Reliability
Next, to assess the test-retest reliability of the STRAIN, we had 100 participants (selected at random) take the STRAIN at study entry and again 2 weeks later (median = 13 days; range, 9–36 days). All of the STRAIN's main lifetime stress exposure indices—including total lifetime stressor count and severity, both together and separated by acute life events and chronic difficulties—demonstrated very high test-retest reliability (r values ≥ .873, p values < .001). Most importantly, the two primary indices of lifetime stress exposure—namely, total lifetime stressor count and total lifetime stressor severity—achieved test-retest reliabilities of r = .919, p < .001, and r = .904, p < .001, respectively, thus providing evidence of excellent test-retest reliability over time.
Stress Exposure by Timing, Type, Life Domain, and Core Social-Psychological Characteristic
Finally, for illustrative purposes, we took advantage of the STRAIN's rich conceptual structure to disaggregate participants' total lifetime stressor count data into more nuanced indices based on timing of exposure, type of stressors experienced, primary life domain, and core social-psychological characteristic. As depicted in Figure 3A, females experienced more stressors in the life domains of treatment/health (p < .001), reproduction (p < .001), other relationships (p < .001), and death (p = .012). In contrast, males experienced more legal/crime stressors (p = .011). With respect to the core social-psychological characteristics, as depicted in Figure 3B, females experienced more interpersonal loss stressors (p = .006) and entrapment stressors (p = .044), and marginally more physical danger and humiliation stressors (p values < .057).
FIGURE 3.
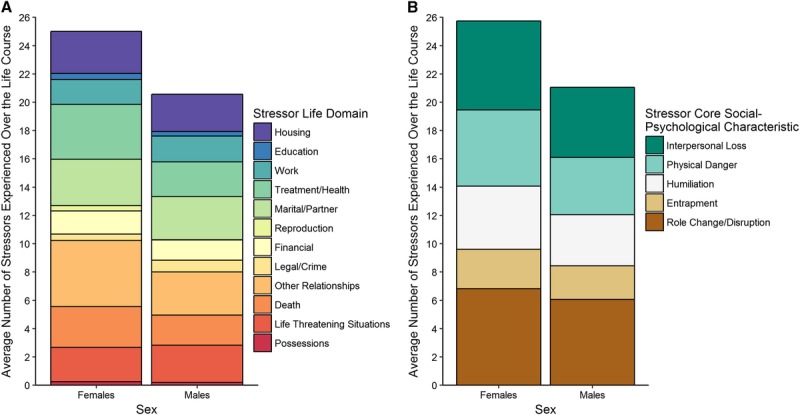
Lifetime stressor exposure by stressor category for males and females. (A) Examining participants' stress exposure by sex revealed that with respect to life domain females experienced more treatment/health stressors, reproduction stressors, other relationship stressors, and deaths; in contrast, males had more legal/crime stressors. (B) With respect to core-social psychological characteristics females experienced more interpersonal loss and entrapment stressors, and marginally more physical danger and humiliation stressors (N = 203). Color image is available only in online version (www.psychosomaticmedicine.org).
To examine the predictive validity of these and the other stressor characteristics in relation to participants' health, we conducted analyses predicting participants' likelihood of being diagnosed with an autoimmune disorder by stressor timing, type, primary domain, and core social-psychological characteristic. As can be seen in Figure 4, stressors did not have a uniform impact on participants' health. Rather, risk of being diagnosed with an autoimmune disorder varied widely as a function of the specific types of stressors that participants experienced. Stressors occurring in adulthood were more strongly associated with risk of being diagnosed with an autoimmune disorder as compared with stressors occurring in early life, and although acute life events and chronic difficulties both yielded significant associations, the relative risk was greater for chronic difficulties than for acute life events. Finally, with respect to primary life domain and core social-psychological characteristics, risk of being diagnosed with an autoimmune disorder was most strongly associated with stressors involving possessions, reproduction, death, interpersonal loss, and physical danger.
FIGURE 4.
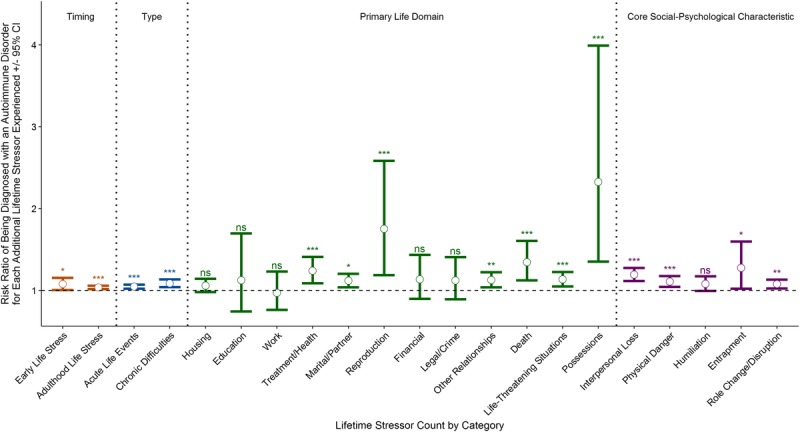
Likelihood of being diagnosed with an autoimmune disorder by stressor timing, type, primary domain, and core social-psychological characteristic. Risk of being diagnosed with an autoimmune disorder differed substantially by the type of life stressors experienced. More specifically, participants' risk was greater for those experiencing adulthood versus early life stressors and chronic versus acute stressors, as well as for those experiencing stressors involving possessions, reproduction, death, interpersonal loss, and physical danger. ns = not significant, *p < .05, **p < .01, ***p < .001 (N = 205). Color image is available only in online version (www.psychosomaticmedicine.org).
DISCUSSION
The formulation of more sophisticated theories of life stress and health has generated immense interest in how stressors occurring over the life-span alter psychological and biological processes that promote disease. It is striking, therefore, that of the thousands of articles written on this topic, only a few have measured lifetime stress exposure (50). The STRAIN aims to address this issue by providing investigators with an inexpensive, user-friendly, scalable, and reliable system for assessing all of the acute life events and chronic difficulties that an individual has experienced over his or her life course (51).
In the present sample of adults, participants completed the STRAIN in approximately 18 minutes. Although recalling stressful experiences could be thought of as emotionally difficult, participants found the STRAIN to be “interesting” and “easy-to-use,” and no STRAIN-related increases in negative mood were detected. Latent class analyses revealed a low-stress and high-stress group overall, and five distinct lifetime stress exposure trajectories over time. In addition, the STRAIN demonstrated good concurrent validity with the CTQ-SF and PSS, and was not significantly related to personality or social desirability characteristics that could bias results. Moreover, when we directly compared the STRAIN, CTQ-SF, and PSS in analyses that adjusted for each instrument as well as relevant covariates (i.e., participants' age, sex, race, socioeconomic status, and negative affect), the STRAIN emerged as the measure that was most strongly associated with all six health-related outcomes assessed except for mental health complaints. Indeed, the STRAIN was the only instrument that was significantly associated with the most objective outcomes measured in this study—namely, executive function, and doctor-diagnosed general health problems and autoimmune disorders—and it explained an average of 26% more variance above the total variance previously explained by the covariates, CTQ-SF, and PSS together (range: 2.24%–46.03%, depending on the outcome).
One problem plaguing many stress assessment instruments is poor test-retest reliability. This is frequently assumed to be caused by individuals' inability to accurately remember stressors that have occurred in the distant (or even recent) past (52). However, an equally likely contributor involves the fact that many stress assessment instruments include items that are not sufficiently precise to enable consistent reporting over time (22). If asked about having experienced “a recent illness or injury,” for example, a participant may endorse this item at one time point but not again, depending on how he or she interprets the meaning of the question at each assessment. The STRAIN was designed to address this issue by including substantial contextual information in each item, and as a result, the test-retest reliability of all of the main lifetime stress exposure indices over 2 weeks was excellent (all r values ≥ .873). Test-retest reliability for the primary lifetime stress exposure indices—namely, total lifetime stressor count and total lifetime stressor severity—was especially good (i.e., r values ≥ .904), even though these scores are based on accurately recalling the presence, frequency, and impact of 55 different stressors, some of which could have occurred many years ago.
Finally, we took advantage of the rich conceptual structure of the STRAIN to examine whether the effects of lifetime stress exposure on participants' health and executive function were different across the various types of stress assessed by the instrument. When we pursued this question by disaggregating the lifetime stress exposure data based on timing and type of exposure, primary life domain, and core social-psychological characteristic, several differences emerged by gender. Specifically, females experienced significantly more treatment/health, reproduction, other relationship, death, interpersonal loss, and entrapment stressors over the life-span, whereas males experienced significantly more legal/crime stressors over the life-span. In addition, there was some evidence of stressor-specific effects on participants' health, which we examined by assessing their stressor-associated likelihood of being diagnosed with an autoimmune disorder. In these analyses, participants' likelihood of having an autoimmune disorder was more strongly associated with adulthood versus early life stressors, and chronic versus acute stressors. With respect to life domain and core social-psychological characteristics, risk of having a doctor-diagnosed autoimmune disorder was greatest for those experiencing stressors involving possessions, reproduction, death, interpersonal loss, and physical danger. Ultimately, therefore, we expect that the STRAIN may be used as a vehicle for gaining additional clarity around the specific types of stressors that are most strongly related to different health outcomes. Such information could help researchers move beyond classic theories of stress, which posit that different stressors have similar biobehavioral consequences (53). In doing so, this work could also help inform the development of new theoretical frameworks that adopt a stressor characteristics approach to conceptualizing life stress (18,19,54–58).
The present study has several limitations that should be considered when interpreting the results. First, because the study design was largely cross sectional (with the exception of the longitudinal test-retest portion), all of the results are correlational, and causation, therefore, cannot be assumed. Second, scores on the STRAIN are based on participants' reports, and although we assessed associations between these scores and participants' personality and social desirability characteristics, self-reporting biases could still have influenced the results in unmeasured ways. Recently occurring stressors could also have influenced participants' reports of the stressors they experienced over the life-span. Third, biological samples were not collected as part of this study, and although we have previously validated the STRAIN against health-relevant biomarkers (27,28,30), additional research is needed to examine the robustness of these associations for outcomes that cannot possibly be influenced by self-report. Finally, males and females of differing ages were approximately equally represented in this study, but the present sample was not particularly diverse with respect to race or ethnicity. Future studies should thus evaluate the generalizability of the present associations in demographic groups that are more representative of the general population, as well as in specific clinical samples (e.g., patients with chronic pain, cardiovascular disease, cancer, accelerated cognitive decline, anxiety, depression, etc.).
Looking forward, several avenues for additional validation of the STRAIN are evident based on these limitations and the present results. First, additional research is needed to examine the test-retest reliability of the STRAIN over longer time periods, and the validity of the system in larger, more diverse samples, and across different cultures and languages. Second, although the vast majority of studies on stress and health utilize self-report checklist measures of stress, future work should compare the STRAIN to interview-based systems that generate independent, expert-rated life stress scores. Finally, as alluded to already, future research should examine the predictive validity of the STRAIN in relation to other health-related biological processes and clinical outcomes, especially those that cannot be influenced by self-report biases (e.g., cortisol and cytokine levels, telomere length, doctor-diagnosed disorders derived from clinical chart review, etc.). The STRAIN is particularly well suited for multilevel studies examining how past lifetime stress exposure moderates baseline psychosocial or biological functioning—or changes in these processes over time—but prospective studies can also be designed by employing a “1-year” version of the STRAIN that assesses stress exposure occurring only over the past year.
We can also foresee several avenues for further developing the STRAIN. First, we would like to refine the STRAIN by identifying stressors that strongly and consistently predict health outcomes, and by removing questions that do not. Second, we can envision developing additional branching logic to provide a more comprehensive picture of each life stressor that is assessed. This information will be important for advancing theory and research, but may one day also enable the STRAIN to automatically generate objective scores that are similar to those produced by other interview-based measures of life stress. Third, we will seek to partner with trusted collaborators to translate the STRAIN into different languages. Finally, we would like to develop Stress Assessment Modules (i.e., SAMs) containing 5–10 questions to provide additional high-resolution coverage of stressors that are particularly salient or important for certain populations (e.g., students, caregivers, older adults, cancer patients, war veterans, etc.).
In conclusion, the present data suggest that the STRAIN reliably assesses lifetime stress exposure in an inexpensive, user-friendly, noninvasive manner. The system demonstrates good concurrent validity with other measures of stress and is not influenced by personality or social desirability characteristics that could provide alternative explanations for the associations observed. The STRAIN was also associated with several different aspects of health and cognition, including self-reported physical and mental health complaints, sleep quality, executive function, and doctor-diagnosed general health problems and autoimmune disorders. As such, the STRAIN is not intended to be a substitute for more costly systems like the Life Events and Difficulties Schedule, but is a very practical and sensible solution for investigators and clinicians who are looking to obtain a panoramic snapshot of individuals' stress exposure across the life course.
Supplementary Material
Acknowledgments
Source of Funding and Conflicts of Interest: The authors declare that they have no conflicts of interest with respect to this study, their authorship, or the publication of this article. This study was supported by a Society in Science—Branco Weiss Fellowship, NARSAD Young Investigator Grant No. 23958 from the Brain & Behavior Research Foundation, and National Institutes of Health Grant K08 MH103443 to George M. Slavich.
1Negative affect data were not available for all participants.
The article is based on the Herbert E. Weiner Early Career Award Lecture presented by award recipient George M. Slavich, PhD, on March 12, 2016, at the 74th Annual Scientific Meeting of the American Psychosomatic Society in Denver, Colorado.
Supplemental Content
REFERENCES
- 1.Monroe SM, Slavich GM, Georgiades K. The social environment and depression: the roles of life stress. In: Gotlib IH, Hammen CL, eds. Handbook of Depression, 3rd ed New York: The Guilford Press; 2014:296–314. [Google Scholar]
- 2.Shields GS, Slavich GM. Lifetime stress exposure and health: a review of contemporary assessment methods and biological mechanisms. Soc Personal Psychol Compass 2017;11(8):e12335. [DOI] [PMC free article] [PubMed] [Google Scholar]
- 3.Ader R. Presidential address—1980. Psychosomatic and psychoimmunologic research. Psychosom Med 1980;42:307–21. [DOI] [PubMed] [Google Scholar]
- 4.Kagan J. An overly permissive extension. Perspect Psychol Sci 2016;11:442–50. [DOI] [PubMed] [Google Scholar]
- 5.Goldberger L, Breznitz S. (Eds). Handbook of Stress, New York, NY: Simon and Schuster; 2010. [Google Scholar]
- 6.Cohen S, Janicki-Deverts D, Miller GE. Psychological stress and disease. JAMA 2007;298:1685–7. [DOI] [PubMed] [Google Scholar]
- 7.Kendler KS, Karkowski LM, Prescott CA. Causal relationship between stressful life events and the onset of major depression. Am J Psychiatry 1999;156:837–41. [DOI] [PubMed] [Google Scholar]
- 8.Krantz DS, Kop WJ, Santiago HT, Gottdiener JS. Mental stress as a trigger of myocardial ischemia and infarction. Cardiol Clin 1996;14:271–87. [PubMed] [Google Scholar]
- 9.Leserman J. Role of depression, stress, and trauma in HIV disease progression. Psychosom Med 2008;70:539–45. [DOI] [PubMed] [Google Scholar]
- 10.Slavich GM. Life stress and health: a review of conceptual issues and recent findings. Teach Psychol 2016;43:346–55. [DOI] [PMC free article] [PubMed] [Google Scholar]
- 11.Epel ES, Blackburn EH, Lin J, Dhabhar FS, Adler NE, Morrow JD, Cawthon RM. Accelerated telomere shortening in response to life stress. Proc Natl Acad Sci U S A 2004;101:17312–5. [DOI] [PMC free article] [PubMed] [Google Scholar]
- 12.Rosengren A, Orth-Gomér K, Wedel H, Wilhelmsen L. Stressful life events, social support, and mortality in men born in 1933. BMJ 1993;307:1102–5. [DOI] [PMC free article] [PubMed] [Google Scholar]
- 13.Graham JE, Christian LM, Kiecolt-Glaser JK. Stress, age, and immune function: toward a lifespan approach. J Behav Med 2006;29:389–400. [DOI] [PMC free article] [PubMed] [Google Scholar]
- 14.McEwen BS. Stress, adaptation, and disease. Allostasis and allostatic load. Ann N Y Acad Sci 1998;840:33–44. [DOI] [PubMed] [Google Scholar]
- 15.Lupien SJ, McEwen BS, Gunnar MR, Heim C. Effects of stress throughout the lifespan on the brain, behaviour and cognition. Nat Rev Neurosci 2009;10:434–45. [DOI] [PubMed] [Google Scholar]
- 16.Dhabhar FS. A hassle a day may keep the doctor away: stress and the augmentation of immune function. Integr Comp Biol 2002;42:556–64. [DOI] [PubMed] [Google Scholar]
- 17.Miller AH, Raison CL. The role of inflammation in depression: from evolutionary imperative to modern treatment target. Nat Rev Immunol 2016;16:22–34. [DOI] [PMC free article] [PubMed] [Google Scholar]
- 18.Slavich GM, Cole SW. The emerging field of human social genomics. Clin Psychol Sci 2013;1:331–48. [DOI] [PMC free article] [PubMed] [Google Scholar]
- 19.Slavich GM, Irwin MR. From stress to inflammation and major depressive disorder: a social signal transduction theory of depression. Psychol Bull 2014;140:774–815. [DOI] [PMC free article] [PubMed] [Google Scholar]
- 20.Bush NR, Lane RD, McLaughlin KA. Mechanisms underlying the association between early-life adversity and physical health: charting a course for the future. Psychosom Med 2016;78:1114–9. [DOI] [PMC free article] [PubMed] [Google Scholar]
- 21.Cohen S, Kessler RC, Gordon Underwood L. (Eds). Measuring Stress: A Guide for Health and Social Scientists, New York, NY: Oxford University Press; 1995. [Google Scholar]
- 22.Dohrenwend BP. Inventorying stressful life events as risk factors for psychopathology: toward resolution of the problem of intracategory variability. Psychol Bull 2006;132:477–95. [DOI] [PMC free article] [PubMed] [Google Scholar]
- 23.Monroe SM. Modern approaches to conceptualizing and measuring human life stress. Annu Rev Clin Psychol 2008;4:33–52. [DOI] [PubMed] [Google Scholar]
- 24.Monroe SM, Slavich GM. Psychological stressors: overview. In: Fink G, ed. Stress: Concepts, Cognition, Emotion, and Behavior, 1st ed Cambridge, MA: Academic Press; 2016:109–15. [Google Scholar]
- 25.Slavich GM. Psychopathology and stress. In: Miller HL, editor. The SAGE Encyclopedia of Theory in Psychology, 1st ed Thousand Oaks, CA: SAGE Publications; 2016:762–4. [Google Scholar]
- 26.Brown GW, Harris TO. Social Origins of Depression: A Study of Psychiatric Disorder in Women, New York, NY: The Free Press; 1978. [Google Scholar]
- 27.Lam JCW, Shields GS, Trainor BC, Slavich GM, Yonelinas AP. Greater lifetime stress exposure predicts blunted cortisol but heightened DHEA reactivity to acute stress, 2017. Under review. [DOI] [PMC free article] [PubMed]
- 28.Kurtzman L, O'Donovan A, Koslov K, Arenander J, Epel ES, Slavich GM. Sweating the big stuff: dispositional pessimism exacerbates the deleterious effects of life stress on metabolic health. Eur J Psychotraumatol 2012;3. [Google Scholar]
- 29.Goldfarb EV, Shields GS, Daw ND, Slavich GM, Phelps EA. Low lifetime stress exposure is associated with reduced stimulus-response memory. Learn Mem 2017;24:162–8. [DOI] [PMC free article] [PubMed] [Google Scholar]
- 30.Cuneo MG, Schrepf A, Slavich GM, Thaker PH, Goodheart M, Bender D, Cole SW, Sood AK, Lutgendorf SK. Diurnal cortisol rhythms, fatigue and psychosocial factors in five-year survivors of ovarian cancer. Psychoneuroendocrinology 2017;84:139–42. [DOI] [PMC free article] [PubMed] [Google Scholar]
- 31.Bower JE, Crosswell AD, Slavich GM. Childhood adversity and cumulative life stress: risk factors for cancer-related fatigue. Clin Psychol Sci 2014;2:108–15. [DOI] [PMC free article] [PubMed] [Google Scholar]
- 32.Dooley LN, Slavich GM, Moreno PI, Bower JE. Strength through adversity: moderate lifetime stress exposure is associated with psychological resilience in breast cancer survivors. Stress Health. In press. doi:10.1002/smi.2739. [DOI] [PMC free article] [PubMed] [Google Scholar]
- 33.Shields GS, Moons WG, Slavich GM. Better executive function under stress mitigates the effects of recent life stress exposure on health in young adults. Stress 2017;20:75–85. [DOI] [PMC free article] [PubMed] [Google Scholar]
- 34.Toussaint L, Shields GS, Dorn G, Slavich GM. Effects of lifetime stress exposure on mental and physical health in young adulthood: how stress degrades and forgiveness protects health. J Health Psychol 2016;21:1004–14. [DOI] [PMC free article] [PubMed] [Google Scholar]
- 35.Bernstein DP, Stein JA, Newcomb MD, Walker E, Pogge D, Ahluvalia T, Zule W. Development and validation of a brief screening version of the Childhood Trauma Questionnaire. Child Abuse Negl 2003;27:169–90. [DOI] [PubMed] [Google Scholar]
- 36.Cohen S. Perceived stress in a probability sample of the United States. In: Spacapan S, Oskamp S, eds. The Social Psychology of Health: The Claremont Symposium on Applied Social Psychology, Thousand Oaks, CA: Sage Publications; 1988:31–67. [Google Scholar]
- 37.Cohen S, Kamarck T, Mermelstein R. A global measure of perceived stress. J Health Soc Behav 1983;24:385–96. [PubMed] [Google Scholar]
- 38.Gosling SD, Rentfrow PJ, Swann WB. A very brief measure of the Big-Five personality domains. J Res Pers 2003;37:504–28. [Google Scholar]
- 39.Stöber J. The Social Desirability Scale-17 (SDS-17): convergent validity, discriminant validity, and relationship with age. Eur J Psychol Assess 2001;17:222–32. [Google Scholar]
- 40.Watson D, Clark LA, Tellegen A. Development and validation of brief measures of positive and negative affect: the PANAS scales. J Pers Soc Psychol 1988;54:1063–70. [DOI] [PubMed] [Google Scholar]
- 41.de Leeuw JR. jsPsych: a JavaScript library for creating behavioral experiments in a Web browser. Behav Res Methods 2015;47:1–12. [DOI] [PubMed] [Google Scholar]
- 42.Chetverikov A, Upravitelev P. Online versus offline: the Web as a medium for response time data collection. Behav Res Methods 2016;48:1086–99. [DOI] [PubMed] [Google Scholar]
- 43.de Leeuw JR, Motz BA. Psychophysics in a Web browser? Comparing response times collected with JavaScript and Psychophysics Toolbox in a visual search task. Behav Res Methods 2016;48:1–12. [DOI] [PubMed] [Google Scholar]
- 44.Hilbig BE. Reaction time effects in lab-versus Web-based research: experimental evidence. Behav Res Methods 2016;48:1718–24. [DOI] [PubMed] [Google Scholar]
- 45.Diamond A. Executive functions. Annu Rev Psychol 2013;64:135–68. [DOI] [PMC free article] [PubMed] [Google Scholar]
- 46.Buysse DJ, Reynolds CF, Monk TH, Berman SR, Kupfer DJ. The Pittsburgh Sleep Quality Index: a new instrument for psychiatric practice and research. Psychiatry Res 1989;28:193–213. [DOI] [PubMed] [Google Scholar]
- 47.Knutson KL, Rathouz PJ, Yan LL, Liu K, Lauderdale DS. Stability of the Pittsburgh Sleep Quality Index and the Epworth Sleepiness Questionnaires over 1 year in early middle-aged adults: the CARDIA study. Sleep 2006;29:1503–6. [DOI] [PubMed] [Google Scholar]
- 48.Kessler RC, Andrews G, Colpe LJ, Hiripi E, Mroczek DK, Normand SL, Zaslavsky AM. Short screening scales to monitor population prevalences and trends in non-specific psychological distress. Psychol Med 2002;32:959–76. [DOI] [PubMed] [Google Scholar]
- 49.Schat AC, Kelloway EK, Desmarais S. The Physical Health Questionnaire (PHQ): construct validation of a self-report scale of somatic symptoms. J Occup Health Psychol 2005;10:363–81. [DOI] [PubMed] [Google Scholar]
- 50.Malat J, Jacquez F, Slavich GM. Measuring lifetime stress exposure and protective factors in life course research on racial inequality and birth outcomes. Stress 2017;20:379–85. [DOI] [PMC free article] [PubMed] [Google Scholar]
- 51.Slavich GM, Toussaint L. Using the Stress and Adversity Inventory as a teaching tool leads to significant learning gains in two courses on stress and health. Stress Health 2014;30:343–52. [DOI] [PMC free article] [PubMed] [Google Scholar]
- 52.Maughan B, Rutter M. Retrospective reporting of childhood adversity: issues in assessing long-term recall. J Pers Disord 1997;11:19–33. [DOI] [PubMed] [Google Scholar]
- 53.Selye H. The evolution of the stress concept. Am Sci 1973;61:692–9. [PubMed] [Google Scholar]
- 54.Slavich GM, Thornton T, Torres LD, Monroe SM, Gotlib IH. Targeted rejection predicts hastened onset of major depression. J Soc Clin Psychol 2009;28:223–43. [DOI] [PMC free article] [PubMed] [Google Scholar]
- 55.Slavich GM, O'Donovan A, Epel ES, Kemeny ME. Black sheep get the blues: a psychobiological model of social rejection and depression. Neurosci Biobehav Rev 2010;35:39–45. [DOI] [PMC free article] [PubMed] [Google Scholar]
- 56.Brown GW, Harris TO, Hepworth C. Loss, humiliation and entrapment among women developing depression: a patient and non-patient comparison. Psychol Med 1995;25:7–21. [DOI] [PubMed] [Google Scholar]
- 57.Kemeny ME. The psychobiology of stress. Curr Direct Psychol Sci 2003;12:124–9. [Google Scholar]
- 58.Slavich GM, Tartter MA, Brennan PA, Hammen C. Endogenous opioid system influences depressive reactions to socially painful targeted rejection life events. Psychoneuroendocrinology 2014;49:141–9. [DOI] [PMC free article] [PubMed] [Google Scholar]
Associated Data
This section collects any data citations, data availability statements, or supplementary materials included in this article.