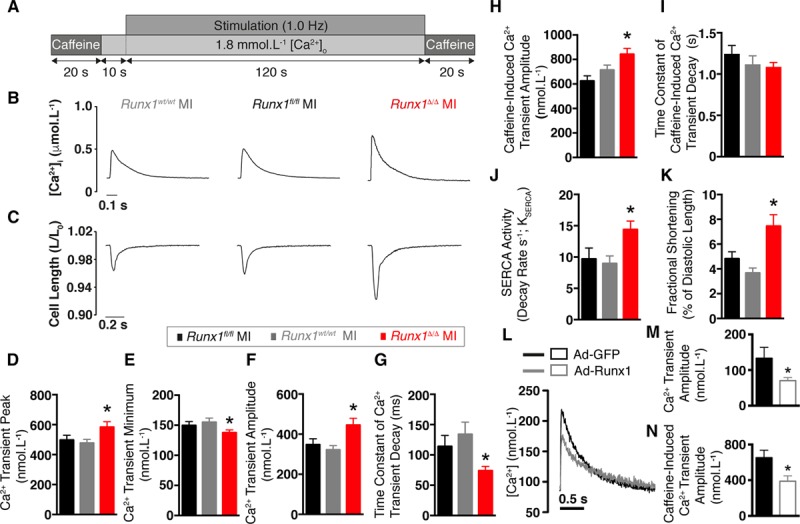
Figure 4.

Excitation-contraction coupling in Runx1Δ/Δ mice 2 weeks after myocardial infarction (MI). A, Protocol, (B) typical calcium (Ca2+) transients, and (C) cell shortening. Mean Ca2+ transient: (D) peak, (E) minimum, and (F) amplitude (Runx1fl/fl MI [n=25 cardiomyocytes, n=3 hearts], Runx1wt/wt MI [n=28 cardiomyocytes, n=4 hearts], Runx1Δ/Δ MI [n=28 cardiomyocytes, n=3 hearts]). *P<0.05, Runx1Δ/Δ MI vs. Runx1fl/fl MI and Runx1wt/wt MI combined, linear mixed modeling. G, Mean time constant of Ca2+ transient decay. H, Mean caffeine-induced Ca2+ transient amplitude. I, Mean time constant of decay for caffeine-induced Ca2+ transient amplitude. J, Mean sarcoendoplasmic reticulum calcium transport ATPase (SERCA) activity. K, Mean fractional shortening (Runx1fl/fl MI [n=27 cardiomyocytes, n=3 hearts], Runx1wt/wt MI [n=27 cardiomyocytes, n=4 hearts], Runx1Δ/Δ MI [n=23 cardiomyocytes, n=3 hearts]). L, Ca2+ transients from cardiomyocytes transduced with enhanced green fluorescent protein (Ad-GFP) or Ad-Runx1. M, Mean Ca2+ transient peak; Ad-GFP (n=16 cardiomyocytes, n=6 hearts) and Ad-Runx1 (n=22 cardiomyocytes, n=6 hearts). *P<0.05, linear mixed modeling. N, Caffeine-induced Ca2+ transient amplitude, Ad-GFP (n=13 cardiomyocytes, n=6 hearts), and Ad-Runx1 (n=19 cardiomyocytes, n=6 hearts). *P<0.05, linear mixed modeling.
