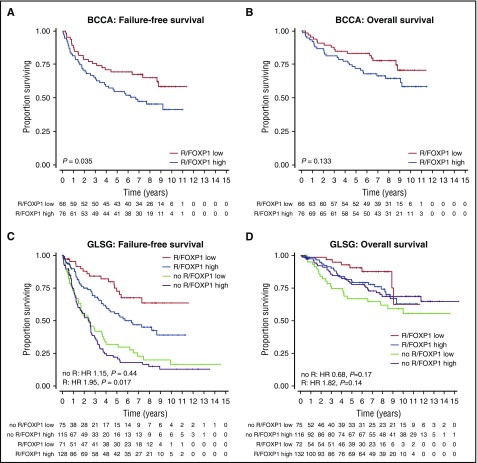
Figure 2.
FOXP1 protein expression levels identify a group of patients with inferior failure-free survival. (A) In the training cohort, we applied log-rank statistics to determine the cutoff value of percent FOXP1-positive tumor cells at which the best separation between rates of FFS in 2 groups could be achieved. The cutoff point was subsequently locked at >10% and transferred to the validation cohort. Five-year FFS was 55% vs 70% in patients with high and low FOXP1 expression, respectively. (B) OS by FOXP1 expression status in the training cohort. Five-year OS was 72% vs 83% in patients with high and low FOXP1 expression, respectively. (C) FOXP1 protein expression was significantly associated with FFS in the validation cohort in R-CHOP–treated patients. Five-year FFS for high vs low FOXP1 expression was 22% vs 32% in CHOP-treated patients and 55% vs 72% in R-CHOP–treated patients. (D) No clear association between FOXP1 expression and OS was found in the validation cohort.

