Figure 3.
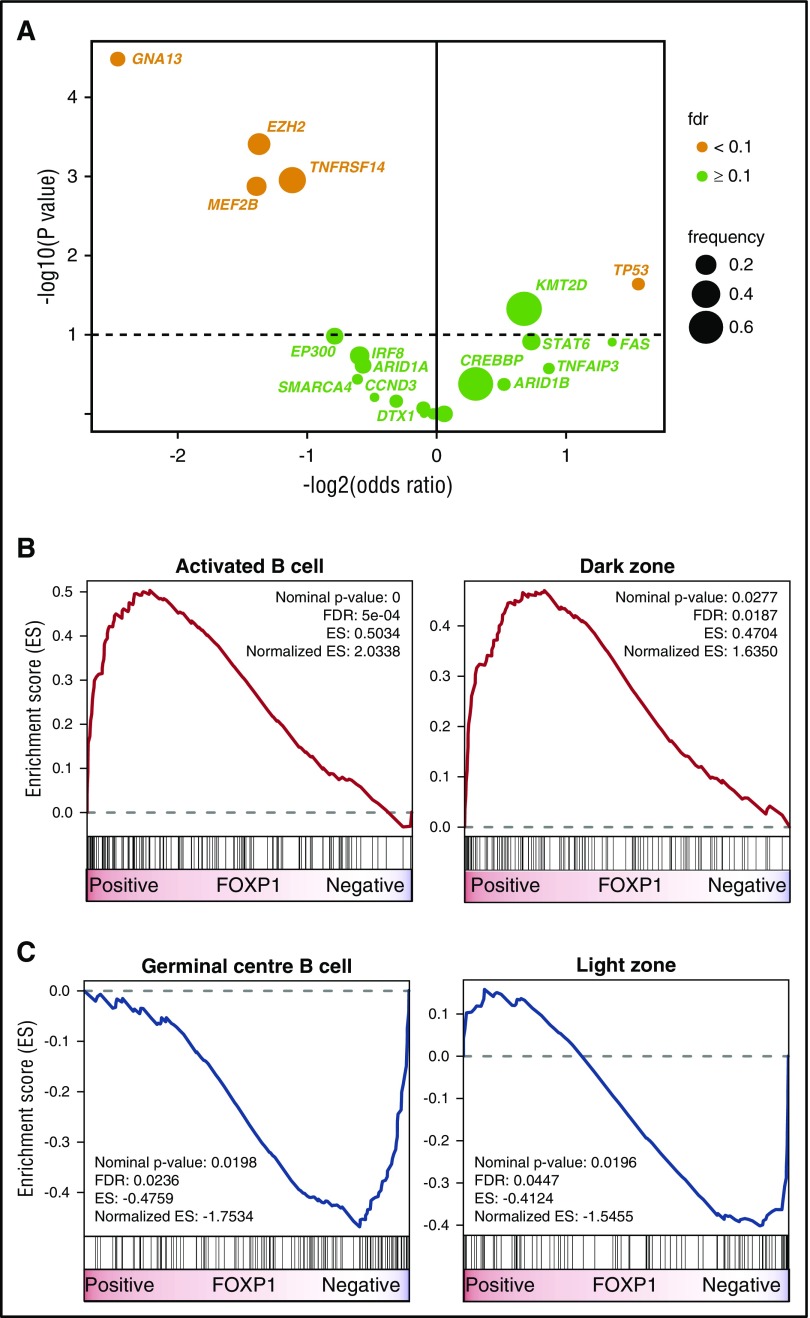
FOXP1 expression identifies FL with distinct molecular features. (A) Volcano plot displaying gene mutations associated with FOXP1 expression. Only genes that were mutated in >5% of patients in the data sets of either Pastore et al20 or Kridel et al11 (n = 22 genes; n = 324 FL samples) were considered. After adjustment for false discovery, 5 gene mutations were found to be significantly associated with FOXP1 expression. GNA13, EZH2, TNFRSF14, and MEF2B mutations were enriched in cases with low FOXP1 expression (ORs: 0.18, 0.39, 0.46, and 0.38, respectively), whereas TP53 mutations were more commonly observed in cases with high FOXP1 expression (OR, 2.94). (B) GSEA shows that an activated B-cell signature and a signature derived from normal GC dark zone cells were significantly enriched in cases with high FOXP1 expression. (C) Conversely, a GCB signature and genes related to normal GC light zone cells were significantly enriched in cases with low FOXP1 expression. ES, enrichment score.

