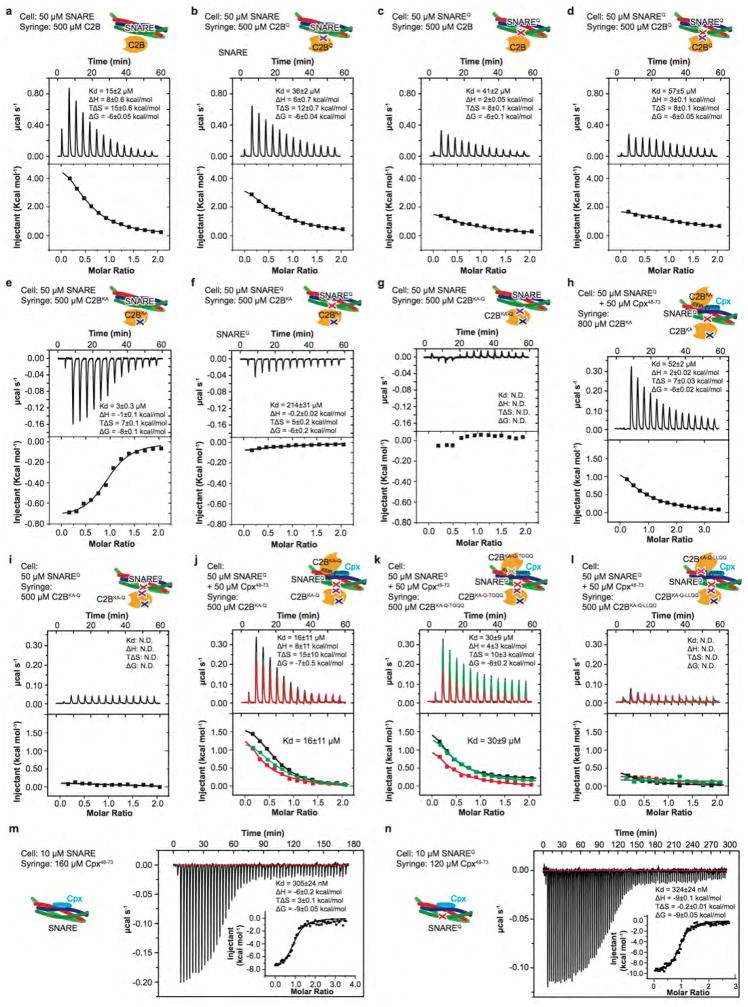
Extended Data Figure 4. ITC binding data and analyses.
a–k, Differential power traces and heats of injection traces of the specified samples in the syringe and the cell of the ITC instrument. The experimental conditions are described in the Methods. For panels j-l, three independent experimental repeats were performed, and all ITC data curves are shown; shown are means ± s.e.m. for three independent repeat experiments.. For all other ITC experiments, the error bars were obtained from a fit of the data points of the particular ITC-experiments. The schemas in the insets summarize the mutations used in the particular experiments. The ITC experiments produce well-determined n vales for the following experiments: C2BKA titrated into the SNARE complex (n=0.94±0.02), Cpx48-73 titrated into the SNARE complex (n=0.97±0.02) or the SNAREQ complex (n=0.98±0.01). For the other ITC experiments, it was difficult to achieve high enough concentrations of the injected sample to obtain optimal conditions for reliable determination of n. N.D., not detectable. Experimental conditions are described in the Methods.

