Abstract
There is an urgent need for identifying nondemented individuals at the highest risk of progressing to Alzheimer’s disease (AD) dementia. Here, we evaluated whether a recently validated polygenic hazard score (PHS) can be integrated with known in vivo cerebrospinal fluid (CSF) or positron emission tomography (PET) biomarkers of amyloid, and CSF tau pathology to prospectively predict cognitive and clinical decline in 347 cognitive normal (CN; baseline age range = 59.7–90.1, 98.85% white) and 599 mild cognitively impaired (MCI; baseline age range = 54.4–91.4, 98.83% white) individuals from the Alzheimer’s Disease Neuroimaging Initiative 1, GO, and 2. We further investigated the association of PHS with post-mortem amyloid load and neurofibrillary tangles in the Religious Orders Study and Memory and Aging Project (ROSMAP) cohort (N = 485, age at death range = 71.3–108.3). In CN and MCI individuals, we found that amyloid and total tau positivity systematically varies as a function of PHS. For individuals in greater than the 50th percentile PHS, the positive predictive value for amyloid approached 100%; for individuals in less than the 25th percentile PHS, the negative predictive value for total tau approached 85%. High PHS individuals with amyloid and tau pathology showed the steepest longitudinal cognitive and clinical decline, even among APOE ε4 noncarriers. Among the CN subgroup, we similarly found that PHS was strongly associated with amyloid positivity and the combination of PHS and biomarker status significantly predicted longitudinal clinical progression. In the ROSMAP cohort, higher PHS was associated with higher post-mortem amyloid load and neurofibrillary tangles, even in APOE ε4 noncarriers. Together, our results show that even after accounting for APOE ε4 effects, PHS may be useful in MCI and preclinical AD therapeutic trials to enrich for biomarker-positive individuals at highest risk for short-term clinical progression.
Keywords: Polygenic risk, Amyloid, Tau, Alzheimer’s disease
Introduction
Accumulating genetic, molecular, biomarker and clinical evidence indicates that the pathobiological changes underlying late-onset Alzheimer’s disease (AD) begin 20–30 years before the onset of clinical symptoms [14, 25]. AD-associated pathology may follow a temporal sequence, whereby β-amyloid deposition (i.e., assessed in vivo as reductions in cerebrospinal fluid (CSF) levels of Aβ1–42 or elevated amyloid positron emission tomography (PET)) precedes tau accumulation (i.e., assessed in vivo as elevated CSF total tau) and neurodegeneration [13]. Given the large societal and clinical impact associated with AD dementia, there is an urgent need to identify and therapeutically target nondemented older individuals with amyloid or tau pathology at greatest risk of progressing to dementia.
A large body of work has shown that genetic risk factors such as the ε4 allele of apolipoprotein E (APOE) modulate amyloid pathology and shift clinical AD dementia onset to an earlier age [15]. Beyond APOE ε4, numerous single-nucleotide polymorphisms (SNPs) have now been shown to be associated with small increases in AD dementia risk [16]. Based on a combination of APOE and 31 other genetic variants, we have developed and validated a ‘polygenic hazard score’ (PHS) for quantifying AD dementia age of onset [8]. Importantly, PHS was associated with in vivo biomarkers of AD pathology such as reduced CSF Aβ1–42 and elevated CSF total tau across the AD spectrum (in older controls, MCI and AD dementia individuals). Further, using a large prospective clinical cohort, we have recently shown that PHS predicts time to AD dementia and longitudinal multi-domain cognitive decline in cognitively normal older (CN) individuals and in patients with mild cognitive impairment (MCI) [27].
However, the value of combining PHS with in vivo biomarkers of AD pathology to predict cognitive and clinical progression among nondemented MCI and CN older individuals remains unknown, and may improve the ability to identify nondemented individuals most at risk for short-term decline. Here, among MCI and CN individuals, we evaluated whether PHS can be useful as a marker for enriching and stratifying Alzheimer’s associated amyloid and tau pathology, and whether PHS in conjunction with biomarker status is predictive of longitudinal progression.
Methods
Participants and clinical characterization
Alzheimer’s Disease Neuroimaging Initiative
We evaluated individuals with genetic, clinical, neuropsychological, PET and CSF measurements from the Alzheimer’s Disease Neuroimaging Initiative 1, GO, and 2 (ADNI1, ADNI-GO, and ADNI2, see Supplemental Material). We restricted analyses to CN individuals (n = 347, baseline age range = 59.7–90.1) and patients diagnosed with MCI (n = 599, baseline age range = 54.4–91.4), who had both genetics and CSF or PET biomarkers (CSF Aβ1–42, CSF total tau, or PET 18F-AV45) data at baseline. We used previously established thresholds of < 192 pg/mL, > 23 pg/mL [23] and > 1.1 [17] to indicate ‘positivity’ for CSF Aβ1–42, CSF total tau and PET 18F-AV45, respectively. We classified individuals as amyloid ‘positive’ if they reached either CSF Aβ1–42 or PET 18F-AV45 threshold for positivity, given that PET and CSF amyloid biomarkers provide highly correlated measurements of intracranial amyloid deposition [9]. Cohort demographics from ADNI are summarized in Table 1.
Table 1.
Alzheimer’s disease neuroimaging initiative (ADNI) cohort demographics
| CN (n = 347) | MCI (n = 599) | |
|---|---|---|
| Baseline age ± SD | 74.02 (5.85) | 72.46 (7.47) |
| Education ± SD | 16.48 (2.62) | 16.17 (2.78) |
| Sex (% female) | 168 (48.41) | 355 (59.27) |
| APOE ε4 carriers (%) | 96 (27.67) | 301 (50.25) |
| Mean follow-up years ± SD | 4.11 (2.54) | 3.94 (1.98) |
| Converted to AD dementia (%) | 13 (3.75) | 201 (33.56) |
| Baseline MMSE ± SD | 29.05 (1.19) | 27.81 (1.77) |
| PHS ± SD | 0.03 (0.63) | 0.45 (0.79) |
| CSF Aβ1–42 (% positive) | n = 322 (42.85) | n = 571 (66.37) |
| PET 18F-AV45 (% positive) | n = 246 (36.59) | n = 422 (56.87) |
| CSF total tau (% positive) | n = 321 (20.25) | n = 202 (33.72) |
MMSE mini-mental state examination, PHS polygenic hazard score, CSF cerebrospinal fluid, PET positron emission tomography
Religious Orders Study and Memory and Aging Project
We evaluated 485 individuals (age at death range = 71.3–108.3) with genetic, clinical and neuropathology data from the Religious Orders Study and Memory and Aging Project (ROSMAP) [1, 2, 24]. We recalculated PHS as described in [8] after excluding all ROSMAP individuals. Cohort demographics from ROSMAP are summarized in Table 2.
Table 2.
Religious order study and memory and aging project (ROS-MAP) cohort demographics
| N = 485 | |
|---|---|
| Age at death ± SD | 89.42 (6.34) |
| Sex (% female) | 331 (68.25) |
| APOE ε4 carriers (%) | 136 (28.04) |
| PHS ± SD | − 0.06 (0.45) |
| Diagnosis (CN/MCI/AD dementia) | 194/23/268 |
| Amyloid beta protein (msqrt ± SD) | 1.75 (1.17) |
| Neurofibrillary tangles (msqrt ± SD) | 1.71 (1.36) |
PHS polygenic hazard score, msqrt mean of the square-root of percentage of cortex occupied by amyloid/tangles in 8 brain regions, CN cognitively normal, MCI mild cognitive impairment, AD dementia Alzheimer’s disease dementia
Polygenic hazard score (PHS)
For each ADNI and ROSMAP participant in this study, we calculated their individual PHS, as previously described [8]. In brief, we first delineated AD-associated SNPs (at p < 10−5) using genotype data from 17,008 AD cases and 37,154 controls from Stage 1 of the International Genomics of Alzheimer’s Project. Next, using genotype data from 6409 AD patients and 9386 older controls from Phase 1 of the Alzheimer’s disease genetics consortium (ADGC Phase 1), and corrected for the baseline allele frequencies using European genotypes from 1000 Genomes Project, we identified a total of 31 AD-associated SNPs from a stepwise Cox proportional hazards model to derive a polygenic hazard score (PHS) for each participant. Finally, by combining US population-based incidence rates and the genotype-derived PHS for each individual, we derived estimates of instantaneous risk for developing AD dementia based on genotype and age. In this study, the PHS computed for every participant represents the vector product of an individual’s genotype for the 31 SNPs and the corresponding parameter estimates from the ADGC Phase 1 Cox proportional hazard model in addition to the APOE effects. The 31 SNPs and parameter estimates are described in [8].
Statistical analysis
Using logistic regression, we first evaluated the relationship between PHS (centered and scaled) and baseline amyloid and total tau positivity (binarized as positive or negative) in CN and MCI individuals combined and separately. In these analyses, we controlled for age at baseline, sex, education, and APOE ε4 status (binarized as having at least one copy of the ε4 allele versus none). We further ascertained the ‘enrichment’ in amyloid and total tau positive predictive value (PPV), and negative predictive value (NPV) for clinical progression to AD dementia, as a function of PHS percentiles.
Next, we used linear mixed-effects (LME) models in CN and MCI individuals to investigate whether a statistical interaction between PHS and amyloid or total tau status significantly predicted longitudinal cognitive decline and clinical progression (mean follow-up time = 4.01 years, SD = 2.20 years, range = 0.24–10.26 years). We conducted LME models separately for amyloid and total tau. We defined cognitive decline using change scores in two domains, namely executive function and memory, based on composite scores developed using the ADNI neuropsychological battery and validated using confirmatory factor analysis [10]. We defined clinical progression using change scores in cognitive dementia rating sum of boxes (CDR-SB). We examined the main and interaction effects of PHS and biomarker positivity on cognitive decline and clinical progression rate, controlling for age, sex, education, APOE ε4 status, using the following LME model:
Here, Δc = cognitive decline (executive function or memory) or clinical progression (CDR-SB) rate, Δt = change in time from baseline visit (years), biomarker_status = positive or negative for amyloid or total tau, and (1|subject) specifies the random intercept. We were specifically interested in PHS × biomarker_status × Δt, whereby a significant interaction indicates differences in rates of decline, as a function of differences in PHS and biomarker status. We then examined the simple main effects by comparing slopes of cognitive decline and clinical progression over time for individuals who were biomarker positive or negative, and with either high (~ 84 percentile) or low PHS (~ 16 percentile). We defined high and low PHS by 1 standard deviation above or below the mean of PHS, respectively [5]. To assess the added utility of PHS in predicting cognitive and clinical decline, we used likelihood ratio tests to compare the LME models with and without PHS.
Using a survival analysis framework, we next investigated the value of combining PHS with amyloid and total tau biomarker status to predict time to AD dementia progression. Specifically, we examined the effects of (1) PHS, (2) PHS in individuals who were amyloid positive, and (3) PHS in individuals who were amyloid and total tau positive, on time to AD dementia progression using a Cox proportional hazards model. We resolved ‘ties’ using the Breslow method. We covaried for sex, education, APOE ε4 status, age at baseline, and also age at baseline stratified into quintiles to adjust for violations of Cox proportional hazards assumptions by baseline age [27]. We restricted survival analyses, which involves AD dementia censoring, as well as the PPV/NPV analyses (see above) to the combined CN and MCI groups only as the CN individuals had low conversion rates during the observation period (< 5%).
Building on our prior work [8], we assessed whether amyloid and total tau status could inform PHS-predicted annualized incidence rate of AD dementia age of onset. We examined the influence of amyloid status, total tau status, and both in combination on the PHS-derived annualized incidence rate of AD dementia age of onset, based on previously established AD dementia incidence estimates from the United States population [4].
Finally, we evaluated the relationship between PHS and neuropathology (specifically, amyloid beta protein and tau-associated neuronal neurofibrillary tangles identified through molecularly specific immunohistochemistry and quantified by image analysis) in the community-based ROSMAP cohort using linear models, controlling for age at death and sex. Amyloid and tangle measures are mean of the square-root of the percentage area occupied by amyloid or tangles in eight brain regions, namely hippocampus, entorhinal cortex, midfrontal cortex, inferior temporal cortex, angular gyrus, calcarine cortex, anterior cingulate cortex, and superior frontal cortex [1, 2]. We also assessed this relationship in APOE ε4 noncarriers. All statistical analyses were conducted using R version 3.4.2. See Fig. 1 for a flowchart delineating the hypotheses tested in the ADNI and ROSMAP cohorts.
Fig. 1.
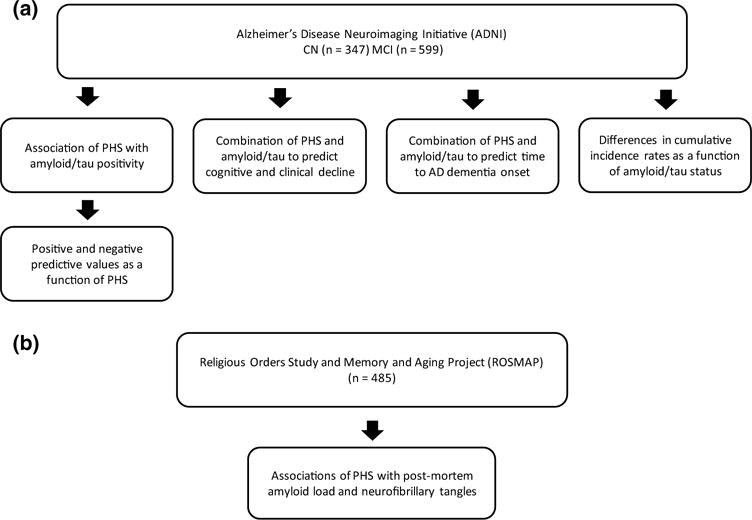
Flowchart delineating the hypotheses tested in the a Alzheimer’s disease neuroimaging initiative (ADNI) cohort and b religious orders study and memory and aging project (ROSMAP) cohort
Results
PHS enriches AD-predictive value of amyloid and tau deposition
Within the combined MCI and CN cohort, we found that PHS predicted amyloid (odds ratio (OR) = 1.90, 95% confidence interval (CI) = 1.40–2.60, p = 5.50 × 10⁻⁵) and total tau (OR = 1.62, 95% CI = 1.23–2.14, p = 6.53 × 10⁻⁴) positivity (See Supplemental Figure 1 showing the distributions of PHS with biomarkers for all MCI and CN individuals). We replicated these results in ADNI1/GO and ADNI2 cohorts separately (Supplemental Results). As illustrated in Fig. 2, we found that the proportion of individuals who were amyloid or total tau positive increased systematically as a function of higher PHS. For example, approximately 60% of individuals in the 75th PHS percentile would be classified as amyloid positive whereas less than 40% of individuals in the 25th PHS percentile would be amyloid positive. In subgroup analyses involving only CN individuals, PHS predicted amyloid (OR = 1.66, 95% CI = 1.08–4.59, p = 2.61 × 10⁻²) but not total tau (OR = 1.31, 95% CI = 0.80–2.16, p = 0·28) positivity (See Supplemental Figure 2 showing the distributions of PHS with biomarkers, and PHS with age for CN individuals who did not progress to AD dementia). Within MCI individuals only, PHS predicted amyloid (OR = 1.71, 95% CI = 1.13–2.60, p = 1.15 × 10⁻²) and total tau (OR = 1.47, 95% CI = 1.06–2.06, p = 2.23 × 10⁻²) positivity.
Fig. 2.
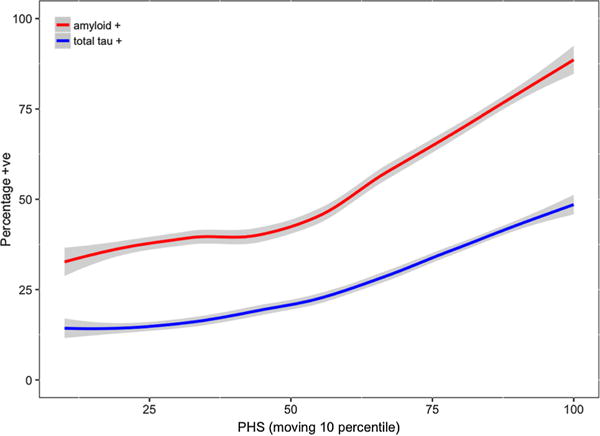
Increase in the proportion of nondemented individuals who tested positive on amyloid (red) and total tau (blue) as a function of higher polygenic hazard score (PHS) (moving 10 percentiles, 1% increment per step)
Similarly, within the combined MCI and CN cohort, we found that PPV of amyloid and total tau increased systematically as a function of higher PHS percentiles (Fig. 3a). For instance, the PPV for amyloid positivity approaches 100% amongst individuals with ≥ 50th percentile PHS but for individuals in ≤ 25th percentile PHS, amyloid PPV is approximately 75%. Results were similar in ADNI1/GO and ADNI2 cohorts separately (Supplemental Figure 3) Based on a 1000 bootstrap of 50 random samples, PPV for all individuals was higher for amyloid compared to total tau (Welch t test, t (1344.5) = 119.92, p < 2×10⁻¹⁶). In contrast, we found that NPV was highest in individuals with low PHS percentiles, especially for total tau (Fig. 3b). For amyloid and total tau, we note that the maximum absolute value PPV (approximately 98%) as a function of PHS was higher than the maximum absolute NPV (approximately 85%) as a function of PHS.
Fig. 3.
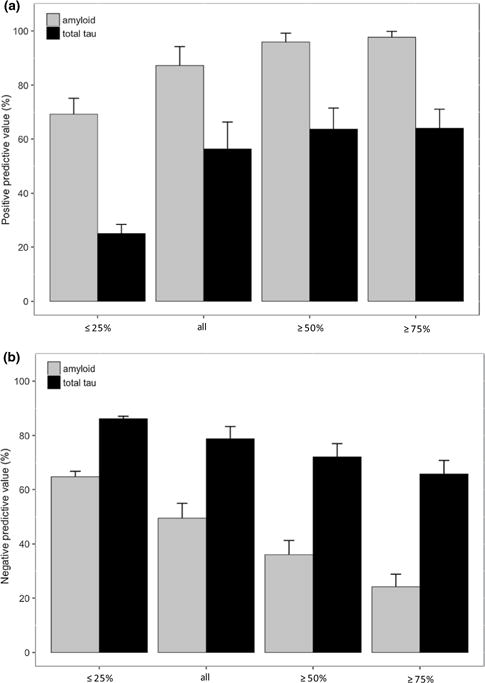
a Positive predictive value (PPV) and b negative predictive value (NPV) of amyloid and total tau with subsequent progression to AD dementia, based on stratification of polygenic hazard score (PHS) into different percentile bins (≤ 25%, all individuals, ≥ 50% and ≥ 75%). Error bars are 1000 bootstrap estimate of the standard deviation of 100 random samples in each PHS percentile bins
PHS enriches amyloid and tauassociated prediction of clinical and cognitive decline
Using LME analyses within the combined MCI and CN cohort, we investigated the role of PHS in conjunction with amyloid and total tau positivity in predicting cognitive decline (executive function and memory) and clinical progression (i.e., increase in CDR-SB), and found that the three-way interactions (PHS × biomarker_status × Δt) were statistically significant for amyloid in executive function (β = − 0.14, SE = 0.02, p = 1.07 × 10⁻¹³), memory (β = − 0.05, SE = 0.02, p = 1.89 × 10⁻³), CDR-SB: β = 0.56, SE = 0.06, p < 2 × 10⁻¹⁶), and for total tau in executive function (β = − 0.10, SE = 0.02, p = 1.43 × 10⁻⁹), memory (β = − 0.05, SE = 0.02, p = 1.25 × 10⁻³), and CDR-SB (β = 0.40, SE = 0.06, p = 2.46 × 10⁻¹²). We conducted simple slope analyses and found that individuals who had high PHS (~ 84 percentile) and tested positive for amyloid experienced the fastest rate of cognitive decline (executive function and memory) and clinical progression (CDR-SB) (Supplemental Table 1). Similarly, individuals with high PHS and positive for total tau also experienced the fastest rate cognitive and clinical decline (Supplemental Table 1, Supplemental Figure 4). Results were similar in ADNI1/GO and ADNI2 cohorts separately, especially for CDR-SB (Supplemental Results). In APOE ε4 noncarriers, we also find similar results in combined MCI and CN cohorts, and in MCI individuals alone (Supplemental Results).
In addition, using likelihood ratio tests, we found that these full LME models resulted in a better fit than a reduced, non-PHS model with only amyloid status (executive function: χ2(4) = 76.2, p = 1.10 × 10⁻¹⁵; memory: χ2(4) = 34.3, p = 6.47 × 10⁻⁷; CDR-SB: χ2(4) = 143.51, p < 2.20 × 10⁻¹⁶) or total tau status (executive function: χ2(4) = 56.2, p = 1.79 × 10⁻¹¹; memory: χ2(4) = 42.1, p = 1.56 × 10⁻⁸; CDR-SB: χ2(4) = 112.93, p < 2 × 10⁻¹⁶). Specifically, amyloid or total tau positive individuals with high PHS showed greater cognitive decline and faster clinical progression than individuals who were amyloid or total tau positive, irrespective of PHS (Fig. 4). These findings demonstrate that PHS can identify biomarker-positive individuals who experience the steepest rates of cognitive decline and clinical progression.
Fig. 4.
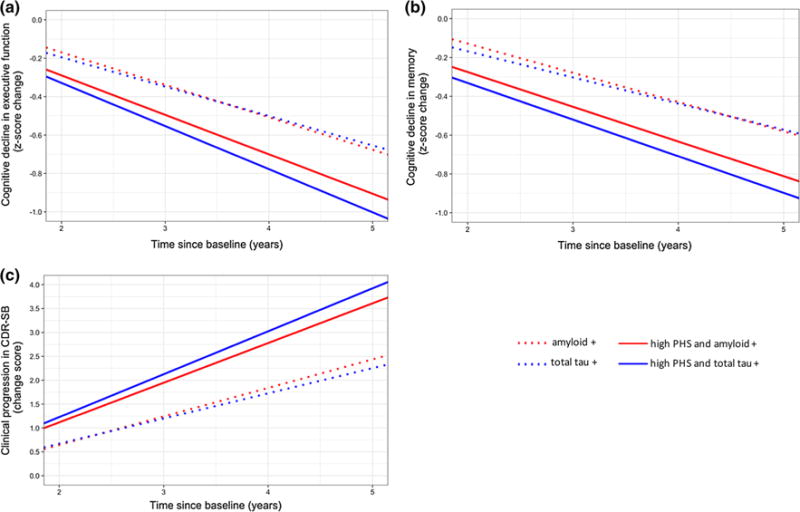
Differences in rates of cognitive decline in a executive function, b memory, and clinical progression in c cognitive dementia rating sum of boxes (CDR-SB) over time for high polygenic hazard score (PHS) individuals who tested positive for amyloid (solid red line) or total tau (solid blue line) in full PHS linear mixed-effects (LME) models, compared to individuals who tested positive for amyloid (dotted red line) or total tau (dotted blue line) in reduced non-PHS LME models (see text for model details)
In subgroup analyses, we found similar results within the CN and MCI cohorts (Supplemental Results).
Combination of PHS with amyloid and tau biomarkers improves prediction of time to AD dementia progression
Among CN and MCI individuals, we found that PHS predicted time to progression (Hazard ratio (HR) = 1.80, 95% CI = 1.35–2.40, p = 5.66 × 10⁻⁵). PHS continued to predict time to progression after including amyloid status (HR = 1.54, 95% CI = 1.16–2.06, p = 3.27 × 10⁻³), and after including both amyloid and total tau status (HR = 1.49, 95% CI = 1.11–1.99, p = 7.48 × 10⁻³) (Fig. 5). Comparing goodness of fit using likelihood ratio tests, we found that the reduced models involving only PHS (and covariates) were improved when including amyloid status (χ2(1) = 57.1, p = 4.05 × 10⁻¹⁴), and both amyloid status and total tau status in conjunction (χ2(2) = 84.7, p < 2 × 10⁻¹⁶). The combined model which included PHS, amyloid and total tau status showed the best fit and best predicted time to AD dementia progression than just amyloid and total tau status (χ2(1) = 6.96, p = 8.29 × 10⁻³).
Fig. 5.
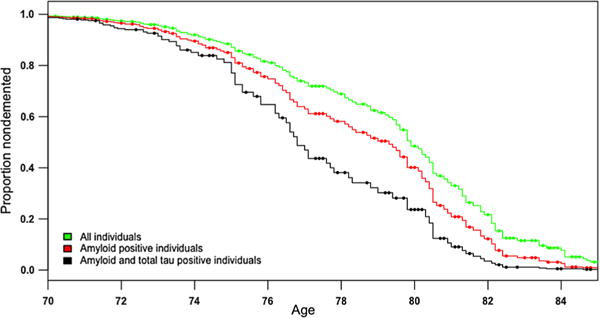
Survivor plot showing greater progression to AD dementia as a function of polygenic hazard score (PHS) for all individuals (green), individuals who were amyloid positive (red) and individuals who were both amyloid and total tau positive (black)
Amyloid + tau positive individuals show highest PHS-derived annualized AD incidence rates
We generated population baseline-corrected survival curves stratified by amyloid and total tau positivity status and converted them into incidence rates based on PHS [8]. This measure of cumulative incidence rate (CIR) based on age and PHS provides the annualized risk of a nondemented individual for progressing to AD dementia. As illustrated in Fig. 6, we found that amyloid and total tau positive individuals showed the highest CIRs compared to other groups, particularly at later ages (over 80). An individual who tested negative for amyloid at baseline would have a CIR of 0.025 at age 70 and 0.37 at age 90. In contrast, an individual who tested positive for both amyloid and total tau at baseline would have a higher CIR of 0.075 at age 70, and 0.73 at age 90. In subgroup analyses, we found similar results within the CN and MCI cohorts (Supplemental Figure 5).
Fig. 6.
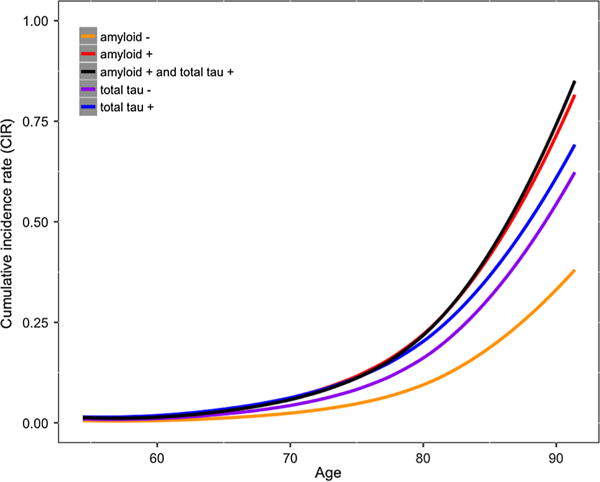
Annualized cumulative incidence rates depicting instantaneous hazard based on an individual’s age and polygenic hazard score (PHS), stratified based on individuals who were amyloid positive (red), amyloid negative (orange), total tau positive (blue), total tau negative (purple), and both amyloid and total tau positive (black)
PHS is associated with amyloid and tangles
Finally, in the ROSMAP cohort, we found that higher PHS was associated with higher post-mortem amyloid load (β = 0.35, SE = 0.05, p = 3.05 × 10⁻¹²) and tangles (β = 0.45, SE = 0.06, p = 2.84 × 10⁻¹⁴). In APOE, ε4 noncarriers, higher PHS was similarly associated with higher amyloid load (β = 0.31, SE = 0.10, p = 1.63 × 10⁻³) and tangles (β = 0.30, SE = 0.09, p = 1.17 × 10⁻³). See Supplemental Figure 6 showing the distributions of PHS with amyloid and tangles for all individuals in the ROSMAP cohort.
Discussion
In this study, we show that the predictive value of AD biomarkers of amyloidopathy and tauopathy increases systematically as a function of PHS among individuals without clinical dementia; for MCI and CN individuals in greater than the 50th percentile PHS, the positive predictive value for amyloid approached 100%. Even after controlling for APOE ε4, we found that PHS identified biomarker-positive nondemented older individuals at highest risk for AD dementia progression and longitudinal cognitive decline. Crucially, the combination of PHS, amyloid and total tau best predicted time to AD dementia progression and cognitive decline further indicating the value of stratifying by PHS, beyond amyloid or total tau alone. Furthermore, we found that amyloid and total tau positive individuals with high PHS will likely experience the highest annualized AD dementia incidence rates. In the community-based ROSMAP cohort, we found that higher PHS was associated with higher amyloid load and neuronal neurofibrillary tangles, even in APOE ε4 noncarriers. Collectively, our findings indicate that among nondemented older individuals, PHS can serve as an ‘enrichment’ marker for the presence of amyloid and tau deposition that is predictive of future progression to clinical dementia.
From a clinical trial perspective, PHS may be useful in AD secondary prevention and therapeutic trials. Building on prior work [6, 28], our PPV results indicate that PHS can be used to enrich clinical trial cohorts by identifying those nondemented individuals with amyloid or tau pathology who are at highest risk of progressing to AD dementia. Given that, progression to AD dementia among biomarker-positive nondemented individuals is slow, especially among clinically normal populations [21], enriching for individuals at greatest risk of decline may improve the statistical power to detect treatment effects in prevention trials. As PHS strongly predicted both amyloid and total tau positivity, PHS may also serve as an initial screening tool for in vivo AD pathology; for cohort enrichment in trials, it may be helpful to pursue a stratified approach [7, 19] where costlier secondary assessments using CSF or PET biomarker assays are obtained only in those individuals with a high PHS. We note that the PPV was higher for amyloid compared to total tau indicating that PHS provides more enrichment in amyloid compared to tau pathology. However, this may in part be due to the disease stage examined in our analyses. Given that extensive tau deposition occurs in closer proximity to clinical symptoms [20], we may have had limited power in detecting associations with tau given our focus on nondemented individuals. In contrast, we found that NPV was highest in individuals with low PHS percentiles, especially for total tau, indicating that individuals who tested negative for total tau and had low PHS were very unlikely to progress to AD dementia subsequently.
From a clinical perspective, PHS likely represents a measurement of risk for AD dementia progression that is similar conceptually to other AD-associated risk factors that can influence an individual’s age-specific annualized incidence rate. Thus, PHS may be useful for risk stratification of nondemented older individuals. In our linear mixed effects and survival analyses, we found that PHS considerably improved the ability of amyloid and total tau to predict time to AD dementia progression and longitudinal cognitive decline. Importantly, the combination of PHS, amyloid and total tau best predicted clinical and cognitive decline. Together, these findings highlight that a PHS-stratified approach may be clinically useful. Rather than evaluating all individuals, amyloid and tau assessments may be most helpful only in those individuals with a high PHS. Conversely, among individuals with a low PHS, it may be less effective to pursue additional evaluation with amyloid biomarkers.
Building on prior work evaluating polygenic risk in preclinical AD [12, 18, 22] our findings indicate that PHS may be useful for predicting clinical and cognitive decline among asymptomatic older individuals. Among CNs, we found that significant interactions between PHS and amyloid or total tau predicted longitudinal change in CDR-SB. The general lack of a significant three-way interaction between PHS and amyloid/tau in predicting longitudinal change in executive function and memory in CNs may reflect the challenges involved in finding cognitive effects that may be suppressed by practice effects in serial cognitive testing for preclinical AD [11]. Furthermore, PHS predicted amyloid positivity even in CN individuals. Together, these results indicate that the utility of using PHS for cohort enrichment and screening may extend into preclinical AD. In other words, PHS can identify cognitively asymptomatic individuals who are more likely to show AD pathology and who may be at greatest risk for short-term clinical progression.
Across multiple lines of evidence, our results demonstrate that PHS provides independent information beyond AD pathological status. These results suggest that mechanistically, PHS may, in part, be capturing influence from other AD pathological pathways beyond amyloid and tau, a reflection of the complexity underlying AD pathogenesis involving neuroinflammation and immune regulation [3, 26], neurovascular [30], mitogenic and oxidative stress signaling pathways [29]. Alternatively, our findings may reflect that risk factors for pathology are not equivalent to pathology. That is, although strongly predictive of, PHS may not be a surrogate for amyloid or tau pathology.
Within both the biomarker (ADNI) and autopsy (ROS-MAP) datasets, although high PHS was predominantly associated with elevated pathology, we found individuals with low CSF/PET or post-mortem amyloid and tau, despite having high PHS (Supplemental Figures 1 and 6). These individuals highlight that genetic markers are not synonymous with pathologic markers, and suggest that non-genetic factors likely play an important role in modulating Alzheimer’s neurodegeneration. Further, elucidating these lifestyle or environmental factors in individuals with elevated genetic risk may offer valuable insights into preventing and treating AD.
In conclusion, we show the utility of integrating PHS with in vivo biomarkers of amyloid and tau pathology for cohort enrichment in clinical trials and risk stratification for MCI and preclinical AD. Even after accounting for APOE ε4 effects, our findings indicate that stratification by PHS considerably ‘boosts’ the predictive value of amyloid. Among nondemented older individuals of European ancestry, the combination of both PHS and biomarker status best predicts cognitive and clinical decline. Future work should evaluate the value of PHS as an AD-associated risk stratification and cohort enrichment marker in diverse, non-Caucasian, non-European populations.
Supplementary Material
Acknowledgments
We thank the Shiley-Marcos Alzheimer’s Disease Research Center at UCSD, UCSF Memory and Aging Center and UCSF Center for Precision Neuroimaging for continued support. This work was supported by the Radiological Society of North America Resident/Fellow Award, American Society of Neuroradiology Foundation Alzheimer’s Disease Imaging Award, National Alzheimer’s Coordinating Center Junior Investigator award, National Institutes of Health Grants (NIH-AG046374, K01AG049152, P20AG10161, R01AG15819, R01AG17917), the Research Council of Norway (#213837, #225989, #223273, #237250/European Union Joint Programme–Neurodegenerative Disease Research), the South East Norway Health Authority (2013–123), Norwegian Health Association, the Kristian Gerhard Jebsen Foundation. Please see Supplemental Acknowledgements for Alzheimer’s Disease Neuroimaging Initiative, National Institute on Aging Genetics of Alzheimer’s Disease Data Storage Site and Alzheimer’s Disease Genetics Consortium funding sources.
Footnotes
Data used in preparation of this article were obtained from the Alzheimer’s Disease Neuroimaging Initiative (ADNI) database (adni.loni.usc.edu). As such, the investigators within the ADNI contributed to the design and implementation of ADNI and/or provided data but did not participate in analysis or writing of this report. A complete listing of ADNI investigators can be found at: http://adni.loni.usc.edu/wpcontent/uploads/how_to_apply/ADNI_Acknowledgement_List.pdf
Electronic supplementary material The online version of this article (https://doi.org/10.1007/s00401-017-1789-4) contains supplementary material, which is available to authorized users.
Compliance with ethical standards
Conflict of interest JBB served on advisory boards for Elan, Bristol-Myers Squibb, Avanir, Novartis, Genentech, and Eli Lilly and holds stock options in CorTechs Labs, Inc. and Human Longevity, Inc. AMD is a founder of and holds equity in CorTechs Labs, Inc., and serves on its Scientific Advisory Board. He is also a member of the Scientific Advisory Board of Human Longevity, Inc. (HLI), and receives research funding from General Electric Healthcare (GEHC). The terms of these arrangements have been reviewed and approved by the University of California, San Diego in accordance with its conflict of interest policies.
References
- 1.Bennett DA, Schneider JA, Arvanitakis Z, Wilson RS. Overview and findings from the religious orders study. Curr Alzheimer Res. 2012;9:628–645. doi: 10.2174/156720512801322573. [DOI] [PMC free article] [PubMed] [Google Scholar]
- 2.Bennett DA, Schneider JA, Buchman AS, et al. Overview and findings from the rush memory and aging project. Curr Alzheimer Res. 2012;9:646–663. doi: 10.2174/156720512801322663. [DOI] [PMC free article] [PubMed] [Google Scholar]
- 3.Bonham LW, Desikan RS, Yokoyama JS. The relationship between complement factor C3, APOE e4, amyloid and tau in Alzheimer’s disease. Acta Neuropathol Commun. 2016;4:65. doi: 10.1186/s40478-016-0339-y. https://doi.org/10.1186/s40478-016-0339-y. [DOI] [PMC free article] [PubMed] [Google Scholar]
- 4.Brookmeyer R, Gray S, Kawas C. Projections of alzheimer’s disease in the United States and the public health impact of delaying disease onset. Am J Public Health. 1998;88:1337–1342. doi: 10.2105/ajph.88.9.1337. [DOI] [PMC free article] [PubMed] [Google Scholar]
- 5.Cohen J, Cohen P, West SG, Aiken LS. Applied multiple regression/correlation analysis for the behavioral sciences. 3rd. Erlbaum; Hillsdale: 2003. [Google Scholar]
- 6.Darst BF, Koscik RL, Racine AM, et al. Pathway-specific polygenic risk scores as predictors of amyloid-β deposition and cognitive function in a sample at increased risk for Alzheimer’s disease. J Alzheimers Dis. 2017;55:473–484. doi: 10.3233/JAD-160195. https://doi.org/10.3233/JAD-160195. [DOI] [PMC free article] [PubMed] [Google Scholar]
- 7.Desikan RS, Rafii MS, Brewer JB, et al. An expanded role for neuroimaging in the evaluation of memory impairment. Am J Neuroradiol. 2013;34:2075–2082. doi: 10.3174/ajnr.A3644. https://doi.org/10.3174/ajnr.A3644. [DOI] [PMC free article] [PubMed] [Google Scholar]
- 8.Desikan RS, Fan CC, Wang Y, et al. Personalized genetic assessment of age-associated Alzheimer’s disease risk. PLoS Med. 2017;14:e1002258. doi: 10.1371/journal.pmed.1002258. https://doi.org/10.1371/journal.pmed.1002258. [DOI] [PMC free article] [PubMed] [Google Scholar]
- 9.Fagan AM, Mintun MA, Mach RH, et al. Inverse relation between in vivo amyloid imaging load and cerebrospinal fluid Abeta42 in humans. Ann Neurol. 2006;59:512–519. doi: 10.1002/ana.20730. https://doi.org/10.1002/ana.20730. [DOI] [PubMed] [Google Scholar]
- 10.Gibbons LE, Carle AC, Mackin RS, et al. A composite score for executive functioning, validated in Alzheimer’s disease neuroimaging initiative (ADNI) participants with baseline mild cognitive impairment. Brain Imaging Behav. 2012;6:517–527. doi: 10.1007/s11682-012-9176-1. https://doi.org/10.1007/s11682-012-9176-1. [DOI] [PMC free article] [PubMed] [Google Scholar]
- 11.Goldberg TE, Harvey PD, Wesnes KA, et al. Practice effects due to serial cognitive assessment: implications for preclinical Alzheimer’s disease randomized controlled trials. Alzheimers Dement (Amst) 2015;1:103–111. doi: 10.1016/j.dadm.2014.11.003. https://doi.org/10.1016/j.dadm.2014.11.003. [DOI] [PMC free article] [PubMed] [Google Scholar]
- 12.Harrisson TM, Mahmood Z, Lau EP, et al. An Alzheimer’s disease genetic risk score predicts longitudinal thinning of hippocampal complex subregions in healthy older adults. eNeuro. 2016 doi: 10.1523/ENEURO.0098-16.2016. https://doi.org/10.1523/eneuro.0098-16.2016. [DOI] [PMC free article] [PubMed]
- 13.Jack CR, Knopman DS, Jagust WJ, et al. Hypothetical model of dynamic biomarkers of the Alzheimer’s pathological cascade. Lancet Neurol. 2010;9:119–128. doi: 10.1016/S1474-4422(09)70299-6. https://doi.org/10.1007/s12035-011-8228-7. [DOI] [PMC free article] [PubMed] [Google Scholar]
- 14.Jansen WJ, Ossenkoppele Rik, Knol DL, et al. Prevalence of cerebral amyloid pathology in persons without dementia. JAMA. 2015;313:1924–1938. doi: 10.1001/jama.2015.4668. https://doi.org/10.1001/jama.2015.4668. [DOI] [PMC free article] [PubMed] [Google Scholar]
- 15.Karch CM, Goate AM. Alzheimer’s disease risk genes and mechanisms of disease pathogenesis. Biol Psychiatry. 2015;77:43–51. doi: 10.1016/j.biopsych.2014.05.006. https://doi.org/10.1016/j.biopsych.2014.05.006. [DOI] [PMC free article] [PubMed] [Google Scholar]
- 16.Lambert JC, Ibrahim-Verbaas CA, Harold D, et al. Meta-analysis of 74,046 individuals identifies 11 new susceptibility loci for Alzheimer’s disease. Nat Genet. 2013;45:1452–1458. doi: 10.1038/ng.2802. https://doi.org/10.1038/ng.2802. [DOI] [PMC free article] [PubMed] [Google Scholar]
- 17.Landau SM, Mintun MA, Joshi AD, et al. Amyloid deposition, hypometabolism, and longitudinal cognitive decline. Ann Neurol. 2012;72:578–586. doi: 10.1002/ana.23650. https://doi.org/10.1002/ana.23650. [DOI] [PMC free article] [PubMed] [Google Scholar]
- 18.Marion RE, Campbell A, Hagenaars SP, et al. Genetic stratification to identify risk groups for Alzheimer’s disease. J Alzheimers Dis. 2017;57:275–283. doi: 10.3233/JAD-161070. https://doi.org/10.3233/JAD-161070. [DOI] [PMC free article] [PubMed] [Google Scholar]
- 19.McEvoy LK, Brewer JB. Biomarkers for the clinical evaluation of the cognitively impaired elderly: amyloid is not enough. Imaging Med. 2012;4:343–357. doi: 10.2217/iim.12.27. https://doi.org/10.2217/iim.12.27. [DOI] [PMC free article] [PubMed] [Google Scholar]
- 20.Nelcon PT, Braak H, Markesbery WR. Neuropathlogy and cognitive impairment in Alzheimer disease: a complex but coherent relationship. J Neuropathol Exp Neurol. 2009;68:1–14. doi: 10.1097/NEN.0b013e3181919a48. https://doi.org/10.1097/NEN.0b013e3181919a48. [DOI] [PMC free article] [PubMed] [Google Scholar]
- 21.Roe CM, Fagan AM, Grant EA, et al. Amyloid imaging and CSF biomarkers in predicting impairment u to 7.5 years later. Neurology. 2013;80:1784–1791. doi: 10.1212/WNL.0b013e3182918ca6. https://doi.org/10.1212/WNL.0b013e3182918ca6. [DOI] [PMC free article] [PubMed] [Google Scholar]
- 22.Sabuncu MR, Buckner RL, Smoller JW, et al. The association between a polygenic Alzheimer score and cortical thickness in clinically normal subjects. Cereb Cortex. 2012;22:2653–2661. doi: 10.1093/cercor/bhr348. https://doi.org/10.1093/cercor/bhr348. [DOI] [PMC free article] [PubMed] [Google Scholar]
- 23.Shaw LM, Vanderstichele H, Knapik-Czajka M, et al. Cerebrospinal fluid biomarker signature in Alzheimer’s disease neuroimaging initiative subjects. Ann Neurol. 2009;65:403–413. doi: 10.1002/ana.21610. https://doi.org/10.1002/ana.21610. [DOI] [PMC free article] [PubMed] [Google Scholar]
- 24.Shulman JM, Chen K, Keenan BT, et al. Genetic susceptibility for Alzheimer disease neuritic plaque pathology. JAMA Neurol. 2003;70:1150–1157. doi: 10.1001/jamaneurol.2013.2815. [DOI] [PMC free article] [PubMed] [Google Scholar]
- 25.Sperling RA, Aisen PS, Beckett LA, et al. Toward defining the preclinical stages of Alzheimer’s disease: recommendations from the National Institute on Aging-Alzheimer’s Association workgroups on diagnostic guidelines for Alzheimer’s disease. Alzheimers Dement. 2011;7:280–292. doi: 10.1016/j.jalz.2011.03.003. https://doi.org/10.1016/j.jalz.2011.03.003. [DOI] [PMC free article] [PubMed] [Google Scholar]
- 26.Steele NZ, Carr JS, Bonham LW, et al. Fine-mapping of the human leukocyte antigen locus as a risk factor for Alzheimer’s disease: a case–control study. PLoS Med. 2017;14:e1002272. doi: 10.1371/journal.pmed.1002272. https://doi.org/10.1371/journal.pmed.1002272. [DOI] [PMC free article] [PubMed] [Google Scholar]
- 27.Tan CH, Hyman BT, Tan JJX, et al. Polygenic hazard score in preclinical Alzheimer’s disease. Ann Neurol. 2017;82:484–488. doi: 10.1002/ana.25029. https://doi.org/10.1002/ana.25029. [DOI] [PMC free article] [PubMed] [Google Scholar]
- 28.Voyle N, Patel H, Folarin A, et al. Genetic risk as a marker of amyloid-β and tau burden in cerebrospinal fluid. J Alzheimers Dis. 2017;55:1417–1427. doi: 10.3233/JAD-160707. https://doi.org/10.3233/JAD-160707. [DOI] [PMC free article] [PubMed] [Google Scholar]
- 29.Zhu X, Lee HG, Perry G, Smith MA. Alzheimer disease, the two-hit hypothesis: an update. Biochim Biophys Acta. 2007;1772:494–502. doi: 10.1016/j.bbadis.2006.10.014. [DOI] [PubMed] [Google Scholar]
- 30.Zlokovic B. Neurovascular pathways to neurodegeneration in Alzheimer’s disease and other disorders. Nat Rev Neurosci. 2011;12:723–738. doi: 10.1038/nrn3114. https://doi.org/10.1038/nrn3114. [DOI] [PMC free article] [PubMed] [Google Scholar]
Associated Data
This section collects any data citations, data availability statements, or supplementary materials included in this article.


