Abstract
Tea-ginger drink was selected for evaluation due to its nutraceutical potential. Panelists rated preference for drinks prepared from tea, ginger, and tea+ginger powder for colour, taste, and aroma. The obtained data were evaluated using analysis of variance, principal component analysis, and agglomerative hierarchical clustering. Also the colour preference scores were evaluated against instrumental colour measurements. The ginger drink had lower rating for colour preference and the tea drink had lower ratings for aroma and taste preference. However, the tea-ginger drink led to enhanced colour, aroma, and taste ratings. The colour preference was found to have highest correlation coefficient with the hue and chroma of the drinks [r(58)=−0.583, P<0.05 and r(58)=0.566, P<0.05]. This study suggests that a sensory quality deficiency in a particular plant based drink could be compensated for by blending the drink with another plant based drink. This approach could help improve the uptake of plant based nutraceutical drinks.
Keywords: tea, ginger, nutraceutical, sensory perception
INTRODUCTION
Tea and ginger are plants with high antioxidant potential (1,2). Tea is the most popular functional beverage in the world and it has gained a lot of attention because of its health beneficial properties (3). Water extract of ginger has antioxidant activities towards low-density lipoprotein oxidation inhibition and therefore it is recommended for incorporation into the cardio-protective formulations (4). Ginger extract has been observed to reduce subjective arthritic knee pain measures; and decreased use of non-steroidal anti-inflammatory drugs and analgesics has been observed in study participants taking ginger extract (5).
Studies have suggested that the combination of vegetables, fruits and herbs can produce synergistic benefits. The additive and synergistic effects of phytochemicals in fruit and vegetables are responsible for their potent antioxidant and anticancer activities (6). Tapsell et al. (5) suggested that there are synergistic effects between nutrients that affect absorption. Extracts obtained from teaginger blends have also been reported to have synergistic antioxidant effect (1). Although people may encouraged to take nutraceutical drinks because of the health benefits, however, the intake of nutraceutical drinks can be enhanced if the sensory parameters are right. Thus, in this investigation we set out to produce a tea-ginger drink and compare its sensory perception with a tea drink and a ginger drink. The rationale behind this study was to determine if the drink produced from tea+ginger blend could produce an improved sensory perception compared to tea drink and ginger drink. Also the colour preference scores were evaluated against instrumental colour measurements.
MATERIALS AND METHODS
Tea and ginger powder preparation
The black tea and ginger powder were prepared as described by Makanjuola et al. (2). Tea leaves were obtained from Obudu Mountain in Cross River State and ginger rhizomes were obtained from Kaduna State, Nigeria.
Drink preparation
Aqueous extracts of tea, ginger and tea-ginger blend (2:1) were obtained under RSM multiresponse optimisation conditions (2,7). The ginger extract was obtained using extraction temperature, powder concentration, and time of 96°C, 2.10 g/100 mL, and 90 min, respectively. The tea-ginger extract was obtained using extraction temperature, powder concentration, and time of 96°C, 1.68 g/100 mL, and 90 min, respectively. The tea extract was obtained using extraction temperature, powder concentration, and time of 54°C, 2.10 g/100 mL, and 88 min, respectively. For each of the extractions, water was heated to the required extraction temperatures followed by the introduction of the powders into the heated water. The powders were subjected to constant stirring in the water. When the required extraction times were reached, the obtained extracts were filtered and the filtrates were cooled to room temperature.
Sugar was added to the drinks so that they fall in the yellow category of beverages sweetened with sugar (8). “Yellow categories of beverages are drinks having one gram of sugar per ounce or less. This is about 70 percent less sugar than a typical soft drink. If drunk in moderation, these slightly sweet drinks are much better choices than high-sugar drinks. There are relatively few drinks on the market that fall into this yellow category–and it is believed there’s a need for beverage manufacturers to offer more low-sugar options” (8).
Colour measurement
The colour (L*, a*, and b*) of the drinks was measured with a spectrophotometer CM-700d (Konica Minolta Sensing, Osaka, Japan) that was calibrated against a white plate. The hue and chroma of the drink was calculated as described in Makanjuola et al. (2).
Sensory evaluation
Twenty panelists who were familiar with tea and ginger were used for the evaluation. The drinks were assigned random numbers and presented to each of the participants. The drinks were refrigerated and served in transparent tubs and were then rated for colour, aroma, taste and overall acceptability. A 9-point scale was used; with 1=extremely dislike and 9=extremely like. Obtained data were subjected to ANOVA, principal component analysis (PCA) and agglomerative hierarchical clustering (AHC). For the AHC, distance between objects was calculated as Euclidean distance and clustering was done using Ward’s aggregation criterion. The sensory panel evaluation was approved by the ethical committee of the School of Agriculture and Agricultural Technology, Federal University of Technology, Akure, Nigeria (approval number: FUTA/SAAT/FST/46).
Statistical analysis
The response surface analysis was carried out using Design Expert v 7.0.0 (Stat-Ease, Inc., Minneapolis, MN, USA). The multivariate statistics (ordinary least squares regression, PC regression, partial least squares regression, and AHC) was done with XLSTAT Pro, 2013 (Addinsoft, Paris, France).
RESULTS
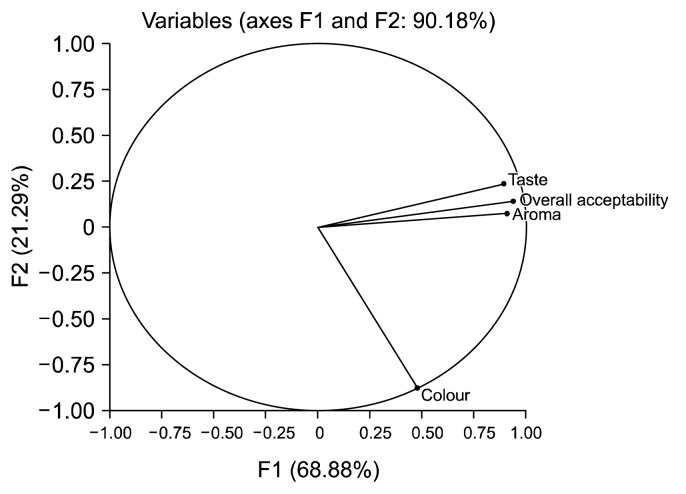
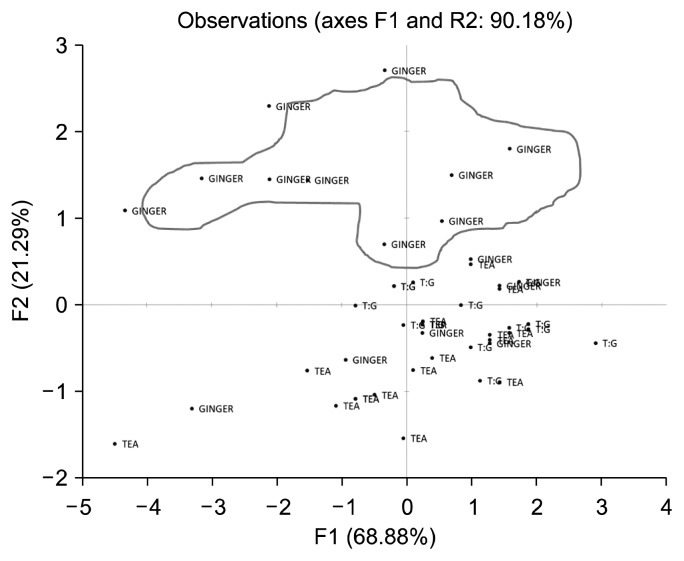
Tea and tea-ginger drink scored higher (P<0.05) in colour than the ginger drink (Table 1). Tea-ginger drink and ginger drink were rated higher (P<0.05) in term of aroma and taste than the tea. Although no significant difference was observed in the overall acceptability of the three drinks, the tea-ginger drink had a higher mean score of 7.05 when compared to the mean scores of 6.05 and 5.95 obtained for the tea and ginger drink, respectively. The PCA revealed that the taste, aroma and overall acceptability were highly correlated with the first principal component (PC); which explains about 69% of the variation in the rating of the drinks by the panelists (Fig. 1). The colour component of the drinks was well correlated with the second component. The PC plot showed that colour of the drinks was a major discriminating attribute. It can be seen that along the PC2, ginger drink was found to form a cluster (Fig. 2).
Table 1.
Mean scores for sensory properties of antioxidant drink
| Extract | Colour | Aroma | Taste | Overall acceptability |
|---|---|---|---|---|
| Ginger | 4.70b | 5.85ab | 5.80ab | 6.05a |
| Tea | 7.55a | 5.70b | 5.15b | 5.95a |
| Tea-Ginger (2:1) | 7.20a | 6.95a | 6.75a | 7.05a |
Mean values in the same column followed by the same letters (a,b) are not significantly different (P>0.05).
Fig. 1.
Correlation plot of drinks attribute based on principal component (PC)1 and PC2.
Fig. 2.
Principal component plot showing the sensory positioning of the drinks. T:G, tea:ginger.
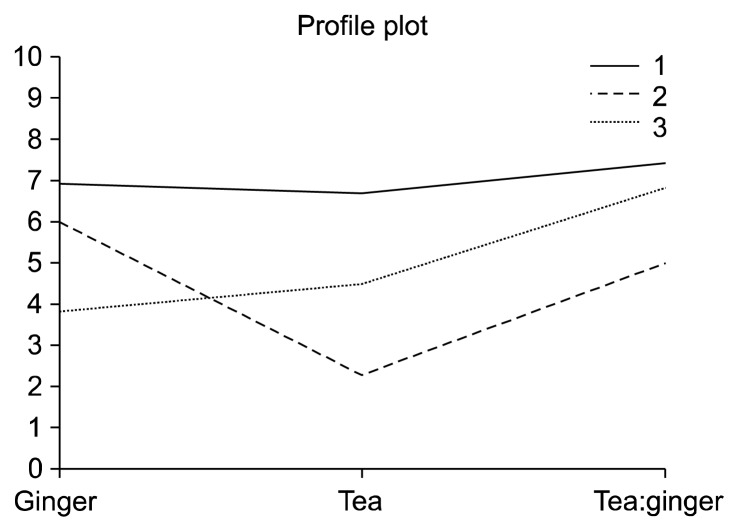
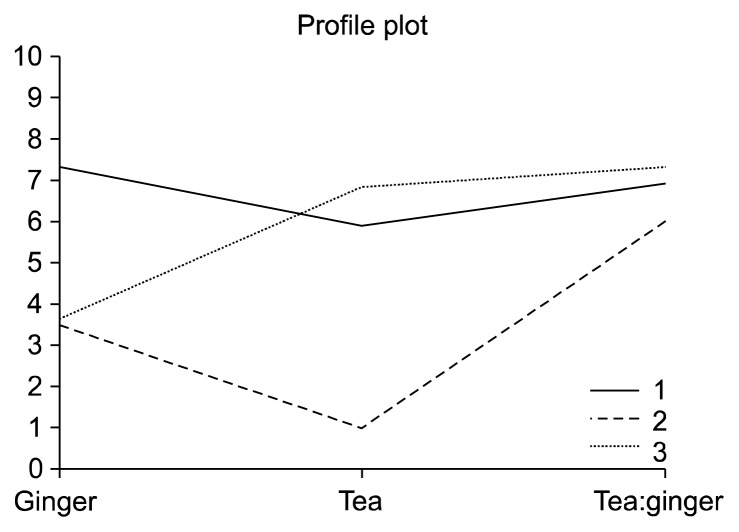
AHC is a useful multivariate technique for separating consumers into distinct groups (9). The AHC was also deployed in this study to gain better understanding of the panelists’ preferences. Three distinct groups of panelists were obtained from the taste preference. The first group had almost same level of preference for the three nutraceutical drinks (Fig. 3). This represents 50% of the total panelists. The second group, which represents only 20% of the total panelists had a higher preference for the taste of ginger, followed by tea-ginger; and least preference for tea. The third group had a higher preference for tea-ginger followed by tea; and had least preference for ginger taste. The group 1 panelists had the highest taste preference for tea, ginger, and tea-ginger compared to groups 2 and 3 (Fig. 3). The clustering revealed that the group 2 panelists are not lovers of tea taste and the group 3 panelists are not lovers of ginger taste, whereas the group 1 panelists had a good preference for the taste of ginger, tea, and tea-ginger.
Fig. 3.
Agglomerative hierarchical clustering of panelists for taste preference. Legends 1, 2, and 3 represent the mean taste profile for groups 1, 2, and 3, respectively.
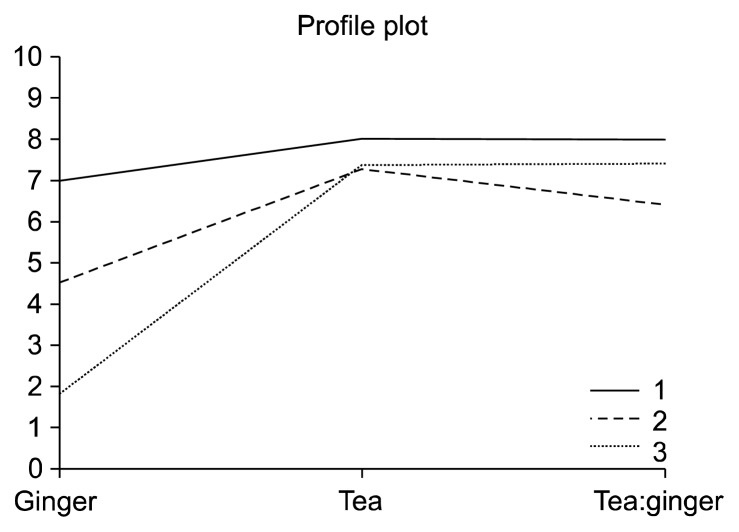
Three groups of panelists were also obtained from the colour preference rating (Fig. 4). The group 1 panelists for colour preference had similar rating for the colour of tea and tea-ginger and had a lower preference for the ginger colour. The group 2 panelists for colour preference had a higher preference for the colour of tea, followed by tea-ginger and had least preference for the ginger colour. Forty percent of the total panelists fall into this group. The group 3 panelists had similar preference for the colour of tea and tea-ginger extract and had lower preference for the colour of ginger. Twenty five percent of the total panelists fell into this third group (Fig. 4). The group 1 colour preference panelists (45% of the panelists) had the highest preference for colours of tea; teaginger and ginger colour when compared with the other colour groups (groups 2 and 3).
Fig. 4.
Agglomerative hierarchical clustering of panellists for colour preference. Legends 1, 2, and 3 represent the mean colour profile for groups 1, 2, and 3, respectively.
The correlation between the colour preference ratings by the panelists and the objective colour parameters (L, a, b, hue, and chroma) was also investigated. The colour preferences of the panelists were found to have highest correlation coefficient with the hue and chroma of the drinks [r(58)=−0.583, P<0.05 and r(58)=0.566, P< 0.05].
Three aroma preference groupings were also observed (Fig. 5). The group 1 panelists for aroma had a higher preference for ginger aroma, followed by tea-ginger aroma; with least preference for tea aroma. Sixty percent of the panelists belong to this first group. The group 2 panelists had preference for tea-ginger aroma, followed by ginger, and had the least preference for tea aroma. Only 10% of the total panelists belong to this group. The group 3 aroma preference panelists had higher preference for tea-ginger and tea aroma, and had the least preference for ginger aroma. The group 1 aroma preference panelists had the highest preference for the ginger drink aroma. The group 3 aroma preference panelists had the highest preference for the tea and tea-ginger aroma. The least preference for the aroma of the three drinks was from the group 3 aroma preference panelists (Fig. 5). The reason why the aroma and taste of these drinks were highly correlated to PCA1 in the PCA could be explained by the AHC results. It was observed from the AHC class results that seven of the panelists (out of ten panellists), who belonged to group 1 in the taste preference also belonged to the same group in the aroma preference class. However, only four of these panelists who belonged to group 1 in the taste preference also belonged to the same group in the colour preference class result.
Fig. 5.
Agglomerative hierarchical clustering of panelists for aroma preference. Legends 1, 2, and 3 represent the mean aroma profile for groups 1, 2, and 3, respectively.
DISCUSSION
The AHC analysis for the taste preference indicated that 80%, 70%, and 50% of the panelists had a liking (panelists with preference rating of ≤6) for the tea-ginger, ginger, and tea drink, respectively. The AHC analysis of the drink colour preference indicated that 100%, 100%, and 35% of the panelists, had a liking for tea-ginger, tea, and ginger drink, respectively. The AHC analysis of the drink aroma preference indicated that 100%, 90% and 60% of the panelists, had a liking for tea-ginger, tea and ginger drink, respectively. Adesokan et al. (10) reported that the sensory attributes of Hibiscus sabdariffa drink was enhanced by the use of ginger and garlic. Although the blending of plant from different sources could result in a drink with improved sensory perception, adequate care must be taken during the formulation to obtain a suitable blend that would not compromise sensory perception. Incorporation of ginger at 3% level into apple-blueberry-cranberry fruit blend was found to have a negative effect on the odour compared to the 1% and 2% ginger inclusion. However the 3% ginger inclusion had no negative effect to the taste of the juice blend (4). In this study we observed that the ginger drink colour was less preferred by a majority of the panelists compared to the colour of the tea and tea-ginger drink. This study points to the fact that a sensory quality deficiency in a particular vegetable drink could be compensated for by blending the drink with another vegetable drink. Thus, blending of drinks from different plant sources not only has synergistic benefits in terms of antioxidant activity but could also provide an advantage by enhancing sensory perception.
The colour of the ginger drink had the lowest acceptability while the taste and aroma of tea had the lowest acceptability. This study indicates that the acceptance of the aroma and taste of tea drink can be enhanced with the inclusion of ginger. The acceptability of the taste of tea drink and colour of ginger drink can be improved by blending tea and ginger powder to obtain a tea-ginger drink. Although no significant difference was observed in the overall acceptability of the aqueous extracts of tea, ginger, and tea-ginger powders, the tea-ginger drink had a higher score compared to the tea drink and ginger drink.
Footnotes
AUTHOR DISCLOSURE STATEMENT
The authors declare no conflict of interest.
REFERENCES
- 1.Makanjuola SA, Enujiugha VN, Omoba OS, Sanni DM. Combination of antioxidants from different sources could offer synergistic benefits: a case study of tea and ginger blend. Nat Prod Commun. 2015;10:1829–1832. [PubMed] [Google Scholar]
- 2.Makanjuola SA, Enujiugha VN, Omoba OS, Sanni DM. Optimization and prediction of antioxidant properties of a tea-ginger extract. Food Sci Nutr. 2015;3:443–452. doi: 10.1002/fsn3.237. [DOI] [PMC free article] [PubMed] [Google Scholar]
- 3.Pan MH, Lai CS, Wang H, Lo CY, Ho CT, Li S. Black tea in chemo-prevention of cancer and other human diseases. Food Sci Hum Wellness. 2013;2:12–21. doi: 10.1016/j.fshw.2013.03.004. [DOI] [Google Scholar]
- 4.Gunathilake KDPP, Rupasinghe HPV, Pitts NL. Formulation and characterization of a bioactive-enriched fruit beverage designed for cardio-protection. Food Res Int. 2013;52:535–541. doi: 10.1016/j.foodres.2013.02.051. [DOI] [Google Scholar]
- 5.Tapsell LC, Hemphill I, Cobiac L, Patch CS, Sullivan DR, Fenech M, Roodenrys S, Keogh JB, Clifton PM, Williams PG, Fazio VA, Inge KE. Health benefits of herbs and spices: the past, the present, the future. Med J Aust. 2006;185:S4–S24. doi: 10.5694/j.1326-5377.2006.tb00548.x. [DOI] [PubMed] [Google Scholar]
- 6.Liu RH. Health benefits of fruit and vegetables are from additive and synergistic combinations of phytochemicals. Am J Clin Nutr. 2003;78:517S–520S. doi: 10.1093/ajcn/78.3.517S. [DOI] [PubMed] [Google Scholar]
- 7.Makanjuola SA, Enujiugha VN, Omoba OS. Multiresponse optimization and prediction of antioxidant properties of aqueous ginger extract. Prev Nutr Food Sci. 2016;21:355–360. doi: 10.3746/pnf.2016.21.4.355. [DOI] [PMC free article] [PubMed] [Google Scholar]
- 8.Harvard School of Public Health. [accessed May 2014];The Nutrition Source: How Sweet Is It? http://www.hsph.harvard.edu/nutritionsource/how-sweet-is-it/
- 9.Makanjuola SA, Enujiugha VN. How consumers estimate the size and appeal of flexible packaging. Food Qual Preference. 2015;39:236–240. doi: 10.1016/j.foodqual.2014.07.020. [DOI] [Google Scholar]
- 10.Adesokan IA, Abiola OP, Adigun MO, Anifowose OA. Analysis of quality attributes of Hibiscus sabdariffa (zobo) drinks blended with aqueous extract of ginger and garlic. Afr J Food Sci. 2013;7:174–177. doi: 10.5897/AJFS12.152. [DOI] [Google Scholar]


