Abstract
Background:
Diabetes mellitus (DM) is inconsistently associated with the risk of low bone mass-related fractures (LBMF). This study aimed to summarize available cohort studies regarding the strength of association between type 2 diabetes mellitus (T2DM) and LBMF.
Methods:
Electronic searches of PubMed, Embase, and the Cochrane Library were performed to identify studies through April 2016. Cohort studies that reported effect estimates with 95% confidence intervals (CIs) of LBMF for T2DM and control comparison were included.
Results:
The summary relative risks (RRs) for T2DM versus non-T2DM were associated with a higher risk of LBMF (RR: 1.24; 95% CI: 1.09–1.41; P = .001). Further, women with T2DM showed a harmful impact on the incidence of LBMF (RR: 1.19; 95% CI: 1.04–1.36; P = .010). However, in men, T2DM showed no significant impact on the risk of LBMF (RR: 1.14; 95% CI: 0.93–1.39; P = .215). Furthermore, the summary results suggested an association between T2DM and LBMF in studies that reported hazard ratio (HR) as an effect estimate in total cohorts (HR: 1.31; 95% CI: 1.17–1.46; P < .001), men (HR: 1.26; 95% CI: 1.11–1.43; P < .001), and women (HR: 1.32; 95% CI: 1.16–1.50; P < .001). However, these significant associations were not observed in studies that reported RR/odds ratio as an effect estimate.
Conclusions:
The present meta-analysis confirmed that T2DM was associated with an increased prevalence of LBMF compared with non-T2DM.
Keywords: diabetes mellitus, fractures, low bone mass, meta-analysis
1. Introduction
The increasing epidemic of diabetes mellitus (DM) was associated with around 1.3 million deaths in 2008 globally, and an estimated 347 million people worldwide were affected.[1,2] The burden of DM, as a major cause of premature illness and death, is mostly attributed to cardiovascular diseases.[3–5] Type 1 DM (T1DM) is a known risk factor for reduced bone mineral density (BMD). The effect of type 1 DM on BMD depends on patients’ gender or age.[6] However, evidence supporting the effect of type 2 DM (T2DM) on subsequent low bone mass-related fractures (LBMF) is limited and inconclusive.
Several observational studies have indicated an association of DM with lower BMD or weak bone structure.[7–9] Increased urinary calcium excretion, leading to negative calcium balance, functional hypoparathyroidism, alterations in vitamin D metabolism, and insulin-like growth factors, is implicated in decreased BMD and associated risk of fractures.[7] Currently, several studies indicate an association of T2DM with an increased risk of LBMF.[10–16] Meanwhile, other studies showed no significant association between T2DM and the risk of LBMF.[17–20] The correlation between DM and LBMF according to sex, body mass index (BMI), and smoking status still remains controversial. This large-scale review of the available cohort studies was conducted to determine the association between T2DM and LBMF. Also, these associations were compared among participants with varying baseline characteristics.
2. Methods
2.1. Data sources, search strategy, and selection criteria
This review was conducted and reported according to the Preferred Reporting Items for Systematic Reviews and Meta-Analysis Statement issued in 2009 (Checklist S1).[21]
The ethical approval and written consent were not necessary for the meta-analysis because the data of meta-analysis was collected from the published literature.
Any cohort study that examined the relationship between T2DM and LBMF was eligible for inclusion in the present study. No restrictions were placed on language or publication status (published, in press, or in progress). PubMed, Embase, and Cochrane Library electronic databases were searched for articles published through April 2016. The following search terms were used: (“diabetes” or “diabetes mellitus” or “blood glucose level” or “blood sugar” or “Glycemic”) and (“low bone mass-related fractures” or “low bone mass” or “bone mass” or “bone fracture” or “skeletal fracture” or “osteoporotic fractures” or “osteoporotic” or “Osteoporosis” or “broken bone” or “bone density” or “low bone density-related fractures” or “microarchitectural deterioration”) and “clinical trials” and “human.” Also, reference lists from all the relevant original and review articles were manually searched to identify additional eligible studies. The medical subject headings, study design, methods, patient population, design, exposure, control, and outcome variables of these articles were used to identify the relevant studies.
The literature search was independently undertaken by 2 authors using a standardized approach. Any inconsistencies between the 2 authors were settled by the primary author until a consensus was reached. The study was eligible for inclusion if the following criteria were met: the study had to have a cohort design; the study investigated the association between T2DM and the risk of LBMF; and the authors should report effect estimates (relative risk [RRs], hazard ratio [HR], or odds ratio [OR]) and 95% confidence intervals (CIs) for comparisons of T2DM and control. All reviews, comments, letters to editor, or case reports were excluded because of the lack of available data. The exclusion criteria were as follows: studies enrolling only individuals with type 1 DM; absence of diabetes classification; absence of data related to incidence or risk of fracture; incomplete or missing data; absence of control group; cases diagnosed with post-transplant diabetes or diabetes followed by kidney or kidney–pancreas transplant; and intervention with osteoporotic medications or surgery.
2.2. Data collection and quality assessment
The data collected included the first author or study group name, publication year, country, study design, disease status, sample size, age at baseline, percentage of male patients, effect estimate and its 95% CI, reported endpoints, control, and covariates in the fully adjusted model. The effect estimate that was maximally adjusted for potential confounders was used for studies that reported several multivariable adjusted effect estimates.
The Newcastle–Ottawa Scale (NOS), which is quite comprehensive and partially validated to evaluate the quality of observational studies in meta-analyses, was used to test methodological quality.[22] The NOS is based on the following 3 subscales: selection (4 items), comparability (1 item), and outcome (3 items). A “star system” (range, 0–9) was developed for assessment. The data extraction and quality assessment were conducted independently by 2 authors. Information was reviewed and adjudicated independently by an additional author referring to the original studies.
2.3. Statistical analysis
The relationship between T2DM and the risk of LBMF was examined on the basis of effect estimate (OR, RR, or HR) and its 95% CI published in each study. HR was considered equivalent to RR in cohort studies. Further, given the low incidence of LBMF in patients with DM, the OR could be assumed to be an accurate estimate of RR. The random-effects model was used to calculate the summary RRs and the 95% CIs for the risk of LBMF in total cohorts, men, and women according to the effect estimate (RR/OR and HR).[23,24] Heterogeneity between studies was investigated using the Q statistic. P values < .10 were indicative of significant heterogeneity.[25,26] Subgroup analyses of LBMF were conducted based on country, smoking status, and adjusted or nonadjusted for BMI. P values for heterogeneity between subgroups were calculated using the chi-squared test and meta-regression analysis.[27] Also, a sensitivity analysis was performed by removing each individual study from the meta-analysis.[28] Several methods were used to check for potential publication bias. Visual inspections of funnel plots for low bone density-related fractures were conducted. Egger[29] and Begg tests[30] were also used to statistically assess the publication bias for LBMF. All the reported P values were 2 sided, and P values < .05 were considered statistically significant for all included studies. Statistical analyses were performed using the STATA software version 12.0 (Stata Corporation, College station, TX).
3. Results
The results of study selection are shown in Fig. 1. A total of 846 articles were identified in the initial electronic search, of which 797 duplicates and irrelevant studies were excluded. Finally, 49 potentially eligible studies were selected. After detailed evaluations, 11 cohort studies were selected for the final meta-analysis.[10–20] A manual search of the reference lists of these studies did not yield any new eligible studies. The general characteristics of the included studies are presented in Table 1.
Figure 1.
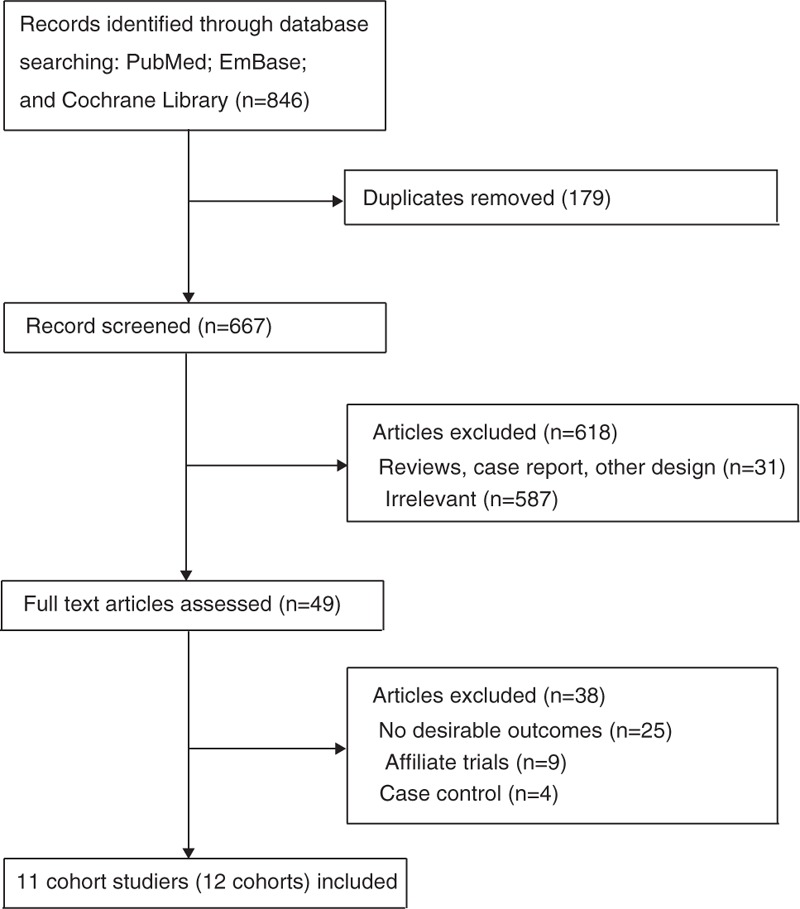
Study selection process.
Table 1.
Baseline characteristics of studies included in the systematic review and meta-analysis.
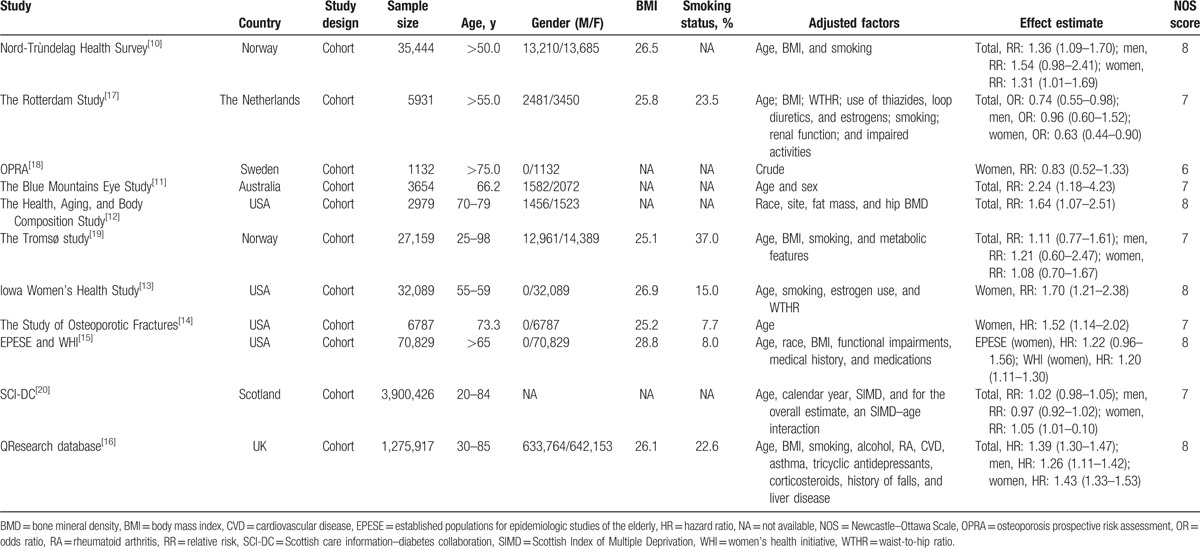
The number of participants ranged from 1132 to 3,900,426 in each study. Six studies were conducted in Europe,[10,16–20] 4 in the United States,[12–15] and 1 in Australia.[11] The quality of studies was assessed using the NOS. A study with a score ≥7 was considered as high quality. Overall, 5 studies scored 8,[10,12,13,15,16] 5 studies scored 7,[11,14,17,19,20] and the remaining 1 scored 6.[18]
All the included studies reported an association between T2DM and LBMF (Fig. 2). The summary RR showed that patients with T2DM manifested an increased risk of LBMF compared with non-DM participants (RR: 1.24; 95% CI: 1.09–1.41; P = .001), and significant heterogeneity was seen (I2 = 89.9%; P < .001). Furthermore, we noted that this significant difference was mainly in studies reporting HR as an effect estimate (HR: 1.31; 95% CI: 1.17–1.46; P < .001), while not detected in studies reporting RR/OR as an effect estimate (RR/OR: 1.19; 95% CI: 0.98–1.46; P = .085). As a result, a sensitivity analysis was conducted, and the conclusion was not affected by the sequential exclusion of any specific study that reported HR as an effect estimate, while the results were variable in studies that reported RR as an effect estimate (Table 2).
Figure 2.
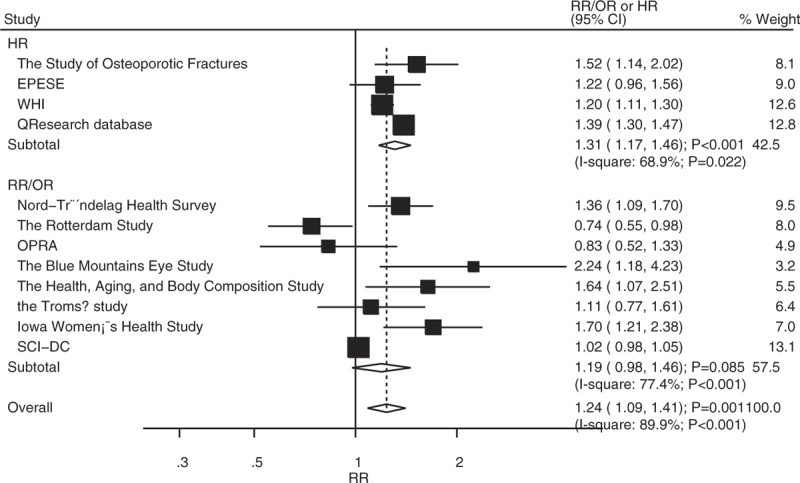
Association between diabetes mellitus and low bone mass-related fractures in total cohorts.
Table 2.
Sensitivity analysis for total cohorts.

A total of 5 studies reported an association between T2DM and LBMF in men. The summary RR indicated no significant difference between T2DM and non-T2DM for LBMF (RR: 1.14; 95% CI: 0.93–1.39; P = .215; Fig. 3), and substantial heterogeneity was detected across included studies (I2 = 78.3%; P = .001). In addition, there was significant difference between T2DM and LBMF in studies that reported HR as an effect estimate (HR: 1.26; 95% CI: 1.11–1.43; P < .001), while no significant difference was detected in studies that reported RR/OR as an effect estimate (RR/OR: 1.06; 95% CI: 0.86–1.29; P = .597). The conclusion did not change when sensitivity analysis was conducted (Table 3).
Figure 3.

Association between diabetes mellitus and low bone mass-related fractures in men.
Table 3.
Sensitivity analysis for men and women.
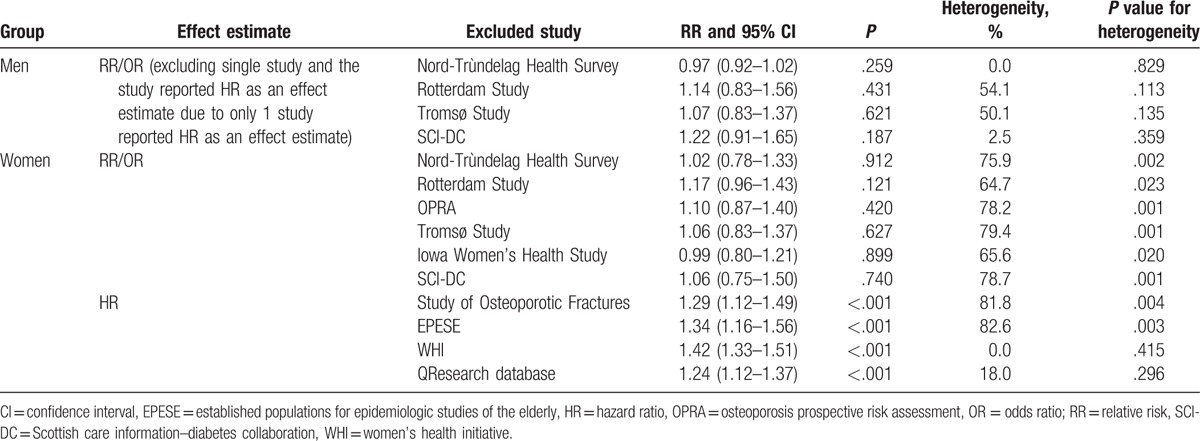
Twelve studies reported an association between T2DM and LBMF in women. The pooled analysis revealed that T2DM significantly increased the risk of LBMF (RR: 1.19; 95% CI: 1.04–1.36; P = .010; Fig. 4). A significant heterogeneity was observed among the included studies (I2 = 88.5%; P < .001). This significant difference was observed in studies that reported HR as an effect estimate (HR: 1.32; 95% CI: 1.16–1.50; P < .001), while not observed in studies that reported RR/OR as an effect estimate (RR/OR: 1.07; 95% CI: 0.86–1.33; P = .552). The conclusion was not affected by the exclusion of any specific trial from all of the pooled analyses (Table 3).
Figure 4.
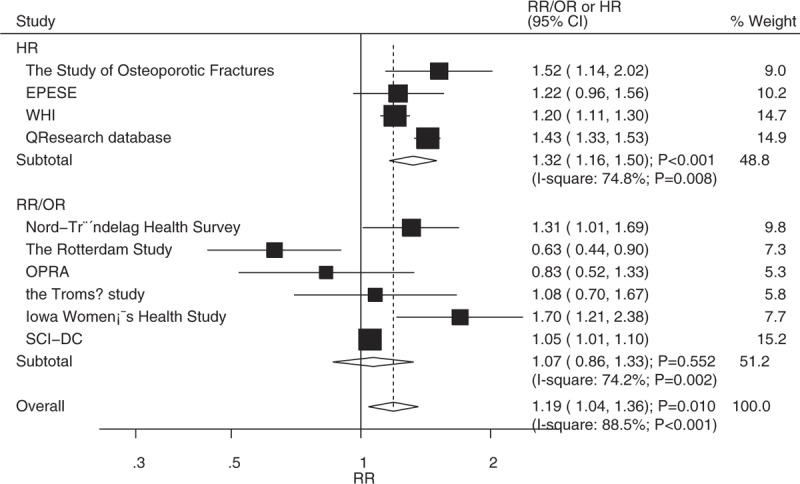
Association between diabetes mellitus and low bone mass-related fractures in women.
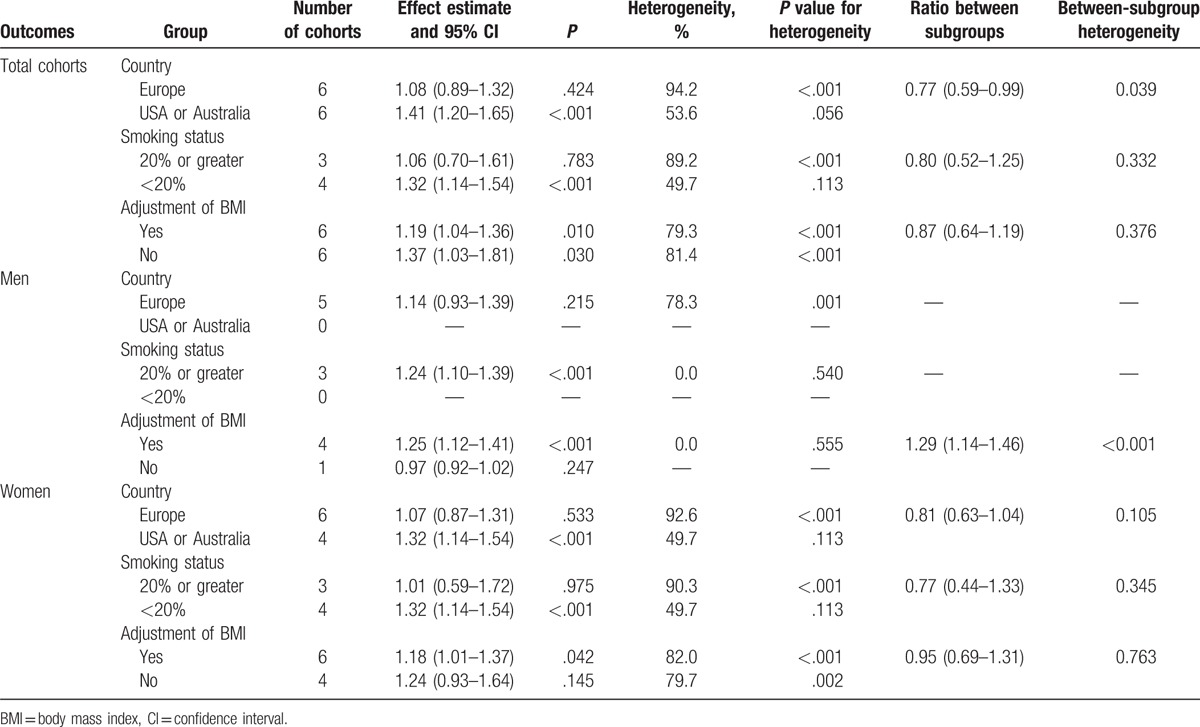
Heterogeneity testing showed a P value of <.10 for the relationship between T2DM and the risk of LBMF. Therefore, stratified analyses for T2DM were performed based on country, smoking status, and adjusted or nonadjusted BMI, to minimize heterogeneity among the included studies and evaluate the association between T2DM versus control and LBMF. As shown in Table 4, no significant association was found between T2DM and LBMF when the study was conducted in Europe or percentage smoking was 20% or greater in total cohorts. Further, men with T2DM were associated with the elevated risk of LBMF in a study with the percentage smoking of 20% or greater or the study adjusted for BMI. In addition, women with T2DM significantly increased the risk of LBMF when the study was conducted in the United States or Australia, the percentage smoking was <20%, and the study adjusted for BMI. However, women with T2DM exerted a protective effect on LBMF if the study used OR as an effect estimate. Finally, the ratio between subgroups indicated the risk of LBMF, which was lower in Europe compared with that in the United States or Australia. The study that adjusted for BMI was associated with a higher risk of LBMF in men compared with the study not adjusted for BMI.
Table 4.
Subgroup analyses for total cohorts, men, and women.
A potential publication bias for the risk of LBMF was found in the funnel plots (Fig. 5). Quantitative Egger and Begg tests were used to assess the publication bias. No evidence of publication bias for LBMF was reported (P value for Egger test: .235; P value for Begg test: 1.000).
Figure 5.
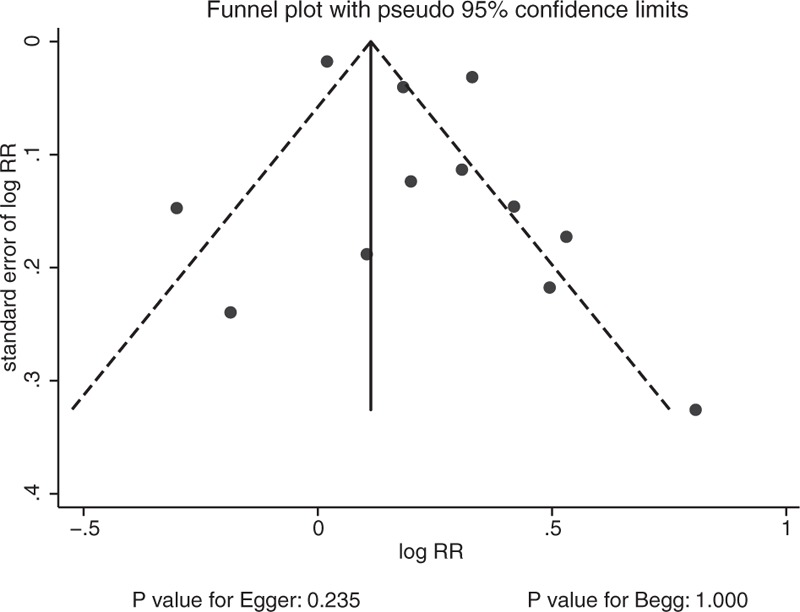
Funnel plot.
4. Discussion
The present meta-analysis was based on cohort studies and explored all the possible relationships between T2DM and the risk of LBMF. The findings suggested that patients with T2DM manifested a higher risk of LBMF. Furthermore, the pooled RR indicated that T2DM increased the incidence of LBMF significantly compared with nondiabetes in women. No such effect was seen in men.
A previous meta-analysis suggested that patients with T1DM or T2DM showed a significantly increased risk of LBMF. However, T2DM was associated with a higher level of BMD, whereas T1DM was associated with a lower level of BMD.[31] The inherent limitation of the previous review was related to a shorter duration of follow-up, which failed to reveal a significant clinical benefit, especially if event rates were lower than expected. Furthermore, T2DM was associated with the degree of control achieved, and the treatment regimens for T2DM might affect the incidence of LBMF. Therefore, a meta-analysis of studies was conducted to evaluate these relationships.
Most of the findings of the present study were consistent with the results of a cohort study from Norway.[10] This prospective study revealed that the risk of hip fracture in women younger than 75 years with T1DM or with a longer-duration T2DM, whereas a shorter-duration T2DM significantly increased the risk of hip fractures. The present study also indicated that T2DM significantly increased the risk of LBMF. T2DM induced stiffening of endothelial cells, thickening, and narrowing, which might have affected the bone mass.
A significant association between T2DM and the risk of LBMF was observed. However, several studies included in the present meta-analysis reported inconsistent results. The Rotterdam Study indicated that participants with T2DM had an increased BMD, and women with T2DM were associated with a lower incidence of nonvertebral fractures.[17] The osteoporosis prospective risk assessment group found no association between T2DM and LBMF, whereas elderly women with T2DM and without renal insufficiency had high bone mass and low bone turnover.[18] These 2 studies specifically included populations at a lower risk of LBMF, mostly without a history of DM, which probably affected the subsequent risk. Furthermore, the Rotterdam Study used the 2-h value, and the fasting oral glucose tolerance test was not performed. In addition, patients with DM were found to be less active and associated with poorer health compared with healthy individuals, which might have affected the incidence of LBMF.
Heterogeneity between the subgroups demonstrated that the country and effect estimates were significantly associated with the relationship between T2DM and LBMF in the total cohorts (Table 4). Furthermore, adjusted BMI showed no effect on the relationship in men, while effect estimate biased the relationship in women. The possible reason for this could be that 1 study reported OR as an effect estimate and specifically used the 2-h value for assessing DM and its association with lower incidence of LBMF. We noted that the relationship between T2DM and LBMF was associated with statistical significance in studies that reported HR as an effect estimate, while this was not observed in studies reporting RR/OR as an effect estimate. The reason for this could be that T2DM patients were associated with a poor quality of life, and time for LBMF occurred sooner than non-T2DM patients. Lastly, the findings of the subgroup analysis based on other factors may be unreliable due to the smaller number of cohorts included in such a subset. These findings highlight a potential relationship between T2DM and LBMF in specific subsets and developed a synthetic and comprehensive review.
The 2 strengths of the present study are as follows: most of the included studies were prospective cohort studies, eliminating selection and recall bias, which is a limitation in retrospective case–control studies; and the large sample size helped in quantitatively assessing the association of T2DM with the risk of LBMF. Therefore, these findings are potentially more robust than those of any individual study.
The limitations of the present study are as follows: the adjusted models varied across the included studies, and the adjusted factors were implicated in the development of LBMF; publication bias was inevitable in the meta-analysis of published studies; the duration of the follow-up period may have affected this relationship; stratified analyses based on the age of individuals were not conducted because only 2 of the studies reported the mean age of the participants; glycemic control strategy was not adjusted in all of the included studies, hence the hyperglycemic status could have affected the progression of LBMF; and subgroup analyses based on RR/OR and HR were not conducted due to the small size of the cohorts, which might have affected the strength of the summary results.
Our results suggest that T2DM might be critical for the risk of LBMF, especially in women. Additional therapeutic interventions should be employed to reduce the incidence and progression of T2DM. Future studies should focus on specific populations to analyze the relationship between T2DM and the risk of LBMF.
Footnotes
Abbreviations: BMD = bone mineral density, BMI = body mass index, CI = confidence interval, DM = diabetes mellitus, HR = hazard ratio, LBMF = low bone mass-related fractures, NOS = Newcastle–Ottawa Scale, OR = odds ratio, RRs = relative risks, T2DM = type 2 diabetes mellitus.
The authors have no funding and conflicts of interest to disclose.
References
- [1].Zimmet P, Alberti KG, Shaw J. Global and societal implications of the diabetes epidemic. Nature 2001;414:782–7. [DOI] [PubMed] [Google Scholar]
- [2].Narayan KM, Boyle JP, Thompson TJ, et al. Lifetime risk for diabetes mellitus in the United States. JAMA 2003;290:1884–90. [DOI] [PubMed] [Google Scholar]
- [3].Stettler C, Allemann S, Juni P, et al. Glycemic control and macrovascular disease in types 1 and 2 diabetes mellitus: meta-analysis of randomized trials. Am Heart J 2006;152:27–38. [DOI] [PubMed] [Google Scholar]
- [4].Sarwar N, Gao P, et al. Emerging Risk Factors Collaboration. Diabetes mellitus, fasting blood glucose concentration, and risk of vascular disease: a collaborative meta-analysis of 102 prospective studies. Lancet 2010;375:2215–22. [DOI] [PMC free article] [PubMed] [Google Scholar]
- [5].Lawson ML, Gerstein HC, Tsui E, et al. Effect of intensive therapy on early macrovascular disease in young individuals with type 1 diabetes. A systematic review and meta-analysis. Diabetes Care 1999;22(suppl 2):B35–9. [PubMed] [Google Scholar]
- [6].Pan H, Wu N, Yang T, et al. Association between bone mineral density and type 1 diabetes mellitus: a meta-analysis of cross-sectional studies. Diabetes Metab Res Rev 2014;30:531–42. [DOI] [PubMed] [Google Scholar]
- [7].Dennison EM, Syddall HE, Aihie Sayer A, et al. Type 2 diabetes mellitus is associated with increased axial bone density in men and women from the Hertfordshire Cohort Study: evidence for an indirect effect of insulin resistance? Diabetologia 2004;47:1963–8. [DOI] [PubMed] [Google Scholar]
- [8].Weber DR, Haynes K, Leonard MB, et al. Type 1 diabetes is associated with an increased risk of fracture across the life span: a population-based cohort study using The Health Improvement Network (THIN). Diabetes Care 2015;38:1913–20. [DOI] [PMC free article] [PubMed] [Google Scholar]
- [9].Martinez-Laguna D, Tebe C, Javaid MK, et al. Incident type 2 diabetes and hip fracture risk: a population-based matched cohort study. Osteoporos Int 2015;26:827–33. [DOI] [PubMed] [Google Scholar]
- [10].Forsen L, Meyer HE, Midthjell K, et al. Diabetes mellitus and the incidence of hip fracture: results from the Nord-Trondelag Health Survey. Diabetologia 1999;42:920–5. [DOI] [PubMed] [Google Scholar]
- [11].Ivers RQ, Cumming RG, Mitchell P, et al. Diabetes and risk of fracture: the Blue Mountains Eye Study. Diabetes Care 2001;24:1198–203. [DOI] [PubMed] [Google Scholar]
- [12].Strotmeyer ES, Cauley JA, Schwartz AV, et al. Nontraumatic fracture risk with diabetes mellitus and impaired fasting glucose in older white and black adults: the health, aging, and body composition study. Arch Intern Med 2005;165:1612–7. [DOI] [PubMed] [Google Scholar]
- [13].Nicodemus KK, Folsom AR. Iowa Women's Health Study. Type 1 and type 2 diabetes and incident hip fractures in postmenopausal women. Diabetes Care 2001;24:1192–7. [DOI] [PubMed] [Google Scholar]
- [14].Taylor BC, Schreiner PJ, Stone KL, et al. Long-term prediction of incident hip fracture risk in elderly white women: study of osteoporotic fractures. J Am Geriatr Soc 2004;52:1479–86. [DOI] [PubMed] [Google Scholar]
- [15].Lee RH, Pieper CF, Colon-Emeric C. Functional impairments mediate association between clinical fracture risk and type 2 diabetes mellitus in older women. J Am Geriatr Soc 2015;63:1546–51. [DOI] [PMC free article] [PubMed] [Google Scholar]
- [16].Hippisley-Cox J, Coupland C. Predicting risk of osteoporotic fracture in men and women in England and Wales: prospective derivation and validation of QFractureScores. BMJ 2009;339:b4229. [DOI] [PMC free article] [PubMed] [Google Scholar]
- [17].van Daele PL, Stolk RP, Burger H, et al. Bone density in non-insulin-dependent diabetes mellitus. The Rotterdam Study. Ann Intern Med 1995;122:409–14. [DOI] [PubMed] [Google Scholar]
- [18].Gerdhem P, Isaksson A, Akesson K, et al. Increased bone density and decreased bone turnover, but no evident alteration of fracture susceptibility in elderly women with diabetes mellitus. Osteoporos Int 2005;16:1506–12. [DOI] [PubMed] [Google Scholar]
- [19].Ahmed LA, Joakimsen RM, Berntsen GK, et al. Diabetes mellitus and the risk of non-vertebral fractures: the Tromsø study. Osteoporos Int 2006;17:495–500. [DOI] [PubMed] [Google Scholar]
- [20].Hothersall EJ, Livingstone SJ, Looker HC, et al. Contemporary risk of hip fracture in type 1 and type 2 diabetes: a national registry study from Scotland. J Bone Miner Res 2014;29:1054–60. [DOI] [PMC free article] [PubMed] [Google Scholar]
- [21].Moher D, Liberati A, Tetzlaff J, et al. Preferred reporting items for systematic reviews and meta-analyses: the PRISMA statement. PLoS Med 2009;6:e1000097. [DOI] [PMC free article] [PubMed] [Google Scholar]
- [22].Wells GA, Shea B, O’connell D, et al. The Newcastle-Ottawa Scale (NOS) for assessing the quality of nonrandomised studies in meta-analyses. Ottawa Hospital Research Institute 2014. [Google Scholar]
- [23].DerSimonian R, Laird N. Meta-analysis in clinical trials. Control Clin Trials 1986;7:177–88. [DOI] [PubMed] [Google Scholar]
- [24].Ades AE, Lu G, Higgins JP. The interpretation of random-effects meta-analysis in decision models. Med Decis Making 2005;25:646–54. [DOI] [PubMed] [Google Scholar]
- [25].Deeks JJ, Higgins JPT, Altman DG. Higgins J, Green S. Analyzing data and undertaking metaanalyses. The Cochrane Collaboration, Cochrane Handbook for Systematic Reviews of Interventions 5.0.1. Oxford, UK:2008. [Google Scholar]
- [26].Higgins JP, Thompson SG, Deeks JJ, et al. Measuring inconsistency in meta-analyses. BMJ 2003;327:557–60. [DOI] [PMC free article] [PubMed] [Google Scholar]
- [27].Deeks JJ, Altman DG, Bradburn MJ. Egger M, Davey Smith G, Altman DG. Statistical methods for examining heterogeneity and combining results from several studies in meta-analysis. Systematic Reviews in Health Care: Metaanalysis in Context. London: BMJ Books; 2001. 285–312. [Google Scholar]
- [28].Tobias A. Assessing the influence of a single study in the meta-analysis estimate. Stata Tech Bull 1999;8:7526–9. [Google Scholar]
- [29].Egger M, Davey Smith G, Schneider M, et al. Bias in meta-analysis detected by a simple, graphical test. BMJ 1997;315:629–34. [DOI] [PMC free article] [PubMed] [Google Scholar]
- [30].Begg CB, Mazumdar M. Operating characteristics of a rank correlation test for publication bias. Biometrics 1994;50:1088–101. [PubMed] [Google Scholar]
- [31].Vestergaard P. Discrepancies in bone mineral density and fracture risk in patients with type 1 and type 2 diabetes—a meta-analysis. Osteoporos Int 2007;18:427–44. [DOI] [PubMed] [Google Scholar]


