Abstract
The circulating concentration of N-terminal pro-brain natriuretic peptide (NT-proBNP) has been shown to be a diagnostic tool for the detection of heart failure. Several factors influence NT-proBNP levels including age, sex, and body mass index (BMI). Therefore, the diagnostic sensitivity of NT-proBNP level for heart failure is relatively higher, but its specificity is low. This study aims to improve the diagnostic accuracy rate of this test by including multiple variables in the diagnostic test.
The suspected chronic heart failure outpatients were divided into heart failure with reduced ejection fraction, heart failure with mid-range ejection fraction, heart failure with preserved ejection fraction, and normal heart function groups. Area under the receiver-operating characteristic (ROC) curve, cut-off value, and logistic regression analysis were used to select the model variables, sensitivity and specificity.
In all, 436 subjects enrolled into this study were divided in 2 groups: model establishment (n = 300) and model validation (n = 136). In the model establishment group, the area under the curve (AUC) and cut-off value of NT-proBNP was 0.926 and 257.4 pg/mL, respectively. When age, glomerular filtration rate, BMI, atrial fibrillation, and sex were entered into the diagnosis model, AUC, sensitivity, and specificity further increased to 0.955 (95% confidence interval [CI] 0.934, 0.976), 94.2% (from 93.0%), and 86.7% (from 74.2%). The ROC curve of corrected NT-proBNP diagnostic formula for heart failure was also significantly higher (P = .037).
The corrected NT-proBNP diagnostic formula was found to improve the diagnostic accuracy of chronic heart failure.
Keywords: chronic heart failure, corrected NT-proBNP, improved diagnosis
1. Introduction
Atrial natriuretic peptides (ANPs) and brain natriuretic peptides (BNPs) are secreted from cardiomyocytes in response to atrial/ventricular dilation or volume overload. Although ANP is synthesized in atrium and BNP in ventricles, both can be synthesized in either chamber under pathological conditions. In response to volume expansion or stress, pre-proBNP is released and is subsequently cleaved to pro-BNP. This is further cleaved to biologically active BNP and inactive N-terminal fragment (NT-proBNP).[1,2] The circulating levels of NT-proBNP and BNP have been widely applied in diagnosis and prognosis assessment of heart failure.[3–8]
According to the 2016 ESC acute and chronic heart failure guidelines, circulating levels of NT-proBNP and BNP can be used as an initial diagnostic test. The cut-off values of NT-proBNP and BNP for patients without acute heart failure are 125 and 35 pg/mL, respectively.[9] Patients whose medical history or symptoms suggest heart failure and if their NT-proBNP/BNP values show higher than the upper limit, they are required to undergo further examination such as echocardiography. NT-proBNP/BNP values have been used as a screening index, as its negative predictive value is relatively high (94%–98%), whereas the positive predictive value is low (44%–57% for nonacute heart failure, 66%–67% for acute heart failure).[9–15]
The BNP levels of the patients can be affected by multiple factors including age, reduced renal function, and atrial fibrillation, which lead to increased levels of NT-proBNP/BNP.[16] Similarly, clinical setting such as aortic stenosis, acute pulmonary embolism, or severe pulmonary hypertension [2,16–22] can cause increase in natriuretic peptides levels, whereas factors such as obesity can lead to reduced NT-proBNP/BNP levels.[23,24] Thus, the diagnostic accuracy of the NT-proBNP/BNP test is low.
Echocardiography is considered to be the investigation of choice for confirming cases of cardiac dysfunction; however, it is limited by its cost and requirement of trained doctors for its clinical interpretation,[25,26] where the accuracy of the diagnosis is correlated with the experience of the ultrasound doctors.[27] In addition, for heart failure patients with heart failure with reduced ejection fraction (HFrEF), the diagnostic accuracy of ultrasound is higher. For patients with heart failure with preserved ejection fraction (HFpEF), it is required to combine the ultrasound results with clinical signs, symptoms, and BNP results. Other diagnostic methods for heart failure include cardiac magnetic resonance imaging (MRI), stress test, and invasive left ventricular filling pressure measurement. These techniques involve invasive operation procedures and high costs. The above mentioned diagnostic methods are used in the cases where clear diagnosis by routine examinations cannot be obtained.[9] Thus, there is a need to improve the diagnostic accuracy of NT-proBNP/BNP test for heart failure, which could prove beneficial in the field of chronic heart failure.
In this study, we devised an integrated multivariate analysis combined with the NT-proBNP test, which could significantly increase the diagnostic accuracy of heart failure.
2. Methods
2.1. Study population
The suspected heart failure outpatients with symptoms of fatigue or breathlessness after activities and lower-extremity edema were enrolled into this study. The patients were screened between June 2014 and December 2015, and a total of 436 subjects from Shanghai Sixth People's Hospital were enrolled into this study. This study was approved by the ethics committee of Shanghai Sixth People's Hospital (2013-KY-021(K)-(1)). Written informed consent was obtained from each patient.
The inclusion criteria were: >20 years of age; suspected symptoms or signs of heart failure without obvious changes within 1 week; and New York Heart Association (NYHA) classification: NYHA II to III. The exclusion criteria were: acute myocardial infarction within 2 weeks; severe valvular heart disease; acute pulmonary embolism; severe infection or sepsis; acute decompensated heart failure; or diagnosis of heart failure by echocardiography, radionuclide imaging, or MRI within the past 3 months.
The patients diagnosed with heart failure based on the symptoms and the echocardiography results were further divided into the following 3 groups[28–30]:
-
(i)
HFrEF: The patients had clinical symptoms and/or signs of heart failure, and single plane Simpson method showed LVEF ≤40%.
-
(ii)
HFpEF borderline (named heart failure with mid-range ejection fraction [HFmrEF] in the 2016 ESC guideline): The patients had clinical symptoms and/or signs of heart failure, and single plane Simpson method showed LVEF of 41% to 49%.
-
(iii)
HFpEF: The subjects met all the criteria: the patient had clinical symptoms and/or signs of heart failure; single-plane Simpson method showed LVEF ≥50%; relevant structural heart disease (left ventriocular hypertrophy/left atrial enlargement) or diastolic dysfunction. The result of tissue Doppler echocardiography showed E/e’ >15 or the result of tissue Doppler echocardiography showed E/e′ = 8 to 15 with enlarged left atrium (left atrial volume >34 mL/m2) or left ventricular hypertrophy. All patients were consecutively enrolled in into this study. Since the study, design, and grouping was conducted in 2014, we used the 2012 ESC and 2013 ACCF/AHA diagnostic criteria rather than the 2016 diagnostic criteria for heart failure diagnosis.
2.2. Clinical parameters
The different clinical parameters were calculated as follows.
2.2.1. Body mass index
The BMI was derived from the weight and height of each patient.
 |
The weight and height were expressed in units of kilograms and meters.
2.2.2. Persistent atrial fibrillation
Atrial fibrillation lasted for more than 7 days, and confirmation of atrial fibrillation was done by electrocardiography before recruitment.
2.2.3. Diabetes mellitus
The diagnostic criteria (according to the American Diabetes Association guidelines 2013[31]) for diabetes mellitus included fasting plasma glucose levels ≥126 mg/dL or 2-hour plasma glucose levels ≥200 mg/dL or random plasma glucose levels in a patient (with symptoms of hyperglycemia) ≥200 mg/dL. Fasting was defined as no calorie intake for at least 8 hours.
2.2.4. Estimated glomerular filtration rate
Estimated glomerular filtration rate (eGFR) was calculated by the following 4-component Modification of Diet in Renal Disease equation[32] which incorporates age, race, sex, and serum creatinine concentration: eGFR = 186 × (serum creatinine [mg/dL]) − 1.154 × (age [years]) − 0.203 × 0.742 (for women).
2.3. Laboratory analysis
The patients fasted overnight for a minimum of 8 hours and rested for 15 minutes before venipuncture. Venous blood was drawn into EDTA (hemoglobin and NT-proBNP) and heparin tubes (creatinine, sodium, and potassium), and either promptly centrifuged at 4°C and plasma analyzed the same day, or stored as frozen plasma at −80°C in aliquots. We analyzed plasma concentrations of sodium, potassium (HITACHI 7600–120), creatinine (15), and hemoglobin (Sysmex XE 2100) on the day of collection. Plasma concentrations of NT-proBNP were analyzed by electrochemiluminescence on a Roche cobas e 411.[33] This assay uses 2 epitopes: one in the C-terminus (1–21 region) and another in the 39 to 50 region of proBNP 1 to 76. Imprecision values were 2.9% and 6.1% in the high and low range, respectively.
2.4. Echocardiography
Doppler echocardiographic examination (IE33 Phillips) evaluating the systolic and diastolic functions were performed with the patient in supine left position. Values for systolic function were expressed as LVEF whereas, diastolic dysfunction was defined by an increased mitral inflow velocity (E) to tissue Doppler (e’) ratio (E/e’). 2-dimensional echocardiogram from the apical view was used to determine the systolic ejection fraction by planimetry of the left ventricle (using modified Simpson method). Tissue Doppler signals were measured at septal and lateral sides of the mitral annulus, and its average was calculated.
2.5. Statistical analysis
Data were statistically processed and analyzed using the SPSS 16.0 software package. Continuous data were tested for normal distribution using the Kolmogorov-Smirnov test. Descriptive statistics were presented as mean ± standard deviation (SD), and percentages for continuous data and categorical data. NT-proBNP levels were non-normally distributed and were analyzed using the nonparametric Kruskal-Wallis test. Analysis of continuous and categorical data was performed by 2-sample t test and chi-square test, respectively. 1-way analysis of variance was used to evaluate the differences among the groups (more than 2 groups). Multivariate logistic regression was used to establish the basic diagnosis model and area under the curve (AUC) was used to screen the model variables. The targeted and reasonable diagnosis model was the one which used minimal variables and obtained the maximum AUC value. The original model was constructed using NT-proBNP, age, eGFR, and BMI. Then, the remaining screening parameters were gradually included in the model. After achieving the best AUC, variables were removed to confirm that they contributed to optimal AUC. The targeted variables were applied to establish the formula of logistic regression and ROC curve, and the cut-off value was calculated as: Youden index (YI) = sensitivity (1 − specificity). Based on logistic regression and cut-off values, patients with heart failure of the validation data set were diagnosed, and sensitivity and specificity were calculated. In the validation dataset, the STAT software was used to compare the ROC curves of the 2 different diagnostic methods.
2.6. Sample size estimation for model establishment
Sample size estimation was calculated by the following formula: N = 10k/p, where p is the smallest of the proportions of positive cases in the population and k the number of covariates (the number of independent variables).
The estimated positive detection rate, maximum independent variable number, and minimum sample size of heart failure in the subject population were 50%, 10, and 200, respectively. To ensure the data reliability, a total of 450 patients with suspected chronic compensated heart failure were enrolled. The former 300 cases were entered into a dataset of model establishment, and the diagnostic model of NT-proBNP was established. The latter 150 cases were entered into dataset of model validation.
3. Results
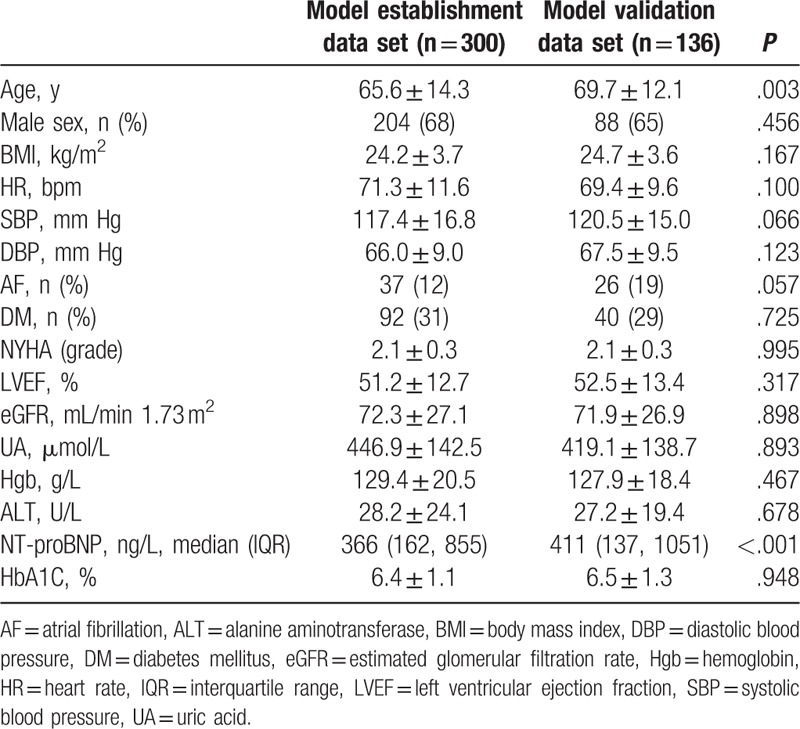
According to the study design, the first 300 cases were entered into the model establishment dataset, and the latter 136 cases were entered into the model validation dataset. The general data and main laboratory test results are listed in Table 1. The screened variables include sex, age, BMI, eGFR, persistent atrial fibrillation, diabetes, hemoglobin, serum alanine aminotransferase (ALT), blood uric acid (UA), and glycosylated hemoglobin (HbA1C). The mean age of the patients in the validation dataset was higher than the patients of model establishment dataset (P = .003). There was no significant difference in other baseline data between the 2 groups.
Table 1.
Baseline characteristics of the patients.
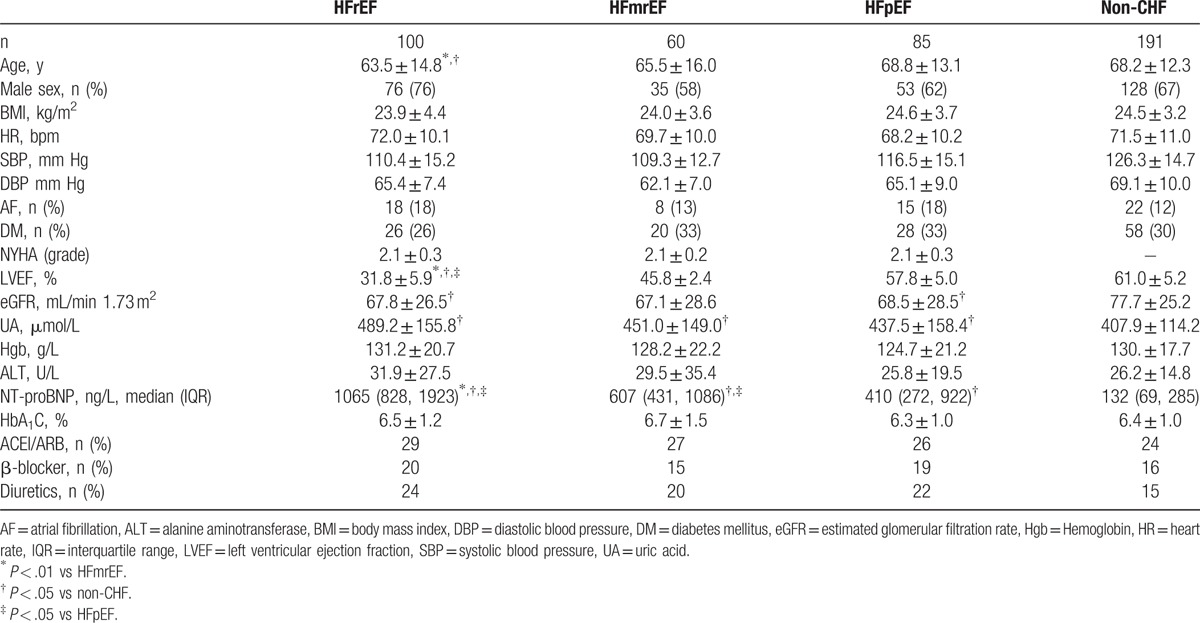
According to previous heart failure diagnostic criteria, a total of 245 cases were diagnosed as chronic heart failure. Of them, 100 cases were HFrEF (LVEF ≤40%), 60 cases were HFmrEF (LVEF 41%–49%), and 85 cases were HFpEF (LVEF ≥50%) (Table 2). The LVEF value of HFrEF patients was significantly lower than that of the other groups (P < .001). There was a significant difference in the NT-proBNP value among the groups (HFrEF > HFmrEF > HFpEF > non-CHF; P < .001). The age of these groups were also significantly different, with the mean ages of the HFpEF and non-CHF groups being significantly higher than that of the HFrEF group (P = .008 and .005, respectively). Compared with the nonheart failure patients, the renal function (eGFR) of heart failure patients (including HFrEF, HFmrEF, and HFpEF patients) was significantly reduced (P = .003, P = .007, P = .008, respectively), whereas UA levels were increased (P < .001, P = .036, P = .101, respectively). Both systolic and diastolic blood pressure of heart failure patients was lower than that of the nonheart failure patients (P < .001). The trial included 132 patients with diabetes (including type 1 and type 2 diabetes; however, most patients were type 2 diabetes according to the medical history) and 63 patients with persistent atrial fibrillation. There was no significant difference in the proportion of diabetic and persistent atrial fibrillation patients in HFrEF, HFmrEF, HFpEF, and non-CHF groups (DM: P = .651; AF: P = .377). The other parameters such as sex ratio, Hgb, HbA1C, and ALT also did not show any statistical difference between the groups.
Table 2.
Demographic and clinical parameters between CHF and non-CHF patients.
Nonstratified NT-proBNP values were used to diagnose chronic heart failure in patients (n = 436) to understand the diagnostic efficacy of the nonstratified NT-proBNP values in this study. ROC curve was used as the gold standard and the AUC of NT-proBNP value was 0.924 (95% CI 0.901, 0.947) in all patients (Fig. 1). In addition, when selecting 258.80 pg/mL as NT-proBNP cut-off value, YI value reached maximum (0.6473). The sensitivity and specificity were calculated as 91.4% and 73.3% for diagnosis of chronic heart failure, respectively.
Figure 1.
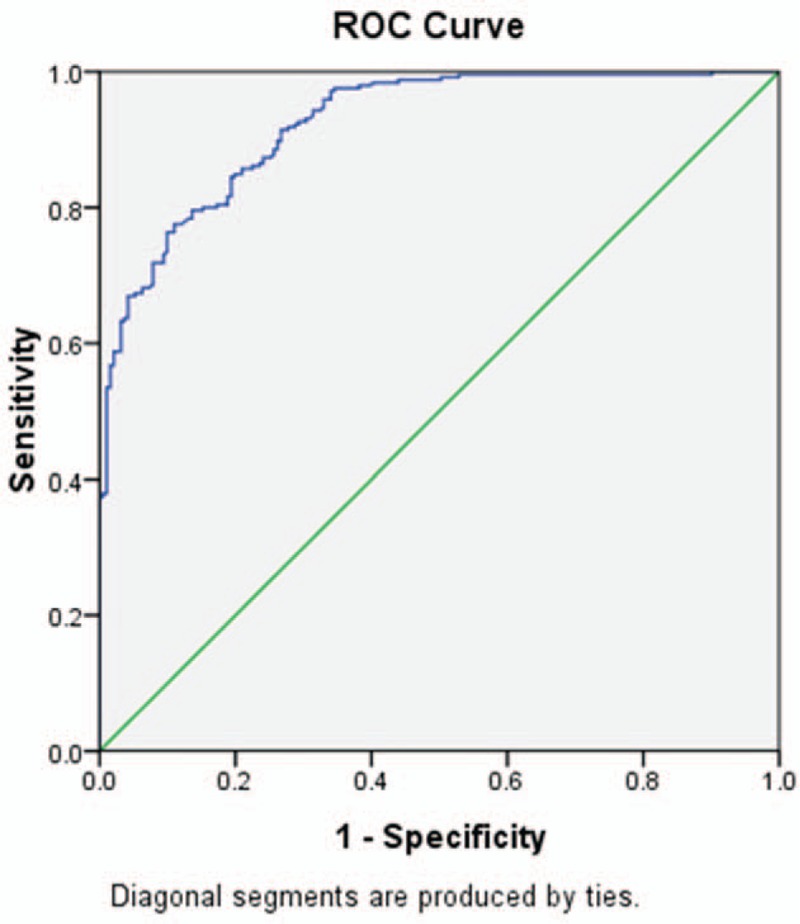
Receiver-operating characteristic (ROC) curve of uncorrected NT-proBNP as a diagnostic test for the detection of chronic heart failure. NT-proBNP = N-terminal pro-brain natriuretic peptide.
In the 300 patients of the model establishment dataset, AUC of the NT-proBNP value for the diagnosis of chronic heart failure was 0.926 (95% CI 0.898, 0.957). The cut-off value was 257.4 pg/mL, and the sensitivity and specificity were 93.0% and 74.2%, respectively. It has been previously shown that age, renal function (eGFR), and BMI could affect the NT-proBNP values. Thus, in this study, chronic heart failure was set as the targeted variable, and NT-proBNP, age, eGFR, and BMI were considered as the covariables. According to the diagnostic standard, ROC curve was drawn, and the AUC value of the diagnostic model was found to be 0.945 (95% CI 0.921, 0.96). The remaining variables were entered into the model and it was found that addition of variables, sex, and atrial fibrillation could further increase the AUC value to 0.955 (95% CI 0.934, 0.976). Changes in AUC were not observed when other variables were entered. Nevertheless, when any 1 variable including age, eGFR, BMI, atrial fibrillation, or sex were excluded, the AUC value decreased. Thus, these 5 variables and NT-proBNP were chosen as covariates, and logistic regression model was obtained as follows: Logit(P) = −4.984 + (0.012 × NT-proBNP) + (0.032 × eGFR) − 0.041 × age + (0.066 × BMI) − 2.830 (AF [0 = no, 1 = yes]) − 0.167 (sex [0 = male, 1 = female]).
Change in AUC for different models is shown in Table 3. The ROC curve and the cut-off value were obtained (the optimal critical cut-off value for the diagnosis of chronic heart failure was determined when YI value achieved the maximum [0.8090]) during the process of model establishment. The cut-off value was 0.3913, and its corresponding sensitivity and specificity were 94.2%, and 86.7%, respectively (Fig. 2).
Table 3.
Change in AUC for different models.
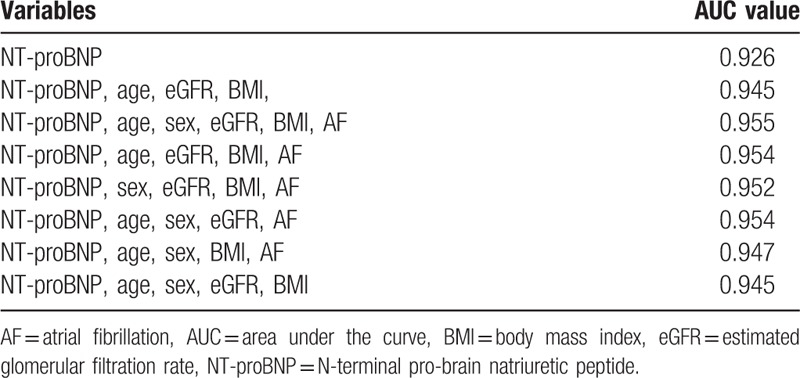
Figure 2.
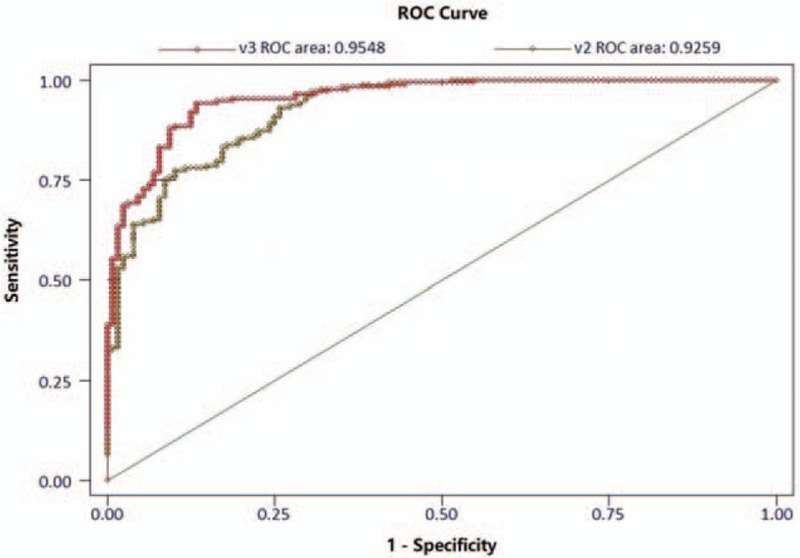
Receiver-operating characteristic (ROC) curve of the model establishment dataset for the detection of chronic heart failure.
The 136 cases of suspected chronic heart failure in the validation dataset were diagnosed through the corrected NT-proBNP diagnostic formula. The diagnostic results were descriptively evaluated according to the previous diagnostic criteria. The sensitivity and specificity of the corrected NT-proBNP model for heart failure diagnosis were 91.2% and 91.5%, respectively, in contrast to the diagnostic sensitivity and specificity of simple NT-proBNP, which were 87.7% and 71.4%, respectively. The negative and positive predictive values of NT-proBNP diagnosis model for heart failure were 90.5% and 91.8%, respectively. The negative and positively predictive values of simple NT-proBNP (257.4 pg/mL) were 83.3% and 78.0%, respectively. The ROC of corrected NT-proBNP diagnosis model for heart failure also increased (0.963) compared with the noncorrected test (0.924) (P = .037) (Fig. 3).
Figure 3.
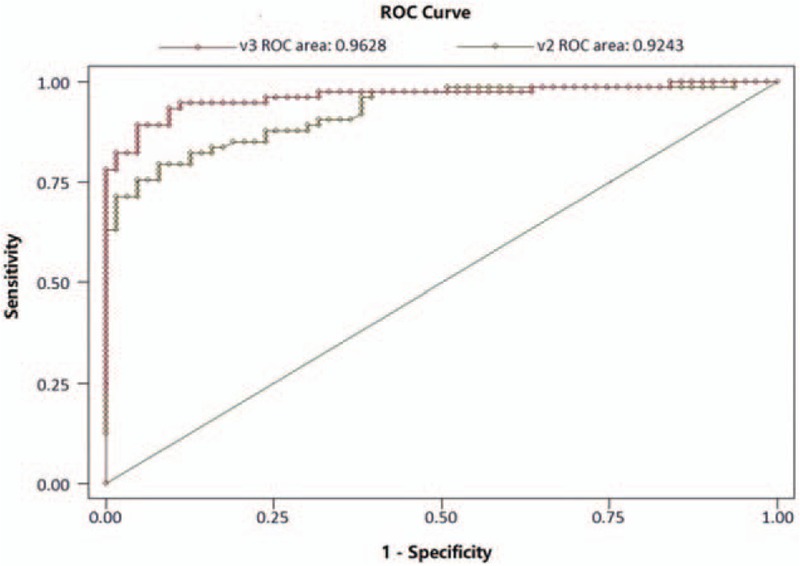
Receiver-operating characteristic (ROC) curve of the model validation dataset for the detection of chronic heart failure.
4. Discussion
In clinical practice, blood levels of both BNP and NT-proBNP are used for the diagnosis and prognosis of heart failure, but its diagnostic value is limited. Therefore, this study aimed to improve the diagnostic accuracy rate of this test by including multiple variables in the diagnostic test. The results showed that the corrected NT-proBNP diagnostic formula was found to improve the diagnostic accuracy of chronic heart failure.
In this study, NT-proBNP was selected as the diagnostic tool because of the following reasons: compared with BNP, the biological half-life of NT-proBNP in vivo is longer, and thus, the blood concentration of NT-proBNP is more stable[1]; the inter and intraindividual variability of NT-proBNP levels are lesser than that of BNP[28–30]; the accuracy of detection of NT-proBNP is better compared with BNP[34]; NT-proBNP is completely cleared by the kidneys, whereas BNP is partially cleared by the kidneys; hence, NT-proBNP may be more affected by renal function.[1]
This diagnostic trial aimed to detect chronic decompensated heart failure, including HFrEF and HFpEF. HFrEF was diagnosed by LVEF value of echocardiography. For accurate detection, some patients were excluded from this study. The excluded patients included those suffering from acute heart failure and other diseases such as acute pulmonary embolism, acute myocardial infarction (in 2 weeks), severe infection, and sepsis. The rationale behind this was the rapid disease progression in case of acute heart failure, which could affect the detection results due to disease course, intravenous medication, and clinical complications. Severe valvular heart disease was also excluded for its inaccurate detection results of LVEF.
The baseline data were balanced between the model establishment and model validation datasets, with no significant differences between the 2 groups for most of the parameters. Consistent with previous studies, NT-proBNP value was significantly different between the HFrEF, HFmrEF, HFpEF, and nonheart failure groups.[4,8,11,12,17,21,33] The renal function of patients with heart failure (including HFrEF and HFpEF) was reduced compared to nonheart failure patients. This could be due to decreased renal perfusion caused by heart failure. Blood pressure (systolic and diastolic) in patients with HFrEF and HFpEF (critical region) was also lower compared with patients with nonheart failure, which could be due to decreased cardiac output in the former.
The diagnosis and classification of cardiac failure in this study is based on the 2012 ESC,[29] the 2013 ACC/AHA guidelines of heart failure,[30] and the ASE Recommendations for the Evaluation of Left Ventricular Diastolic Function by Echocardiography.[26] Heart failure is classified into HFrEF, HEmrEF, and HFpEF in the 2016 ESC guideline of heart failure,[9] with similar diagnostic standards of HFrEF and HEmrEF as this study. The diagnostic standards of HFpEF, however, are a little different. Elevated levels of natriuretic peptides are added to the 2016 ESC guideline of heart failure as a diagnosis standard.[9] In the present study, the 436 enrolled patients were reassessed, and only 1 HFpEF patient was reclassified as noncardiac failure, because the NT-proBNP was <125 pg/mL.
This study included factors that could influence NT-proBNP levels (based on previous studies[9–13]) and general indexes of chronic heart failure in the regression model, to improve the diagnostic capability of NT-proBNP test for heart failure. These observation indexes include sex, age, BMI, eGFR, persistent atrial fibrillation, diabetes, hemoglobin, serum ALT, blood UA, and HbA1C. Blood pressure and heart rate have not been monitored in this study as changes in blood pressure and heart rate cannot influence the detected levels of serum NT-proBNP. Previous research has identified age, renal function (eGFR), and BMI as factors that could affect the levels of NT-proBNP value.[9–13] Hence, these variables were entered into the diagnosis model for heart failure, and it was found that they could increase the AUC. Subsequently, other variables including atrial fibrillation and sex were screened, and it was observed that persistent atrial fibrillation and sex could also further increase the AUC. In addition, the AUC value was compromised if any 1 of the above 5 variables were removed from the model. Thus, age, renal function (eGFR), BMI, persistent atrial fibrillation, and sex could be considered as the covariates for the diagnosis model for heart failure.
Previous studies have shown that the negative predictive value of NT-proBNP/BNP was higher (94%–98%) than its positive predictive value (44%–57% for nonacute heart failure, 66%–67% for acute heart failure).[9–15] In this study, the negative and positive predictive values of the noncorrected NT-proBNP test in the model validation group were found to be 83.3% and 78%, which was better compared with the previous studies.[9–15] This may be due to the cut-off value, which, in this study, was 257.4 ng/L. When the cut-off value was set to 125 ng/L (same as previous studies), the negative and positive predictive values changed to 96.6% and 67.3%, respectively. Nevertheless, the corrected NT-proBNP model proposed here achieved better diagnostic accuracy than that of previous studies.[9–15] Nevertheless, further study could still refine the model. In addition, the model should be validated in different populations and countries.
This study aimed to establish a correction formula of NT-proBNP to enhance its diagnostic accuracy. As an experimental indicator, NT-proBNP could contribute to the rapid diagnosis of heart failure. Echocardiography was the gold standard in diagnosing heart failure, but echocardiography is expensive and appointments were needed. It is true that EF itself can be used to diagnose HFrEF, but EF was not included in the corrected formula, because the rapid diagnosis achieved using this new formula would become meaningless.
From the results of the logistic regression model (Logit [P] = −4.984 + [0.012 × NT-proBNP] + [0.032 × eGFR] − 0.041 × age + [0.066 × BMI] − 2.830 [AF {0 = no, 1 = yes}] − 0.167 [sex {0 = male, 1 = female}]), male patients with higher GFR, younger age, higher BMI, and no AF are more likely to have CHF. Actually it is not correct. These factors could contribute to improve the accuracy of NT-pro BNP in diagnosing CHF. In other words, under the condition that NT-proBNP levels are the same, it is more probable to have CHF if GFR and BMI are higher, age is younger, there is no AF, and the patient is male.
The present study is not without limitations. The subjects included in this study were chronic heart failure patients with NYHA II to III. The obtained diagnosis formula for diagnosis of heart failure was applied to this kind of compensated patients. However, this diagnosis formula may not be suitable for the patients with acute heart failure. Thus, further investigation is required to validate the diagnostic value of this model for other heart failure populations. Many enrolled subjects were old and/or with reduced renal function, which might contribute to high NT-proBNP levels in non-CHF patients. In addition, about half of the suspected heart failure patients were selected by general doctors in the community or other departments. These factors might have caused some possible selection biases.
5. Conclusions
This study provides a diagnostic model for the diagnosis of NYHA II to III chronic heart failure. The corrected NT-proBNP test was established by inclusion of multivariate regression analysis. It was found that compared with uncorrected NT-proBNP, the diagnostic formulation of corrected NT-proBNP could improve the diagnostic accuracy of chronic heart failure.
Acknowledgment
We thank Professor Naiqing Zhao (School of Public Health, Fudan University) for guiding the statistical analysis.
Footnotes
Abbreviations: ALT = alanine aminotransferase, ANP = atrial natriuretic peptide, AUC = area under the curve, BMI = body mass index, BNP = brain natriuretic peptide, eGFR = estimated glomerular filtration rate, HbA1C = glycosylated hemoglobin, HFmrEF = heart failure with mid-range ejection fraction, HFpEF = heart failure with preserved ejection fraction, HFrEF = heart failure with reduced ejection fraction, NT-proBNP = N-terminal pro-brain natriuretic peptide, ROC = receiver-operating characteristic, UA = uric acid, YI = Youden index.
YP and DL contributed equally to this study.
Funding: This study was supported by Shenkang General Program (SHDC12015318) and the National Natural Science Foundation of China (81300177).
The authors declared that they had no conflicts of interest.
References
- [1].Daniels LB, Maisel AS. Natriuretic peptides. J Am Coll Cardiol 2007;50:2357–68. [DOI] [PubMed] [Google Scholar]
- [2].Hall C. Essential biochemistry and physiology of (NT-pro)BNP. Eur J Heart Fail 2004;6:257–60. [DOI] [PubMed] [Google Scholar]
- [3].Maisel AS, Krishnaswamy P, Nowak RM, et al. Rapid measurement of B-type natriuretic peptide in the emergency diagnosis of heart failure. N Engl J Med 2002;347:161–7. [DOI] [PubMed] [Google Scholar]
- [4].Januzzi JL, Jr, Camargo CA, Anwaruddin S, et al. The N-terminal Pro-BNP investigation of dyspnea in the emergency department (PRIDE) study. Am J Cardiol 2005;95:948–54. [DOI] [PubMed] [Google Scholar]
- [5].Maisel A, Hollander JE, Guss D, et al. Primary results of the Rapid Emergency Department Heart Failure Outpatient Trial (REDHOT). A multicenter study of B-type natriuretic peptide levels, emergency department decision making, and outcomes in patients presenting with shortness of breath. J Am Coll Cardiol 2004;44:1328–33. [DOI] [PubMed] [Google Scholar]
- [6].Wang TJ, Larson MG, Levy D, et al. Plasma natriuretic peptide levels and the risk of cardiovascular events and death. N Engl J Med 2004;350:655–63. [DOI] [PubMed] [Google Scholar]
- [7].Janssens S, Dubois C, Bogaert J, et al. Autologous bone marrow-derived stem-cell transfer in patients with ST-segment elevation myocardial infarction: double-blind, randomised controlled trial. Lancet 2006;367:113–21. [DOI] [PubMed] [Google Scholar]
- [8].Lainchbury JG, Troughton RW, Strangman KM, et al. N-terminal pro-B-type natriuretic peptide-guided treatment for chronic heart failure: results from the BATTLESCARRED (NT-proBNP-Assisted Treatment To Lessen Serial Cardiac Readmissions and Death) trial. J Am Coll Cardiol 2009;55:53–60. [DOI] [PubMed] [Google Scholar]
- [9].Ponikowski P, Voors AA, Anker SD, et al. 2016 ESC Guidelines for the diagnosis and treatment of acute and chronic heart failure: The Task Force for the diagnosis and treatment of acute and chronic heart failure of the European Society of Cardiology (ESC). Developed with the special contribution of the Heart Failure Association (HFA) of the ESC. Eur J Heart Fail 2016;18:891–975. [DOI] [PubMed] [Google Scholar]
- [10].Roberts E, Ludman AJ, Dworzynski K, et al. The diagnostic accuracy of the natriuretic peptides in heart failure: systematic review and diagnostic meta-analysis in the acute care setting. BMJ 2015;350:h910. [DOI] [PMC free article] [PubMed] [Google Scholar]
- [11].Zaphiriou A, Robb S, Murray-Thomas T, et al. The diagnostic accuracy of plasma BNP and NTproBNP in patients referred from primary care with suspected heart failure: results of the UK natriuretic peptide study. Eur J Heart Fail 2005;7:537–41. [DOI] [PubMed] [Google Scholar]
- [12].Fuat A, Murphy JJ, Hungin AP, et al. The diagnostic accuracy and utility of a B-type natriuretic peptide test in a community population of patients with suspected heart failure. Br J Gen Pract 2006;56:327–33. [PMC free article] [PubMed] [Google Scholar]
- [13].Yamamoto K, Burnett JC, Jr, Bermudez EA, et al. Clinical criteria and biochemical markers for the detection of systolic dysfunction. J Card Fail 2000;6:194–200. [DOI] [PubMed] [Google Scholar]
- [14].Cowie MR, Struthers AD, Wood DA, et al. Value of natriuretic peptides in assessment of patients with possible new heart failure in primary care. Lancet 1997;350:1349–53. [DOI] [PubMed] [Google Scholar]
- [15].Krishnaswamy P, Lubien E, Clopton P, et al. Utility of B-natriuretic peptide levels in identifying patients with left ventricular systolic or diastolic dysfunction. Am J Med 2001;111:274–9. [DOI] [PubMed] [Google Scholar]
- [16].Redfield MM, Rodeheffer RJ, Jacobsen SJ, et al. Plasma brain natriuretic peptide concentration: impact of age and gender. J Am Coll Cardiol 2002;40:976–82. [DOI] [PubMed] [Google Scholar]
- [17].Januzzi JL, van Kimmenade R, Lainchbury J, et al. NT-proBNP testing for diagnosis and short-term prognosis in acute destabilized heart failure: an international pooled analysis of 1256 patients: the International Collaborative of NT-proBNP Study. Eur Heart J 2006;27:330–7. [DOI] [PubMed] [Google Scholar]
- [18].Anwaruddin S, Lloyd-Jones DM, Baggish A, et al. Renal function, congestive heart failure, and amino-terminal pro-brain natriuretic peptide measurement: results from the ProBNP Investigation of Dyspnea in the Emergency Department (PRIDE) Study. J Am Coll Cardiol 2006;47:91–7. [DOI] [PubMed] [Google Scholar]
- [19].McCullough PA, Duc P, Omland T, et al. B-type natriuretic peptide and renal function in the diagnosis of heart failure: an analysis from the Breathing Not Properly Multinational Study. Am J Kidney Dis 2003;41:571–9. [DOI] [PubMed] [Google Scholar]
- [20].Maisel A, Mueller C, Adams K, Jr, et al. State of the art: using natriuretic peptide levels in clinical practice. Eur J Heart Fail 2008;10:824–39. [DOI] [PubMed] [Google Scholar]
- [21].Binder L, Pieske B, Olschewski M, et al. N-terminal pro-brain natriuretic peptide or troponin testing followed by echocardiography for risk stratification of acute pulmonary embolism. Circulation 2005;112:1573–9. [DOI] [PubMed] [Google Scholar]
- [22].Gerber IL, Stewart RA, Legget ME, et al. Increased plasma natriuretic peptide levels reflect symptom onset in aortic stenosis. Circulation 2003;107:1884–90. [DOI] [PubMed] [Google Scholar]
- [23].Morello A, Lloyd-Jones DM, Chae CU, et al. Association of atrial fibrillation and amino-terminal pro-brain natriuretic peptide concentrations in dyspneic subjects with and without acute heart failure: results from the ProBNP Investigation of Dyspnea in the Emergency Department (PRIDE) study. Am Heart J 2007;153:90–7. [DOI] [PubMed] [Google Scholar]
- [24].Daniels LB, Clopton P, Bhalla V, et al. How obesity affects the cut-points for B-type natriuretic peptide in the diagnosis of acute heart failure. Results from the Breathing Not Properly Multinational Study. Am Heart J 2006;151:999–1005. [DOI] [PubMed] [Google Scholar]
- [25].Madamanchi C, Alhosaini H, Sumida A, et al. Obesity and natriuretic peptides, BNP and NT-proBNP: mechanisms and diagnostic implications for heart failure. Int J Cardiol 2014;176:611–7. [DOI] [PMC free article] [PubMed] [Google Scholar]
- [26].Boyd AC, Schiller NB, Thomas L. Principles of transthoracic echocardiographic evaluation. Nat Rev Cardiol 2015;12:426–40. [DOI] [PubMed] [Google Scholar]
- [27].Khunti K. Systematic review of open access echocardiography for primary care. Eur J Heart Fail 2004;6:79–83. [DOI] [PubMed] [Google Scholar]
- [28].Silvestry FE, Kerber RE, Brook MM, et al. Echocardiography-guided interventions. J Am Soc Echocardiogr 2009;22:213–31. quiz 316–217. [DOI] [PubMed] [Google Scholar]
- [29].Camm AJ, Lip GY, De Caterina R, et al. 2012 focused update of the ESC Guidelines for the management of atrial fibrillation: an update of the 2010 ESC Guidelines for the management of atrial fibrillation. Developed with the special contribution of the European Heart Rhythm Association. Eur Heart J 2012;33:2719–47. [DOI] [PubMed] [Google Scholar]
- [30].Goff DC, Jr, Lloyd-Jones DM, Bennett G, et al. 2013 ACC/AHA guideline on the assessment of cardiovascular risk: a report of the American College of Cardiology/American Heart Association Task Force on Practice Guidelines. J Am Coll Cardiol 2014;63:2935–59. [DOI] [PMC free article] [PubMed] [Google Scholar]
- [31].American Diabetes Association. Standards of medical care in diabetes: 2013. Diabetes Care 2013;36(suppl 1):S11–66. [DOI] [PMC free article] [PubMed] [Google Scholar]
- [32].Stevens LA, Coresh J, Feldman HI, et al. Evaluation of the modification of diet in renal disease study equation in a large diverse population. J Am Soc Nephrol 2007;18:2749–57. [DOI] [PubMed] [Google Scholar]
- [33].Yeo KT, Wu AH, Apple FS, et al. Multicenter evaluation of the Roche NT-proBNP assay and comparison to the Biosite Triage BNP assay. Clin Chim Acta 2003;338:107–15. [DOI] [PubMed] [Google Scholar]
- [34].Collin-Chavagnac D, Jacques D, Perrin M, et al. [BNP/NT-proBNP: what is the best choice in an emergency laboratory?]. Ann Biol Clin (Paris) 2006;64:275–80. [PubMed] [Google Scholar]


