Abstract
The purpose is to assess the diagnostic ability for early glaucoma of macular ganglion cell–inner plexiform layer (GCIPL) thickness in a Chinese population including glaucoma suspects.
A total of 367 eyes with primary open-angle glaucoma (168 early glaucoma, 78 moderate glaucoma, and 121 advanced glaucoma), 52 eyes with ocular hypertension (OHT), 59 eyes with enlarged cup-to-disc ratio (C/D), and 225 normal eyes were included. GCIPL thickness (average, minimum, superotemporal, superior, superonasal, inferonasal, inferior, and inferotemporal), retinal nerve fiber layer (RNFL) thickness, and optic nerve head (ONH) parameters were measured using Cirrus high-definition optical coherence tomography (OCT) and compared. The diagnostic ability of OCT parameters was assessed by area under receiver operating characteristic curve (AUROC) in 3 distinguishing groups: normal eyes and eyes with early glaucoma, normal eyes and eyes with glaucoma regardless of disease stage, and nonglaucomatous eyes (normal eyes, eyes with OHT, and enlarged C/D) and early glaucomatous eyes.
Glaucomatous eyes showed a significant reduction in GCIPL thickness compared with nonglaucomatous eyes. In all 3 distinguishing groups, best-performing parameters of GCIPL thickness, RNFL thickness, and ONH parameters were minimum GCIPL thickness (expressed in AUROC, 0.899, 0.952, and 0.900, respectively), average RNFL thickness (0.904, 0.953, and 0.892, respectively), and rim area (0.861, 0.925, and 0.824, respectively). There was no statistical significance of AUROC between minimum GCIPL thickness and average RNFL thickness (all P > .05).
GCIPL thickness could discriminate early glaucoma from normal and glaucoma suspects with good sensitivity and specificity. The glaucoma diagnostic ability of GCIPL thickness was comparable to that of RNFL thickness.
Keywords: diagnostic ability, early glaucoma, ganglion cell–inner plexiform layer, glaucoma suspects
1. Introduction
As the leading cause of irreversible blindness worldwide, glaucoma is a chronic, progressive optic neuropathy with a specific pattern of structural and functional damages.[1,2] It is considered as a major public health concern, and its prevalence will probably continue to increase because of demographic expansion and population aging. In 2013, the global prevalence of glaucoma for population aged 40 to 80 years is 3.54%, which is estimated to be 64.3 million people, and that this number will increase to 76 million in 2020 and 111.8 million in 2040.[3] Of these, 74% had primary open-angle glaucoma (POAG).[4] Early diagnosis and appropriate treatment can slow the disease progression and preserve useful vision. The ability to diagnose glaucoma early and detect its progression sensitively is therefore very important for disease management.
Optical coherence tomography (OCT) has been widely used in ophthalmology over the past 2 decades. In clinical practice, OCT allows in vivo quantitative assessment of the peripapillary retinal nerve fiber layer (RNFL) and the optic nerve head (ONH) parameters with precision and good reproducibility, which is proved to be particularly valuable in glaucoma detection, staging, and monitoring. [5,6] Even so, due to reasons such as imaging artifacts and limited coverage of normative database, it is far from perfect as a diagnostic pattern. To date, the diagnosis of glaucoma in very early stages and recognition of its subtle progression are still challenging. On the other hand, misclassification of healthy eyes, high myopic eyes, eyes with enlarged vertical cup-to-disc ratio (C/D) measurements, or eyes with ocular hypertension (OHT) as glaucomatous eyes could be damaging, causing possible lifelong unnecessary treatments, potential adverse effects of intraocular pressure (IOP) lowering therapies, and considerable economic burden to the patients and the healthcare system.[7]
The human retina contains more than 1 million retinal ganglion cells (RGCs), approximately 50% of which are concentrated in the foveal center.[8] Previous studies have confirmed that structural changes of glaucoma primarily affect RGC and their axons.[9,10] Theoretically, it is easier to detect the loss of RGC counts in the macular because of the high density in this region. The development of spectral-domain OCT (SD-OCT) enables the measurement of macular ganglion cell complex (GCC) thickness. Defined as the sum of RNFL, ganglion cell layer (GCL), and inner plexiform layer (IPL) thickness, GCC was proved by several studies that it had a similar glaucoma discriminating performance with RNFL.[11,12] However, the inclusion of RNFL thickness may have a substantial influence on GCC diagnostic performance. The enhanced scanning speed and resolution, along with improved automatic retinal segmentation of OCT ganglion cell analysis (GCA) algorithm (Cirrus Version 6.0; Carl Zeiss Meditec, Dublin, CA), make the measurement of the macular ganglion cell–inner plexiform layer (GCIPL) thickness possible.
While the ability of GCIPL thickness to diagnose glaucomatous eyes from healthy eyes was proved to be comparable to RNFL thickness and ONH parameters,[13–16] its diagnostic performance in subjects including glaucoma suspects is still unknown. In daily clinical scenario, it is challenging, yet crucial to identify OHT and/or eyes with enlarged C/D from real glaucoma. The purpose of the present study was 2-fold: to evaluate the glaucoma diagnostic ability of GCIPL thickness in a Chinese population including glaucoma suspects, and to compare its diagnostic performance for early POAG with other OCT parameters.
2. Methods
2.1. Participants
Participants of this study were consecutively recruited at Zhongshan Ophthalmic Center of Sun Yat-sen University, Guangzhou, China, from February 2013 to March 2015. The study followed the tenets of the Declaration of Helsinki and was approved by the Institutional Review Board (IRB). Written informed consent was obtained from all the participants after an explanation of the nature and possible consequences of the study.
Eligibility was determined via a complete ophthalmologic evaluation including measurement of uncorrected and best-corrected visual acuity, refraction examination, slit lamp biomicroscopy examination, intraocular pressure measurement using a Goldman applanation tonometer, gonioscopy, dilated fundus examination, stereo disc photography (Kowa nonmyd a-D III; Kowa Optimed Inc, Aichi, Japan), Heidelberg Retina Tomograph (Heidelberg Engineering, GmbH, Heidelberg, Germany), visual field testing (Humphrey Visual Field Analyzer II; Carl Zeiss Meditec, Dublin, CA) using the Swedish Interactive Thresholding Algorithm standard 30-2 program, and OCT scanning (Cirrus HD-OCT; Carl Zeiss Meditec, Dublin, CA).
For inclusion, subjects were required to have: age ≥18 years; a spherical equivalent refractive error between −6 diopters (D) to +2 D; normal open anterior chamber angle; macular cube scans and optic disc cube scans (Carl Zeiss Meditec Inc) of good quality, and reliable visual field testing results. Exclusion criteria were: reasons that might prevent successful image acquisition, such as significant media opacities, poor fixation, poor dilation; history of uveitis, vitreoretinal diseases, nonglaucomatous optic neuropathy, or ocular trauma; previous intraocular surgery; medications usage that could possibly induce secondary glaucoma or optic neuropathy; neurological or systemic diseases that could affect retina health and visual field results; any current life-threatening diseases. If both the eyes of a participant met the inclusion criteria, 1 eye was selected randomly for this study.
The diagnosis of glaucoma was based on characteristic glaucomatous structural change to the optic disc and RNFL defects accompanied by glaucomatous visual field defects documented within 6 months of enrollment. Criteria for glaucomatous visual field defect were: glaucoma hemifield test outside normal limits, pattern standard deviation with a P < 5%, or a cluster of >3 points in the pattern deviation plot in a single hemifield (superior or inferior) with a P < 5%, one of which must have a P < 1%. A reliable visual fields test had to have a false-positive error, a false negative error, and a fixation loss of less than 20%, simultaneously. Eyes with a mean deviation (MD) ≥−6 dB, between −6 dB and −12 dB, or <−12 dB were classified as early glaucoma, moderate glaucoma, or advanced glaucoma, respectively. Eyes were diagnosed as POAG when known untreated IOPs were >21 mm Hg.
Ocular hypertension was defined based on the presence of an IOP of >21 mm Hg with normal optic nerve head appearance, normal visual field, and no RNFL defects.
Subjects with enlarged vertical C/D were defined as a vertical cup-to-disc ratio of ≥0.6 with all known untreated IOP of ≤21 mm Hg and normal visual field without RNFL defects.
The appearance of the optic disc on stereoscopic fundus photographs was evaluated independently by 2 glaucoma experts (XX and HX) who were masked to all other information about the eyes, and inconsistencies between these 2 doctors were decided by a third senior glaucoma specialist (XL). If all 3 doctors did not agree on the classification, the eye was not used for further analysis.
Normal subjects had to have at least 1 reliable normal result on standard automated perimetry, normal disc appearance, no RNFL defects, IOP <21 mm Hg with no history of increased IOP, and no family history of glaucoma.
2.2. Optical coherence tomography imaging
OCT data were obtained from qualifying eyes dilated with tropicamide 1% and phenylephrine 2.5% (Mydrin-P, Santen Pharmaceutical Co Ltd, Osaka, Japan) with the same Cirrus HD-OCT device (Cirrus 6.0 software) by a well-trained examiner (XX). At least 3 scans were obtained by Macular Cube 512 × 128 scan protocol (128 horizontal B-scans comprising 512 A-scan per B-scan within a cube measuring 6 × 6 × 2 mm centered at the foveal) and Optic Disc Cube 200 × 200 protocol (200 horizontal B-scans comprising 200 A-scan per B-scan within a cube measuring 6 × 6 × 2 mm centered at optic disc center), respectively, at the same visit. A 5-minute interval between each scan was guaranteed and artificial tear was provided if dryness or dazzle was complained by the participants. Images with signal strength of <6 and those with visible eye motion or blinking artifacts (discontinuous jump) and segmentation failure were considered of poor quality and discarded.
The GCA algorithm was used to process the data obtained by Macular Cube 512 × 128 scan protocol to calculate the thickness of the macular GCIPL within a 14.13 mm2 elliptical annulus area (dimensions: a vertical inner and outer radius of 0.5 and 2.0 mm and a horizontal inner and outer radius of 0.6 and 2.4 mm, respectively) centered on the fovea. The size of the inner ring in the annulus was chosen to exclude the foveal area where the GCL is too thin to detect; the size and shape of the outer ring was selected because it conforms closely to the real anatomy of the normal RGC distribution in macular region. The algorithm identifies the outer boundary of the RNFL and the IPL so that the distance between the RNFL and the IPL outer boundary segmentations yields the combined thickness of the GCL and IPL (termed “GCIPL”). The following GCIPL thickness measurements were analyzed: average, minimum, and sectoral (superior, superonasal, inferonasal, inferior, inferotemporal, and superotemporal). The minimum GCIPL thickness is defined as the minimum measurement of the 1° intervals by sampling 360 spokes extending from the center of the fovea to the edge of the ellipse. Peripapillary RNFL thickness parameters (average RNFL, and superior, temporal, inferior, and nasal quadrant RNFL thicknesses) and ONH parameters (rim area, disc area, and vertical cup-to-disc diameter ratio) were calculated by the Cirrus internal analysis algorithm.
2.3. Statistical analysis
Statistical analyses were performed using SPSS version 20.0 (SPSS Inc, Chicago, IL). The data were analyzed with frequency and descriptive statistics. The Kolmogorov–Smirov test and the Levene test were conducted to test the normality and homogeneity of variance, respectively. The χ2 test was used to evaluate the differences of gender distribution among groups. GCIPL thickness, RNFL thickness, and ONH parameters were compared between groups using analysis of variance (ANOVA). Multiple comparisons with Bonferroni correction were used for pairwise comparison. The glaucoma diagnostic ability of each OCT parameter was determined by the area under the receiver operating characteristic curve (AUROC). The glaucoma diagnostic ability of OCT parameters was assessed in 3 distinguishing groups: normal subjects and patients with early glaucoma (Group 1), normal subjects and patients with glaucoma regardless of disease stage (Group 2), and nonglaucomatous subjects and patients with early glaucoma (Group 3). The AUROC of different variables were compared using MedCalc software version 12.0 (Med-Calc Statistical Software bvba, Mariakerke, Belgium) based on the method of DeLong et al .[17] Optimal operating point (OOP) was calculated using the ROC curve and used as the cut-off value. The correlation between GCIPL thickness, RNFL thickness, and mean deviation of visual field testing was investigated using Spearman rank correlation coefficients. A P value of <.05 was considered statistically significant.
3. Results
A total of 703 participants were enrolled. The participants’ demographic and clinical characteristics were displayed in Table 1. Compared with participants of all glaucoma subgroups and normal controls, patients with OHT and enlarged C/D were significantly younger (P < .001). The visual field MD was of no significant difference between nonglaucomatous groups (normal, OHT, and enlarged C/D), but the difference was statistically significant between each glaucoma subgroups (P < .001).
Table 1.
Demographic and clinical characteristics of the study population.

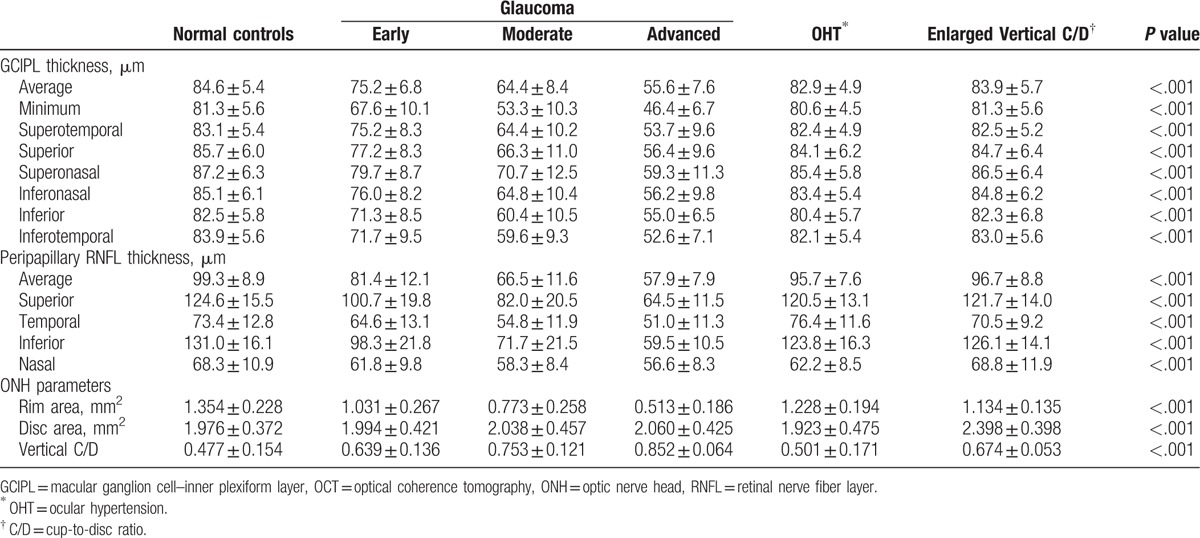
The average, minimum, and sectoral GCIPL thickness, the average and quadrantal RNFL thickness, and ONH parameters of each group were presented in Table 2. Significant differences between each group were found in all parameters (all P < .001).
Table 2.
GCIPL thickness, RNFL thickness, and optic nerve head parameters obtained using Cirrus HD-OCT.
In all the eyes included in this study and in all glaucomatous eyes, the GCIPL parameters showed a significant positive correlation with the visual field MD (all P < .001) and the average RNFL thickness, respectively (all P ≤.005) (Tables 3 and 4). Figure 1 shows an example of GCIP map, RNFL map, and visual field defect of each group, respectively.
Table 3.
Spearman rank correlation coefficients between thickness parameters and visual field mean deviation.
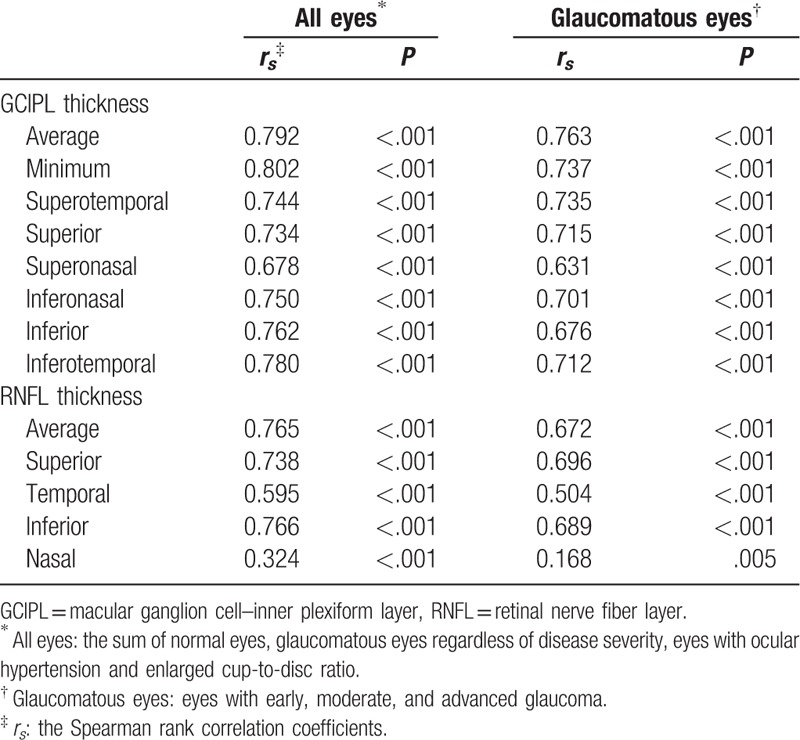
Table 4.
Pearson correlation coefficients between GCIPL thickness parameters and RNFL thickness parameters.
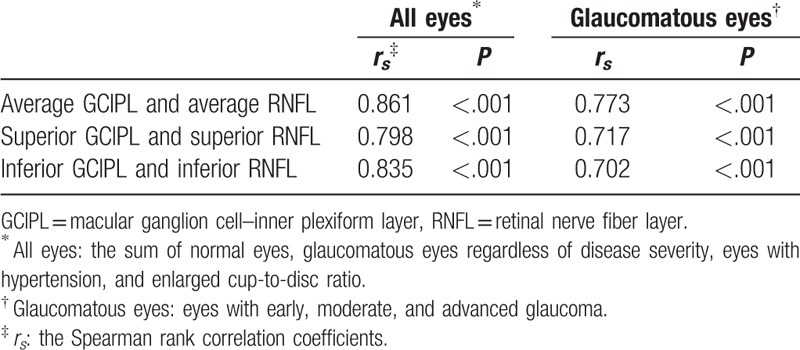
Figure 1.
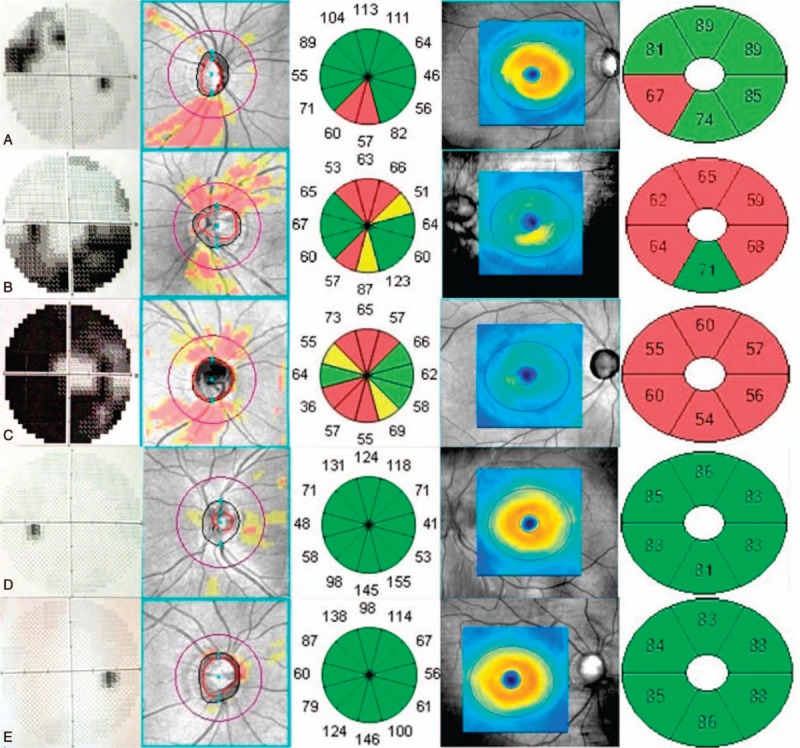
The correspondence of visual field defect, RNFL map, and GCIPL map of each group. A, Early glaucoma. B, Moderate glaucoma. C, Advanced glaucoma. D, Ocular hypertension. E, Enlarged vertical cup-to-disc ratio. In each panel, the overview of visual field greyscale, RNFL deviation map, RNFL thickness in 12 clock-hour sectors, GCIPL thickness map, and GCIPL thickness in 6 sectors were displayed from the left to the right. GCIPL = macular ganglion cell–inner plexiform layer, RNFL = retinal nerve fiber layer.
The AUROC curves and the best cut-off value were summarized in Table 5 and Fig. 2. In all 3 distinguishing groups, minimum GCIPL thickness (expressed in AUROC value, 0.899, 0.952, and 0.900, respectively), average RNFL thickness (0.904, 0.953, and 0.892), and rim area (0.861, 0.925, and 0.824) were parameters with the highest diagnostic ability in GCIPL thickness, RNFL thickness, and ONH parameters, respectively. The average and minimum GCIPL and GCIPL of the inferior hemisphere showed a better diagnostic ability than the GCIPL of the superior hemisphere. There was no statistical significance of AUROC between the minimum GCIPL thickness and the average RNFL thickness in all 3 distinguishing groups (all P > .05). The diagnostic ability of minimum GCIPL thickness was significantly better than that of the rim area in the second and the third distinguishing groups (Table 6).
Table 5.
Area under the receiver operating characteristic curve and optimal operating point in 3 glaucoma distinguishing groups.
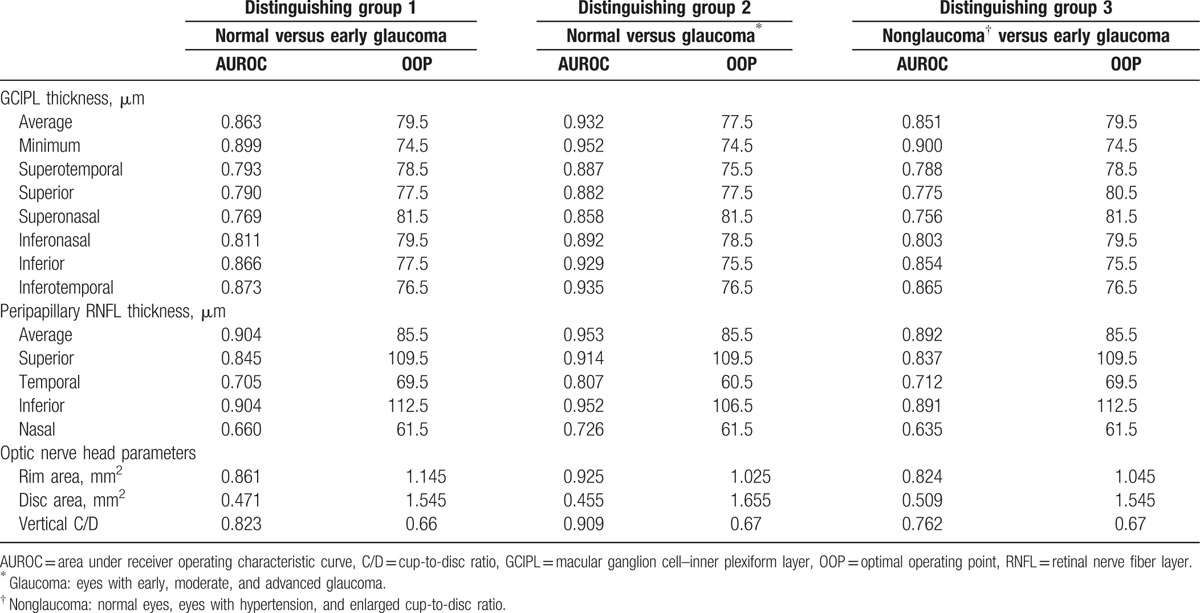
Figure 2.
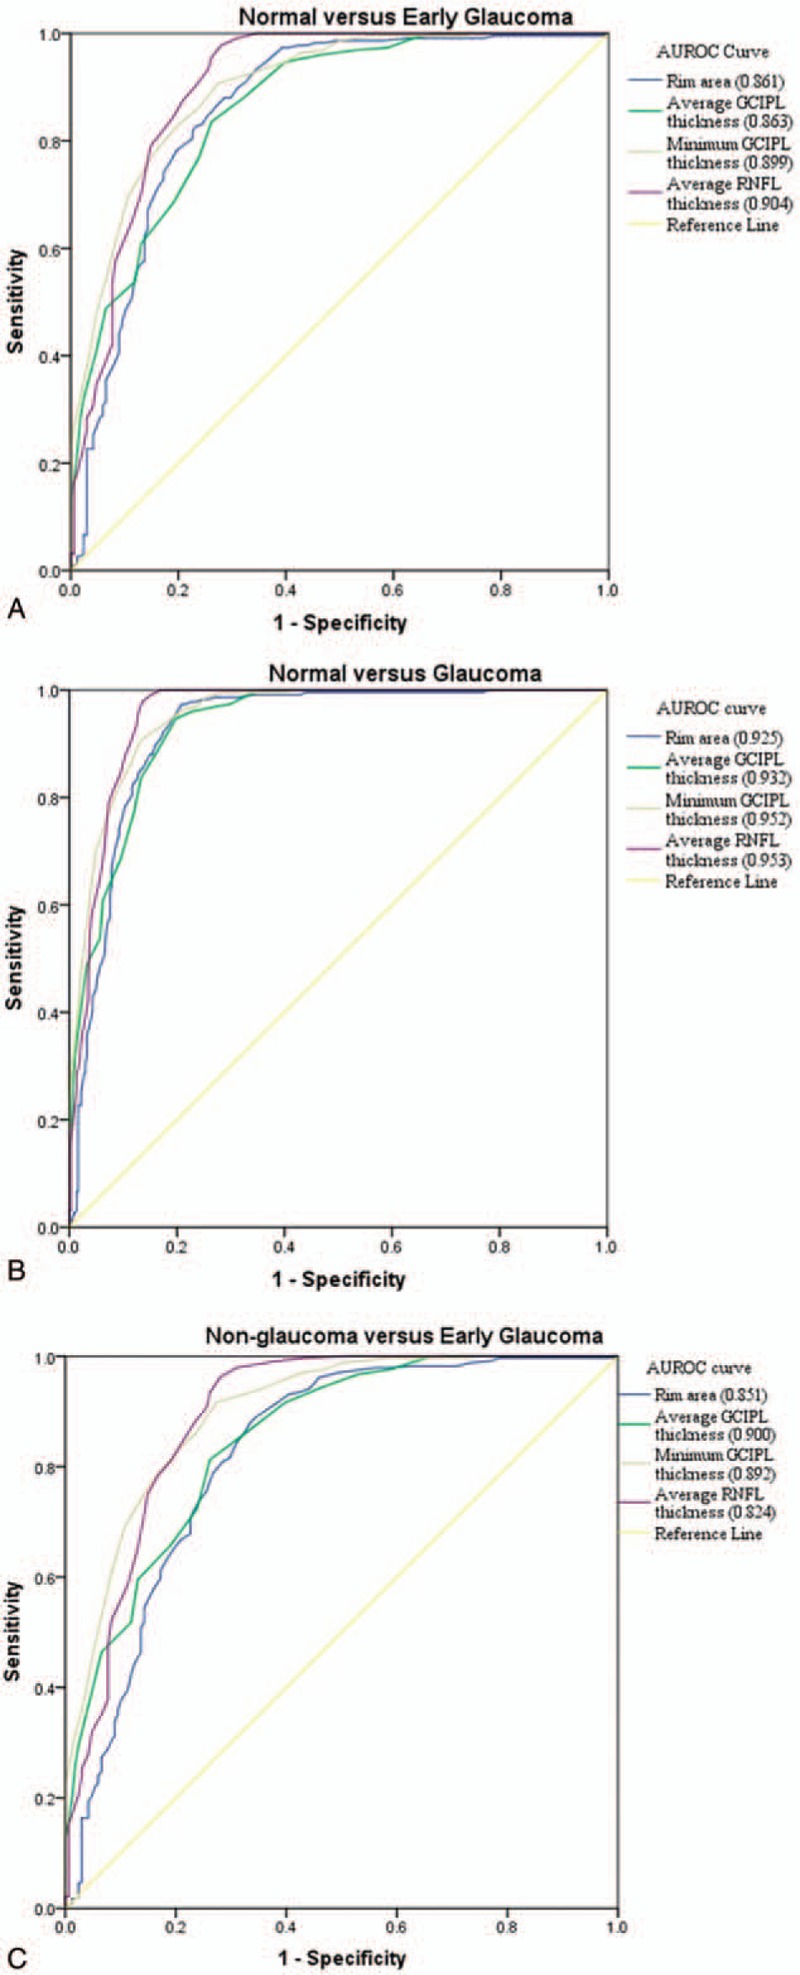
AUROC curves for average GCIPL thickness, minimum GCIPL thickness, average RNFL thickness, and rim area in 3 distinguishing groups. A, Normal subjects and patients with early glaucoma. B, Normal subjects and patients with glaucoma regardless of disease severity. C, Nonglaucomatous subjects and patients with early glaucoma. AUROC = area under receiver operating characteristic curve, GCIPL = macular ganglion cell–inner plexiform layer, RNFL = retinal nerve fiber layer.
Table 6.
Comparisons of area under the receiver operating characteristic curve in 3 glaucoma distinguishing groups.

4. Discussion
Early and accurate diagnosis is essential for glaucoma control and patient management. To date, it is still challenging because the structural changes and functional deficit may not be detectable in very early stage. It is more complicated in clinical scenario when possible confounding factors like glaucoma suspects are mixed. Misdiagnosis may result in missing the timing of treatment or unnecessary treatment which is potentially harmful and expensive. Generally, our study confirmed that GCIPL thickness could well discriminate early glaucoma from normal and glaucoma suspects, and its glaucoma diagnostic performance was comparable to that of the best RNFL and ONH parameters.
In previous studies, the diagnostic ability of GCC (sum of macular RNFL and GCIPL thickness) was generally lower than that of RNFL thickness.[11,12,18–24] However, the glaucoma diagnostic ability of GCIPL thickness was noninferior to that of RNFL parameters by multi-investments.[13–16] There are several possible advantages of GCIPL in glaucoma discriminating performance over GCC: a 14.13 mm2 elliptical annulus area centered on the fovea is selected for GCIPL thickness analyses in GCA algorithm because it conforms closely to the normal RGC distribution in macular region.[16] The GCC algorithm explores the combination of GCIPL and RNFL thickness within a circle of 6 mm diameter and 28.27 mm2, whose center is shifted 1 mm temporal to the fovea to improve the sampling of temporal peripheral nerve fibers.[25] The parameters generated by the GCC algorithm included the average, superior, and inferior hemisphere GCC thickness. Glaucomatous RGC loss is limited to a local area especially at its earlier stages. Since the area GCC algorithm explores is twice that of the GCA algorithm, it is likely to underestimate the local RGC loss by averaging thickness where the RGC population is sparse or less affected by glaucoma. Higher image resolution and improvement in automatic segmentation algorithm allow demarcation and elimination of macular RNFL from GCL and IPL, which can reflect the status of RGC more precisely. The GCA algorithm calculates the mean GCIPL thickness by 1° interval of the 360 spokes of the elliptical annulus using data set from 50 to 60 sampling points. The lowest GCIPL thickness among the 360 spokes (termed minimum GCIPL) was supposed to indicate the location where local RGC loss is the most severe. It can theoretically minimize the averaging effect with unaffected or less affected areas, given that the RGCs are spatially and sequentially unevenly affected by glaucoma. In addition to the diffuse loss of RGC, the focal RGC loss was believed to account for clinical patterns of visual loss caused by glaucoma.[26,27] Detecting the minor area initially affected by glaucoma is therefore more sensitive and more precise than averaging the GCIPL thickness with equal weights in larger areas. It is possible that future updated software may generate exact location of the minimum GCIPL thickness, which may benefit in clarifying the pathological mechanisms of early glaucomatous damage in vivo.
We found that the parameter with the best diagnostic ability was minimum GCIPL thickness, followed by inferotemporal, inferior, and average GCIPL thickness, which was consistent with previous studies.[13,16,28] In 58 glaucomatous and 48 healthy eyes from Japanese subjects, Takayama et al[16] reported that the AUROC of minimum GCIPL thickness was significantly higher than average GCIPL thickness in discriminating early glaucoma from normal eyes, and comparable to average GCIPL thickness in discriminating advanced glaucoma from normal eyes; besides, the AUROC of minimum GCIPL thickness and average RNFL thickness were of no statistic differences. Mwanza et al[13] studied the diagnostic performance of OCT parameters in 58 eyes with early POAG and 99 normal eyes and found that the GCIPL parameter with the best AUROC was the minimum GCIPL thickness. There were no significant differences in diagnostic performance between minimum, inferotemporal, average, superotemporal, and inferior GCIPL thickness with those of inferior, average, and superior RNFL, and ONH parameters. However, glaucoma suspects like OHT and enlarged C/D were not included, and not all glaucoma stages were enrolled in these studies. In our study, glaucoma suspects that were less differential with early glaucoma were included and we found that the minimum GCIPL thickness was the OCT parameter with the highest diagnostic ability, suggesting that it qualified an alternative parameter in clinical diagnosis and monitoring of glaucoma.
The diagnostic performance of all GCIPL thickness parameters in our study was very close in discriminating early glaucoma from nonglaucoma (normal eyes and eyes with OHT and enlarged C/D), and in discriminating early glaucoma from normal eyes. In contrast the diagnostic performance of all RNFL thicknesses and ONH parameters were more variable in these discriminations. This may represent a creditable reliability and stability with good specificity as well as sensitivity of GCIPL thickness parameters. However, it is important to note that vitreoretinal comorbidity disorders such as diabetes retinopathy, diabetes macular edema, age-related macular degeneration, epiretinal membrane, macular hole, retinal vascular occlusive diseases are respectively common in elderly adults who are more susceptible to glaucoma, which limits the clinical usefulness of the macular GCIPL thickness parameters because of lack of reliability or imaging failure in these patients.
In our study, the GCIPL parameters showed a significant positive correlation with visual field MD and RNFL parameters in corresponding positions, which was in consistence with histopathology findings that glaucoma initially damaged macular RGCs, while their axons concentrated in peripapillary areas.[13,29,30] Interestingly, we noticed that a higher correlation was found between GCIPL thickness and visual field mean deviation than that between RNFL thickness and mean deviation, no matter in glaucoma eyes, or in eyes with and without glaucoma, which was opposite to the results of GCC parameters reported by Cho et al.[31] We suspect that there are 2 main reasons: as above-mentioned superiority of GCA algorithm over GCC algorithm, the refined analyzing area and layer of GCA may indicate RGC loss more sensitively. Glaucomatous visual field defect starts from peripheral and affects the center gradually as disease progresses to advanced stage. RNFL thickness in eyes with very advanced glaucoma, however, may no longer decrease in a linear fashion or even stop changing, as known as the “floor effect.”[32] The delicate visual function in advanced glaucoma patients demands stricter IOP control. If glaucoma is progressing, but progressive RNFL changes are undetectable due to the floor effect, an illusion of satisfactory disease management may mislead both doctors and patients to raise the target IOP, resulting in potential irreversible visual function worsening. Theoretically, RGCs have not yet died out as central visual field preserves. Measuring macular GCIPL thickness may help to better reveal the process of RGC loss associated with visual field defect worsening, which is crucial in patient managing and vision saving.
There were limitations of this study. First, our OHT patients and subjects with enlarged C/D were significantly younger than glaucoma patients with different severity groups and normal controls. We used age-adjusted AUROC curves for the investigation of diagnostic ability of OCT parameters. Second, though lacking the evidence of being preperimetric glaucoma at the time of enrollment (normal optic nerve head appearance, normal visual field, and no RNFL defects), the subjects defined as OHT and enlarged vertical C/D in our study might develop real glaucoma after years of follow-up, making the conclusions of this study less convincing. This is a limitation of most cross-sectional study. More prospective studies are expected in further investigations. Third, the classification system based on visual field mean deviation was likely to mix preperimetric glaucoma and early-to-moderate glaucoma which was not early enough. Preperimetric glaucoma was not enrolled as a separate group was a possible reason why the diagnostic abilities of GCIPL and RNFL thickness were similar, despite that the ganglion cell body and the axon may not be affected simultaneously.
In conclusion, thinning of macular GCIPL thickness is closely corresponding to the progression of glaucoma. Macular GCIPL thickness parameters, especially the minimum GCIPL thickness, could discriminate early glaucoma from normal and glaucoma suspects with good sensitivity and specificity. The glaucoma diagnostic ability of GCIPL thickness was as good as that of RNFL thickness. Most of the results presented in this manuscript have been reported previously; this manuscript, with a larger population, confirms these findings. Cirrus HD-OCT GCIPL thickness could be used as an effective, reliable, quantizable tool for glaucoma detection and monitoring. In future researches, a platform with an integration of GCIPL thickness, RNFL thickness, ONH parameters, and visual field defects may be beneficial in increasing the ability of earlier glaucoma detection and better glaucoma monitoring.
Footnotes
Abbreviations: ANOVA = analysis of variance, AUROC = area under receiver operating characteristic curve, C/D = cup-to-disc ratio, GCA = ganglion cell analysis, GCC = ganglion cell complex, GCIPL = macular ganglion cell–inner plexiform layer, GCL = ganglion cell layer, IOP = intraocular pressure, IPL = inner plexiform layer, IRB = institutional review board, MD = mean deviation, OCT = optical coherence tomography, OHT = ocular hypertension, ONH = optic nerve head, OOP = optimal operating point, POAG = primary open-angle glaucoma, RGCs = retinal ganglion cells, RNFL = retinal nerve fiber layer, SD-OCT = spectral-domain optical coherence tomography.
XX, HX, XG, XC, LH, JL, and XL reported no financial disclosures.
This project was supported by Medical Scientific Research Foundation of Guangdong Province, China (A2016094); Fundamental Research Funds of the State Key Laboratory of Ophthalmology, China (2017QN05 and 2012HBPI04); Sun Yat-Sen University Clinical Research 5010 Program (2014016).
The authors have no conflicts of interest to disclose.
References
- [1].Wilson MR, Lee PP, Weinreb RN, et al. A panel assessment of glaucoma management: modification of existing RAND-like methodology for consensus in ophthalmology. Part I: methodology and design. Am J Ophthalmol 2008;145:570–4. [DOI] [PubMed] [Google Scholar]
- [2].Cook C, Foster P. Epidemiology of glaucoma: what's new? Can J Ophthalmol 2012;47:223–6. [DOI] [PubMed] [Google Scholar]
- [3].Tham YC, Li X, Wong TY, et al. Global prevalence of glaucoma and projections of glaucoma burden through 2040: a systematic review and meta-analysis. Ophthalmology 2014;121:2081–90. [DOI] [PubMed] [Google Scholar]
- [4].Varma R, Lee PP, Goldberg I, et al. An assessment of the health and economic burdens of glaucoma. Am J Ophthalmol 2011;152:515–22. [DOI] [PMC free article] [PubMed] [Google Scholar]
- [5].Medeiros FA, Zangwill LM, Bowd C, et al. Evaluation of retinal nerve fiber layer, optic nerve head, and macular thickness measurements for glaucoma detection using optical coherence tomography. Am J Ophthalmol 2005;139:44–55. [DOI] [PubMed] [Google Scholar]
- [6].Leung CK, Chan WM, Yung WH, et al. Comparison of macular and peripapillary measurements for the detection of glaucoma: an optical coherence tomography study. Ophthalmology 2005;112:391–400. [DOI] [PubMed] [Google Scholar]
- [7].Chong GT, Lee RK. Glaucoma versus red disease: imaging and glaucoma diagnosis. Curr Opin Ophthalmol 2012;23:79–88. [DOI] [PubMed] [Google Scholar]
- [8].Agudo-Barriuso M, Villegas-Perez MP, de Imperial JM, et al. Anatomical and functional damage in experimental glaucoma. Curr Opin Pharmacol 2013;13:5–11. [DOI] [PubMed] [Google Scholar]
- [9].Medeiros FA, Lisboa R, Weinreb RN, et al. Retinal ganglion cell count estimates associated with early development of visual field defects in glaucoma. Ophthalmology 2013;120:736–44. [DOI] [PMC free article] [PubMed] [Google Scholar]
- [10].Medeiros FA, Zangwill LM, Bowd C, et al. The structure and function relationship in glaucoma: implications for detection of progression and measurement of rates of change. Invest Ophthalmol Vis Sci 2012;53:6939–46. [DOI] [PMC free article] [PubMed] [Google Scholar]
- [11].Schulze A, Lamparter J, Pfeiffer N, et al. Diagnostic ability of retinal ganglion cell complex, retinal nerve fiber layer, and optic nerve head measurements by Fourier-domain optical coherence tomography. Graefes Arch Clin Exp Ophthalmol 2011;249:1039–45. [DOI] [PubMed] [Google Scholar]
- [12].Kim NR, Lee ES, Seong GJ, et al. Comparing the ganglion cell complex and retinal nerve fibre layer measurements by Fourier domain OCT to detect glaucoma in high myopia. Br J Ophthalmol 2011;95:1115–21. [DOI] [PubMed] [Google Scholar]
- [13].Mwanza JC, Durbin MK, Budenz DL, et al. Glaucoma diagnostic accuracy of ganglion cell-inner plexiform layer thickness: comparison with nerve fiber layer and optic nerve head. Ophthalmology 2012;119:1151–8. [DOI] [PubMed] [Google Scholar]
- [14].Mwanza JC, Budenz DL, Godfrey DG, et al. Diagnostic performance of optical coherence tomography ganglion cell—inner plexiform layer thickness measurements in early glaucoma. Ophthalmology 2014;121:849–54. [DOI] [PubMed] [Google Scholar]
- [15].Oddone F, Lucenteforte E, Michelessi M, et al. Macular versus retinal nerve fiber layer parameters for diagnosing manifest glaucoma: a systematic review of diagnostic accuracy Studies. Ophthalmology 2016;123:939–49. [DOI] [PubMed] [Google Scholar]
- [16].Takayama K, Hangai M, Durbin M, et al. A novel method to detect local ganglion cell loss in early glaucoma using spectral-domain optical coherence tomography. Invest Ophthalmol Vis Sci 2012;53:6904–13. [DOI] [PubMed] [Google Scholar]
- [17].DeLong ER, DeLong DM, Clarke-Pearson DL. Comparing the areas under two or more correlated receiver operating characteristic curves: a nonparametric approach. Biometrics 1988;44:837–45. [PubMed] [Google Scholar]
- [18].Garas A, Kothy P, Hollo G. Accuracy of the RTVue-100 Fourier-domain optical coherence tomograph in an optic neuropathy screening trial. Int Ophthalmol 2011;31:175–82. [DOI] [PubMed] [Google Scholar]
- [19].Sevim MS, Buttanri B, Acar BT, et al. Ability of Fourier-domain optical coherence tomography to detect retinal ganglion cell complex atrophy in glaucoma patients. J Glaucoma 2013;22:542–9. [DOI] [PubMed] [Google Scholar]
- [20].Na JH, Lee K, Lee JR, et al. Detection of macular ganglion cell loss in preperimetric glaucoma patients with localized retinal nerve fiber defects by spectral-domain optical coherence tomography. Clin Experiment Ophthalmol 2013;41:870–80. [DOI] [PubMed] [Google Scholar]
- [21].Chen J, Huang H, Wang M, et al. Fourier domain OCT measurement of macular, macular ganglion cell complex, and peripapillary RNFL thickness in glaucomatous Chinese eyes. Eur J Ophthalmol 2012;22:972–9. [DOI] [PubMed] [Google Scholar]
- [22].Tan O, Chopra V, Lu AT, et al. Detection of macular ganglion cell loss in glaucoma by Fourier-domain optical coherence tomography. Ophthalmology 2009;116:2305–14. [DOI] [PMC free article] [PubMed] [Google Scholar]
- [23].Kim NR, Lee ES, Seong GJ, et al. Structure-function relationship and diagnostic value of macular ganglion cell complex measurement using Fourier-domain OCT in glaucoma. Invest Ophthalmol Vis Sci 2010;51:4646–51. [DOI] [PubMed] [Google Scholar]
- [24].Fang Y, Pan YZ, Li M, et al. Diagnostic capability of Fourier-Domain optical coherence tomography in early primary open angle glaucoma. Chin Med J (Engl) 2010;123:2045–50. [PubMed] [Google Scholar]
- [25].Akashi A, Kanamori A, Nakamura M, et al. Comparative assessment for the ability of Cirrus, RTVue, and 3D-OCT to diagnose glaucoma. Invest Ophthalmol Vis Sci 2013;54:4478–84. [DOI] [PubMed] [Google Scholar]
- [26].Lei Y, Garrahan N, Hermann B, et al. Topography of neuron loss in the retinal ganglion cell layer in human glaucoma. Br J Ophthalmol 2009;93:1676–9. [DOI] [PMC free article] [PubMed] [Google Scholar]
- [27].Ohkubo S, Higashide T, Udagawa S, et al. Focal relationship between structure and function within the central 10 degrees in glaucoma. Invest Ophthalmol Vis Sci 2014;55:5269–77. [DOI] [PubMed] [Google Scholar]
- [28].Nouri-Mahdavi K, Nowroozizadeh S, Nassiri N, et al. Macular ganglion cell/inner plexiform layer measurements by spectral domain optical coherence tomography for detection of early glaucoma and comparison to retinal nerve fiber layer measurements. Am J Ophthalmol 2013;156:1297.e2–307.e2. [DOI] [PMC free article] [PubMed] [Google Scholar]
- [29].Ishikawa H, Stein DM, Wollstein G, et al. Macular segmentation with optical coherence tomography. Invest Ophthalmol Vis Sci 2005;46:2012–7. [DOI] [PMC free article] [PubMed] [Google Scholar]
- [30].Tan O, Li G, Lu AT, et al. Mapping of macular substructures with optical coherence tomography for glaucoma diagnosis. Ophthalmology 2008;115:949–56. [DOI] [PMC free article] [PubMed] [Google Scholar]
- [31].Cho HK, Kee C. Population-based glaucoma prevalence studies in Asians. Surv Ophthalmol 2014;59:434–47. [DOI] [PubMed] [Google Scholar]
- [32].Ye C, Lam DS, Leung CK. Investigation of floor effect for OCT RNFL measurement. Investig Ophthalmol Vis Sci 2011;52:176–176. [DOI] [PubMed] [Google Scholar]


