Abstract
Cholescintigraphy has traditionally been used as a tool to select patients with biliary pain for elective cholecystectomy. However, atypical biliary pain presents a clinical challenge and there is no literature evaluating the factors of the gallbladder (GB) wall related to abnormal ejection fraction of cholescintigraphy in such patients. Therefore, we aimed to evaluate characteristics of the GB wall in patients with abnormal gallbladder ejection fraction (GBEF) on cholescintigraphy and atypical biliary pain. Patients who underwent cholescintigraphy for atypical biliary pain and subsequent cholecystectomy were initially recruited for this study. Medical records and pathologic findings of these patients were retrospectively reviewed. Parameters that were significant on univariate analysis, including factors of GB wall and cholescintigraphy, were subsequently tested by multivariate analysis to identify independent predictors for abnormal GBEF. Abnormal or low GBEF was defined as GBEF <35%. A total of 41 adult patients were divided into a low GBEF (n = 15) and a high GBEF group (n = 26) based on the cutoff value of 35%. In univariate analysis mean muscle thickness, muscle to total layer ratio, and muscle to fibrosis layer ratio were significantly higher in the low GBEF group than in the high GBEF group. In multivariate analysis, the muscle to fibrosis layer ratio was found to be an independent risk factor for abnormal GBEF (odds ratio = 3.514, 95% confidence interval = 1.058–11.673, P = .04). The fibrosis to total layer ratio was negatively correlated with GBEF in the low GBEF group (r = −0.657, P < .01). Muscle to fibrosis layer ratio was significantly associated with decreased GBEF. The fibrosis thickness ratio also seems to play an important role in patients with decreased GBEF.
Keywords: biliary pain, cholescintigraphy, ejection fraction, gallbladder
1. Introduction
Verifying abdominal pain caused by biliary origin is very difficult and atypical biliary pain presents an even more challenging problem. In clinical practice, deciding therapeutic and diagnostic strategies for atypical biliary pain often presents problems. Cholescintigraphy is one of the principal imaging techniques for detecting cystic duct obstruction and provides information on hepatic function and bile duct patency as well as gallbladder (GB) contractility. The nonvisualization of GB with associated normal biliary to bowel transit is suggestive of acute cholecystitis.[1] Among the measurements acquired by cholescintigraphy, the gallbladder ejection fraction (GBEF) is useful in assessing GB function. However, although cholescintigraphy has been used as a tool to select patients with biliary pain for elective cholecystectomy and most studies report the utility of GBEF in predicting symptom outcome after cholecystectomy in patients with suspected chronic acalculous GB dysfunction, this remains a controversial issue.[2] Several reports have suggested that a low GBEF is predictive of histologic chronic cholecystitis in patients with chronic acalculous GB disease.[3–6] Although some studies reported on the correlation between GBEF and histopathologic changes,[7,8] the definite pathophysiology of low GBEF is not fully understood. In particular, the factors affecting an abnormal GBEF in a situation with mild chronic cholecystitis have not been fully evaluated. Furthermore, there is no literature on the evaluation of GB wall factors related to abnormal GBEF. Therefore, the purpose of this study was to evaluate GB wall factors associated with abnormal GBEF in patients with atypical biliary pain.
2. Patients and methods
2.1. Study population
Between April 2009 and April 2013, patients who underwent cholescintigraphy for atypical biliary pain and subsequent cholecystectomy at Kyung Hee University Hospital at Gangdong in Seoul, Korea, were initially recruited for this study and medical records and histopathologic findings of these patients were retrospectively reviewed. Atypical biliary pain was defined as cases where the suspicious biliary pain did not fully meet the ROME II criteria; episodes of severe steady pain located in the epigastrium and right upper quadrant; and all of the following: episodes lasting 30 minutes or more; symptoms occurring on at least 1 occasion in the previous 12 months; steady pain that interrupts daily activities or requires consultation with a physician; no evidence of structural abnormalities to explain the symptoms; and abnormal GB function with regard to emptying.[9] Patients meeting any of the following criteria were excluded from the study: abnormal radiologic findings of GB such as acute cholecystitis; elevated hepatic enzymes; nonvisualization of GB on cholescintigraphy; insufficient specimen due to tangential section of GB; regular use of prokinetics or antispasmodics; and insufficient medical records. Written informed consent was obtained from each subject and in accordance with the Declaration of Helsinki (1989) of the World Medical Association (KHNMC IRB2015-01-009).
2.2. Histopathology: measuring gallbladder muscle layer thickness
The gall bladder was fixed in formalin, embedded in paraffin, and 5-μm sections were sliced perpendicularly to the GB wall to give a donut-shaped slice with full wall circumference that was stained with Masson trichrome staining for microscopic examination of the fibrosis layer. An investigator who was blinded to clinical data performed section processing and analysis. Forty magnification fields were analyzed per section. Figure 1 shows a typical example of the microscopic features. Total wall thickness was defined as the thickness between the lamina propria and subserosal fat layer. The total layer, consisting of muscle and fibrosis, was measured at 5 different sites sliced in the most vertical plane and the mean value was calculated from these measurements. The muscle layer and the fibrosis layer were expressed as percentages of the thickness of the total wall layer. The muscle to fibrosis ratio was calculated as the thickness of the muscle layer divided by the thickness of the fibrosis layer. One pathologist who blinded to all clinical information examined the histologic sections. The reviewer also scored the intensity of inflammation from 0 to 3 (0: absent; 1: mild; 2: moderate; 3: severe) according to the degree of inflammatory cell infiltration.
Figure 1.
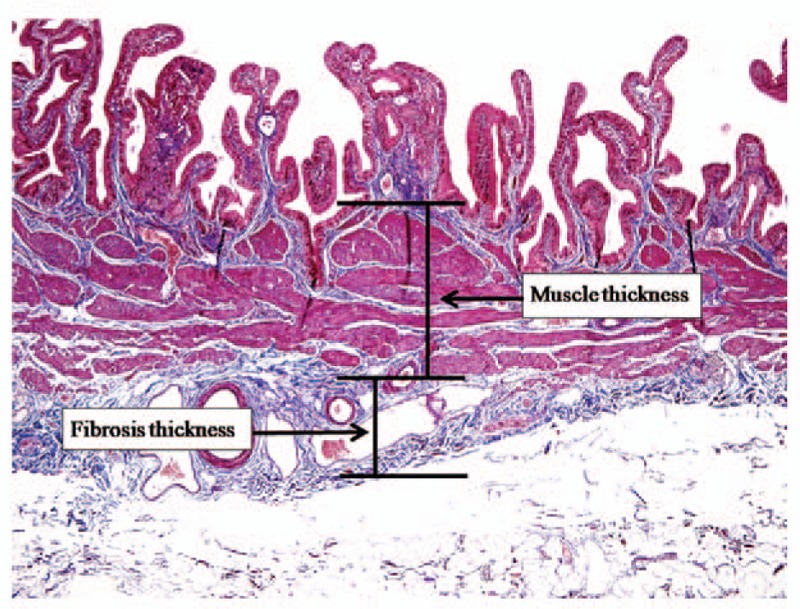
Measuring gallbladder (GB) wall thickness. The total thickness of the GB wall consisting of muscle and fibrosis layers was defined as the distance between the lamina propria and subserosal fat layer.
2.3. Cholescintigraphy: image acquisition
All patients underwent Tc-99m mebrofenin cholescintigraphy after a minimum of 4 to 6 hours of fasting. The patients received 185 MBq of Tc-99m mebrofenin intravenously while lying supine under a large-field gamma camera fitted with a low-energy, all-purpose, parallel-hole collimator (Forte, Phillips, Milpitas, CA). Data acquisition was carried out in 2 phases. A quantitative biliary dynamic technique was used in the first phase for the measurement of relative hepatic bile flow.[10] Anterior dynamic images of the abdomen were acquired at 1 frame/min for 60 minutes in a 64 × 64 matrix. After completion of the first phase, anterior static images of the abdomen were acquired for 5 minutes every 30 minutes for 1.5 hours.[11] All patients were given 2 fried eggs with 200 mL of milk at the time when the GB was distended, which was usually at 1.5 hours. Static images were then acquired at 30 minutes after ingestion to record the response to fatty meal stimulation. Delayed images were acquired until 4 hours, when GB activity was not visible.
2.4. Cholescintigraphy: image analysis
A time-activity curve was generated for the liver and GB for the entire 60 minutes of the first phase of data acquisition. The region of interest (ROI) for the liver was drawn manually using the images of the previous 30 minutes to exclude any GB activity or bile duct activity. The ROI for the GB was drawn using images acquired when the GB activity was the most widely visualized. Tmax (½) of hepatic clearance, derived from the time-activity curve for the liver was defined as the time (min) during which the maximum hepatic uptake decreased by 50%. The filling rate of the GB, derived from the time-activity curve for the GB, was defined as the change in GB activity according to time (Fig. 2). GBEF was calculated from the GB counts obtained from the immediate pre-meal data and the postmeal data (Fig. 3) using the formula: GBEF (%) = [(premeal GB counts) – (postmeal GB counts)]/(premeal GB counts) × 100.
Figure 2.

The region of interest (ROI) curve. A, The ROI for the liver was drawn manually using the images of the previous 30 minutes to exclude any gallbladder (GB) activity or bile duct activity. B, The ROI for the GB was drawn using images acquired when the GB activity was the most widely visualized.
Figure 3.
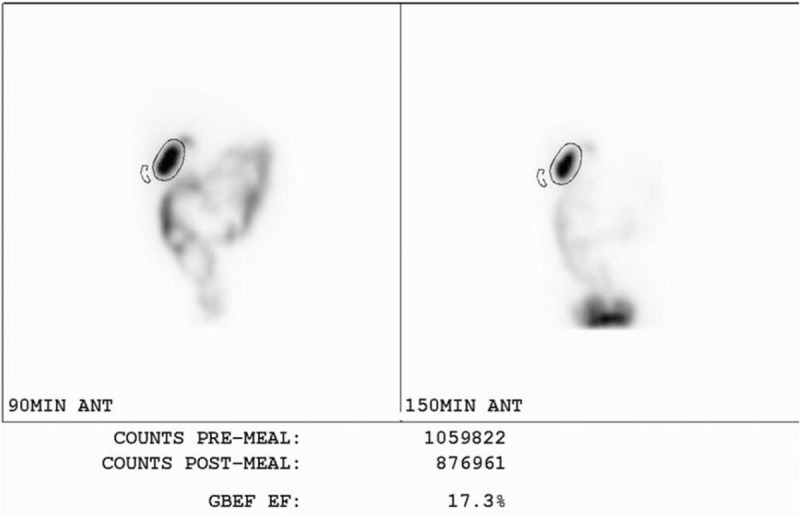
Calculation of GBEF. GBEF was calculated from gallbladder (GB) counts obtained from the immediate pre-meal data and the post-meal data using the formula: GBEF (%) = [(premeal GB counts) – (postmeal GB counts)]/(premeal GB counts) × 100. GBEF = gallbladder ejection fraction.
Abnormal or low GBEF was defined as GBEF <35%.[12] All cholescintigraphy data were interpreted by 1 expert in nuclear medicine who was blinded to the clinical manifestation of the patients. Normal hepatic uptake was defined as concentration of the tracer in the liver with none in the cardiac blood pool at 5 minutes. Normal common bile duct (CBD) activity was defined as activity normally seen in the CBD within 30 minutes. Timely duodenal activity was defined as appearance of activity in the bowel within 60 minutes. Delayed GB filling was defined as lack of GB activity within 60 minutes.[1,13] Duodenogastric reflux was defined as retrograde movement of radioactivity from the duodenum into the stomach.
2.5. Statistical analysis
The primary outcome was to determine factors associated with abnormal GBEF. For numerical variables, the results are expressed as the mean ± standard deviation. Qualitative variables are shown as percentages. For intergroup comparisons, continuous variables were analyzed using the Student t test or univariate analysis, and categorical variables were analyzed using the χ2 test. We computed odds ratio (OR) and 95% confidence interval (95% CI) using logistic regression analysis. Variables with a P value <.05 on univariate analysis were subsequently included in a multivariate logistic regression analysis to identify independent predictors for abnormal GBEF on cholescintigraphy. A P value <.05 was considered statistically significant. Spearman correlation analysis was performed for correlation of the GBEF with the degree of GB wall fibrosis. Statistical analysis was carried out using SPSS 13.0 (SPSS, Chicago, IL).
3. Results
3.1. Baseline characteristics of the study population
In total, 60 adult patients underwent both cholescintigraphy and cholecystectomy. Nineteen patients were excluded from analysis for the following reasons: nonvisualization of GB (n = 16), tangential section of GB (n = 1), or elevated liver enzymes (n = 2). Therefore, 41 patients were ultimately enrolled in this study and were divided into a low GBEF group (n = 15) and a high GBEF group (n = 26) according to the cutoff value of 35% (Fig. 4).
Figure 4.
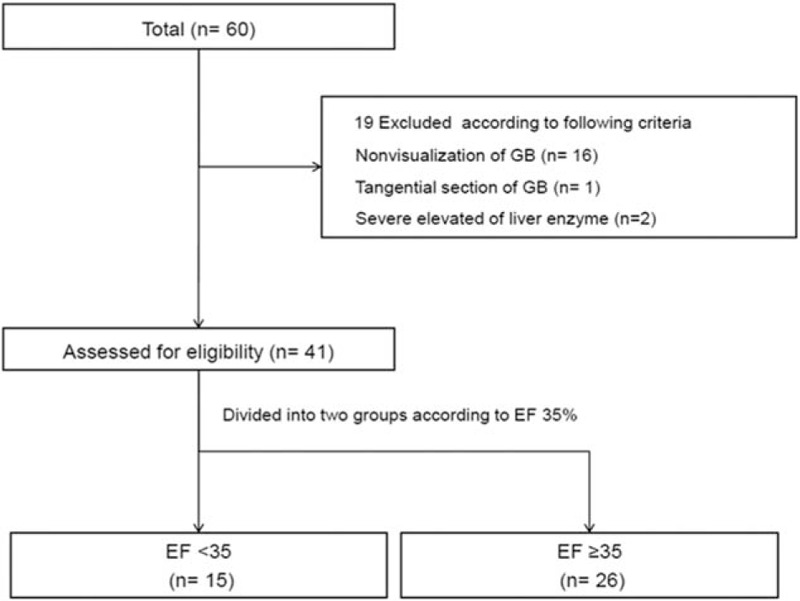
Flow chart of the study population and study design.
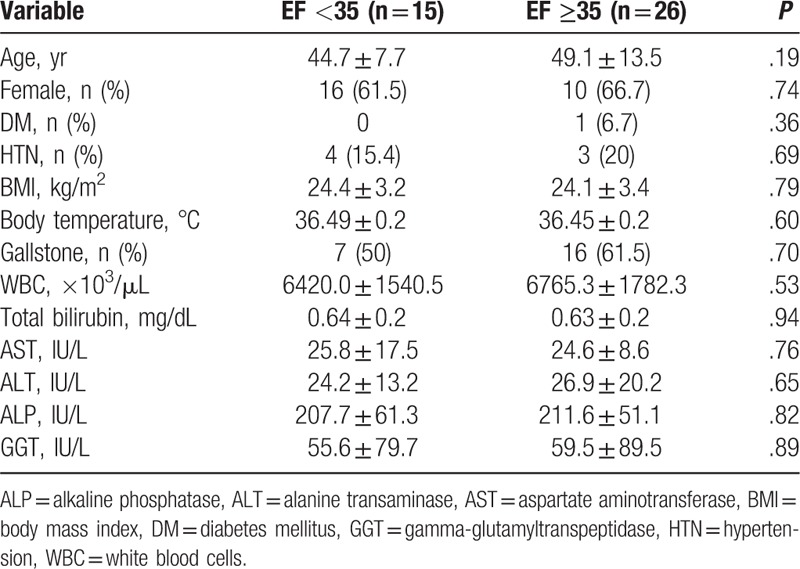
Table 1 summarizes baseline characteristics of the low GBEF group and high GBEF group. The mean age of the study groups was 44.7 ± 7.7 years in the low GBEF group and 49.1 ± 13.5 years in the high GBEF group (P = 0.195). There was no significant difference between the low GBEF group and high GBEF group in other variables, including sex ratio, diabetes mellitus, hypertension, body mass index, body temperature, white blood cell count, total bilirubin, aspartate aminotransferase, alanine transaminase, alkaline phosphatase, gamma-glutamyl transpeptidase, or presence of gallstone.
Table 1.
Baseline characteristics of the study participants according to gallbladder ejection fraction cutoff of 35%.
3.2. Comparison of histopathology
A baseline underlying histopathologic feature of all participants was mild chronic cholecystitis (score 1). Mean muscle thickness (521.7 ± 259.8 vs 366.8 ± 185.3, P = .03), mean muscle to total layer ratio (0.54 ± 0.12 vs 0.45 ± 0.13, P = .03), and mean muscle to fibrosis ratio (1.35 ± 0.72 vs 0.92 ± 0.49, P = .02) were significantly higher in the low GBEF group than in the high GBEF group (Table 2).
Table 2.
Histopathologic characteristics of the gallbladder wall layer according to gallbladder ejection fraction groups.

3.3. Comparison of hepatobiliary scintigraphy
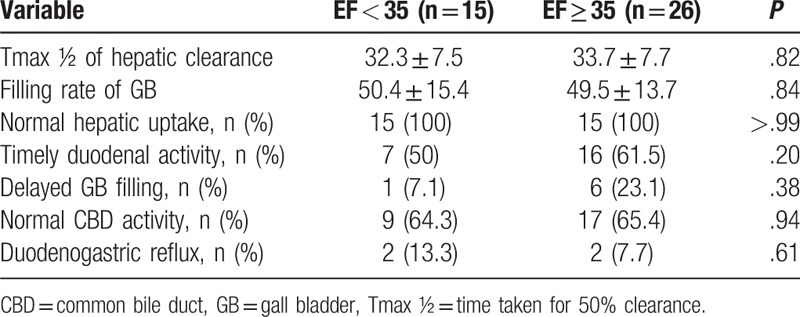
We further investigated the characteristics of cholescintigraphy including Tmax (½) of hepatic clearance, filling rate of GB, normal hepatic uptake, timely duodenal activity, delayed GB filling, normal CBD activity, duodenogastric reflux, and delayed biliary bowel transit time according to the GBEF cutoff value of 35%. However, no significant differences in these characteristics of cholescintigraphy were found between the 2 groups (Table 3).
Table 3.
Cholescintigraphy findings for the 2 gallbladder ejection fraction groups.
3.4. Association between gallbladder wall histopathology and lower gallbladder ejection fraction
Figure 5 shows multivariate analysis of the risk factors for lower GBEF. To determine which GB wall factors were independent predictors of low GBEF, we performed logistic regression analysis adjusted for age, sex, the presence of gallstone, muscle thickness, muscle to total layer ratio, and fibrosis to total layer ratio. Muscle to fibrosis layer ratio was found to be an independent risk factor of low GBEF (OR = 3.514, 95% CI = 1.058–11.673, P = .04). Figure 6 shows the correlation between fibrosis to total layer ratio and GBEF for each group. Fibrosis to total layer ratio was negatively correlated with GBEF in the low GBEF group (r = −0.657, P < .01).
Figure 5.
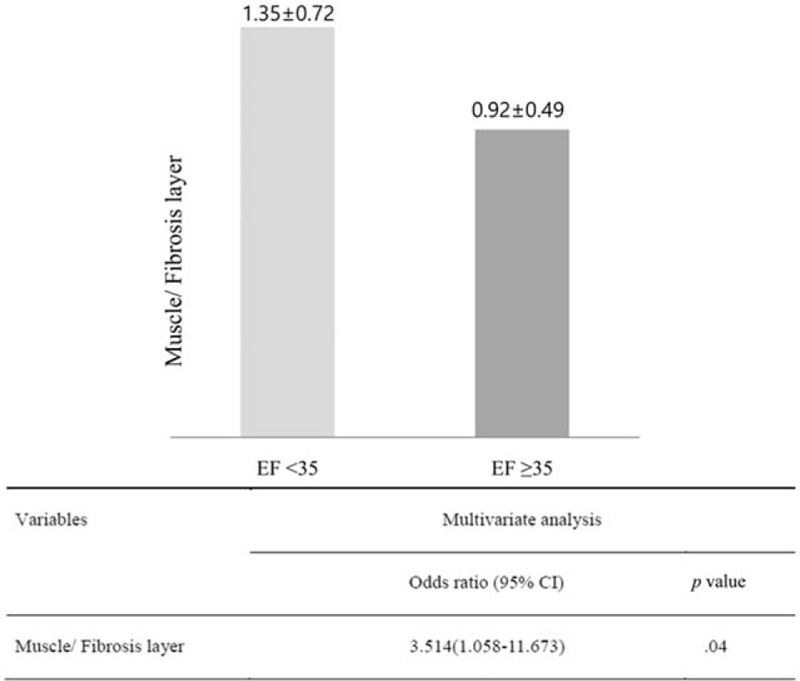
Muscle to fibrosis layer ratio for gallbladder ejection fraction (GBEF) <35% vs GBEF ≥35%. Multivariate analysis was adjusted for age, sex, gallstone, muscle thickness, muscle to total layer ratio, and fibrosis to total layer ratio. CI = confidence interval, EF = ejection fraction.
Figure 6.
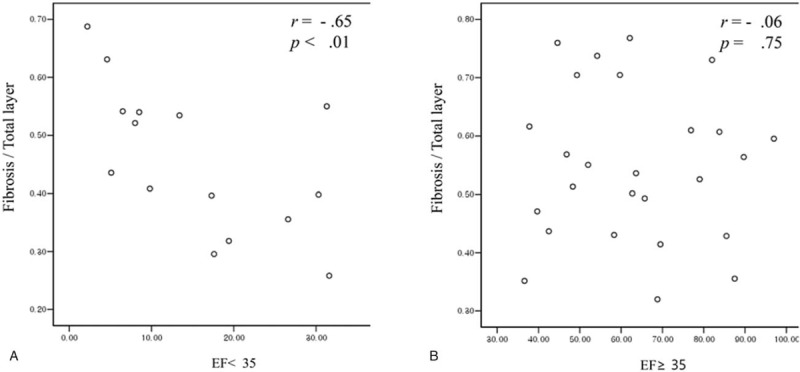
Correlation between fibrosis to total layer ratio and gallbladder ejection fraction (GBEF). Correlation between fibrosis to total layer ratio and GBEF in the GBEF <35 group (A) and the GBEF ≥ 35 group (B).
4. Discussion
To the best of our knowledge, this is the first study investigating the association between histopathologic features of the GB wall and cholescintigraphy in patients with atypical biliary pain. We found that the muscle to fibrosis layer ratio of the GB was significantly higher in the low GBEF group than in the high GBEF group. Furthermore, the muscle to fibrosis layer ratio of the GB was a significant independent factor determining low GBEF on cholescintigraphy in patients with atypical biliary pain.
There are several reports of an association between cholescintigraphy and histopathologic features. Gründel et al[14] studied the relationship between GB motility and viscosity, and found that the motility of the GB was unrelated to the viscosity of GB bile. They concluded that mucin in bile does not directly influence GB motility and suggested that chronic inflammation of the GB wall was associated with both impaired motility of the GB and increased mucin release into GB bile. Nakano et al[8] evaluated whether GBEF was able to predict pathology for symptomatic cholelithiasis. The GBEF ranged from 18% to 84% for the 4 patients with pathologic grade 1 disease (minimal inflammation) and from 0 to 46% for the 16 patients with pathologic grade 2 disease. For the 2 patients with pathologic grade 3, the GBEF was 22% and 24%, respectively. There was a greater difference in average GBEF between patients with low- and intermediate-grade GB specimens (50% vs 12%) than between those with intermediate- and high-grade specimens (12% vs 23%). However, they did not find any significant correlation between GBEF and pathologic grade. In their retrospective study, DeCamp et al[15] suggested that there was no significant correlation between the severity of histopathologic change and GB emptying in acalculous chronic cholecystitis. In our study, the degree of chronic inflammation was very mild and was not significantly different between the low GBEF group and high GBEF group; therefore, inflammation seemed to have very little influence on GBEF. However, the muscle to fibrosis layer ratio of the GB was significantly associated with a lower GBEF suggesting that the muscular component might be a major factor determining abnormal GBEF.
The mechanism underlying this association is unknown and further studies on this topic are required. However, there are several possible explanations for the link between GB muscular component and GBEF. It is possible that inflammation causes smooth muscle hypertrophy and the muscle hypertrophy is just a reflection of chronic inflammation. Blennerhassett et al[16] found that severe hypertrophy and hyperplasia of smooth muscle cells of rat small intestine are associated with inflammation. GB muscular hypertrophy might play an important role in decreasing the contractile activity of smooth muscle similar to the decreased cardiac ejection fraction in patients with cardiac muscular hypertrophy. In addition, muscarinic receptor activity or subtype might be altered by smooth muscle hypertrophy.[17,18] Muscarinic receptors seem to play an important role in the contractility of GB smooth muscle[19] and changes in activity or subtype of muscarinic receptors as a result of smooth muscle hypertrophy might be involved in the decreased contractility of GB smooth muscle.
As shown in Figure 6, there was a negative correlation between the fibrosis thickness ratio and GBEF in the low GBEF group. This negative correlation is consistent with the relationship between myocardial fibrosis and systolic function in hypertrophic cardiomyopathy with disease progression,[20] although a significant correlation between fibrosis thickness ratio and GBEF in the high GBEF group was not found. These findings imply that although the muscle to fibrosis layer ratio of the GB is the principal factor determining low GBEF in the early stage of disease, the fibrosis portion might have a significant effect on the degree of GBEF in the later stage of disease progression with abnormal GBEF.
Some studies have shown that cholecystectomy is useful in patients with biliary-like pain when the GBEF is reduced.[21,22] In contrast, 1 meta-analysis did not indicate a value of GBEF for predicting outcome after cholecystectomy in patients with recurrent abdominal pain suggestive of biliary disease without abnormal findings by conventional diagnostic tests.[23] We could not analyze symptom improvement after cholecystectomy in patients with atypical biliary pain and reduced GBEF because of insufficient medical records.
There are several limitations to the current study. First, this study was retrospective and could have been affected by the typical limitations of such an investigational design. Second, this is a single-center study involving a relatively small study population. Third, as this study focused on the association between GB wall and GBEF, we could not determine the influence of GB wall morphology on abnormal GBEF and define the mechanism by which GB muscular or fibrosis factor affects the development of abnormal GBEF. However, our findings highlight the need for subsequent studies.
5. Conclusion
This study was the first evaluation of the association between histopathologic features of the GB wall and cholescintigraphy in patients with atypical biliary pain and found a meaningful relationship between 2 GB wall factors and abnormal GBEF: The muscle to fibrosis layer ratio of the GB is associated with abnormal GBEF of less of 35% on cholescintigraphy in patients with atypical biliary pain and mild chronic cholecystitis, whereas the fibrosis thickness ratio also seems to play an important role in decreasing GBEF, but only in the later stage of disease progression with abnormal GBEF. On the basis of these results, we believe that further prospective studies on the direct association between muscular hypertrophy of the GB and abnormal GBEF on cholescintigraphy are warranted to elucidate the mechanism underlying this association.
Footnotes
Abbreviations: CBD = common bile duct, CI = confidence interval, GB = gallbladder, GBEF = gallbladder ejection fraction, OR = odds ratio, ROI = region of interest, SD = standard deviation.
The authors have no conflicts of interest to disclose.
References
- [1].Chamarthy M, Freeman LM. Hepatobiliary scan findings in chronic cholecystitis. Clin Nucl Med 2010;35:244–51. [DOI] [PubMed] [Google Scholar]
- [2].DiBaise JK, Oleynikov D. Does gallbladder ejection fraction predict outcome after cholecystectomy for suspected chronic acalculous gallbladder dysfunction? A systematic review. Am J Gastroenterol 2003;98:2605–11. [DOI] [PubMed] [Google Scholar]
- [3].Pickleman J, Peiss RL, Henkin R, et al. The role of sincalide cholescintigraphy in the evaluation of patients with acalculus gallbladder disease. Arch Surg 1985;120:693–7. [DOI] [PubMed] [Google Scholar]
- [4].Fink-Bennett D, DeRidder P, Kolozsi WZ, et al. Cholecystokinin cholescintigraphy: detection of abnormal gallbladder motor function in patients with chronic acalculous gallbladder disease. J Nucl Med 1991;32:1695–9. [PubMed] [Google Scholar]
- [5].Halverson JD, Garner BA, Siegel BA, et al. The use of hepatobiliary scintigraphy in patients with acalculous biliary colic. Arch Intern Med 1992;152:1305–7. [PubMed] [Google Scholar]
- [6].Watson A, Better N, Kalff V, et al. Cholecystokinin (CCK)-HIDA scintigraphy in patients with suspected gall-bladder dysfunction. Australas Radiol 1994;38:30–3. [DOI] [PubMed] [Google Scholar]
- [7].Harolds JA, Johnson PL, Khalifa MA, et al. Correlation of gallbladder ejection fraction with pathologic grade for chronic inflammation. South Med J 1998;91:147–50. [DOI] [PubMed] [Google Scholar]
- [8].Nakano KJ, Waxman K, Rimkus D, et al. Does gallbladder ejection fraction predict pathology after elective cholecystectomy for symptomatic cholelithiasis? Am Surg 2002;68:1052–6. [PubMed] [Google Scholar]
- [9].Corazziari E, Shaffer EA, Hogan WJ, et al. Functional disorders of the biliary tract and pancreas. Gut 1999;45(suppl 2):II48–54. [DOI] [PMC free article] [PubMed] [Google Scholar]
- [10].Krishnamurthy GT, Bobba VR, McConnell D, et al. Quantitative biliary dynamics: introduction of a new noninvasive scintigraphic technique. J Nucl Med 1983;24:217–23. [PubMed] [Google Scholar]
- [11].Iqbal M, Aggarwal S, Kumar R, et al. The role of 99mTc mebrofenin hepatobiliary scanning in predicting common bile duct stones in patients with gallstone disease. Nucl Med Commun 2004;25:285–9. [DOI] [PubMed] [Google Scholar]
- [12].Yap L, Wycherley AG, Morphett AD, et al. Acalculous biliary pain: cholecystectomy alleviates symptoms in patients with abnormal cholescintigraphy. Gastroenterology 1991;101:786–93. [DOI] [PubMed] [Google Scholar]
- [13].Tulchinsky M, Colletti PM, Allen TW. Hepatobiliary scintigraphy in acute cholecystitis. Semin Nucl Med 2012;42:84–100. [DOI] [PubMed] [Google Scholar]
- [14].Grundel D, Jungst C, Straub G, et al. Relation of gallbladder motility to viscosity and composition of gallbladder bile in patients with cholesterol gallstones. Digestion 2009;79:229–34. [DOI] [PubMed] [Google Scholar]
- [15].DeCamp JR, Tabatowski K, Schauwecker DS, et al. Comparison of gallbladder ejection fraction with histopathologic changes in acalculous biliary disease. Clin Nucl Med 1992;17:784–6. [DOI] [PubMed] [Google Scholar]
- [16].Blennerhassett MG, Vignjevic P, Vermillion DL, et al. Inflammation causes hyperplasia and hypertrophy in smooth muscle of rat small intestine. Am J Physiol 1992;262:G1041–6. [DOI] [PubMed] [Google Scholar]
- [17].Ohama T, Hori M, Ozaki H. Mechanism of abnormal intestinal motility in inflammatory bowel disease: how smooth muscle contraction is reduced? J Smooth Muscle Res 2007;43:43–54. [DOI] [PubMed] [Google Scholar]
- [18].Braverman AS, Ruggieri MR., Sr Hypertrophy changes the muscarinic receptor subtype mediating bladder contraction from M3 toward M2. Am J Physiol Regul Integr Comp Physiol 2003;285:R701–8. [DOI] [PMC free article] [PubMed] [Google Scholar]
- [19].Stengel PW, Cohen ML. Muscarinic receptor knockout mice: role of muscarinic acetylcholine receptors M(2), M(3), and M(4) in carbamylcholine-induced gallbladder contractility. J Pharmacol Exp Ther 2002;301:643–50. [DOI] [PubMed] [Google Scholar]
- [20].Olivotto I, Maron BJ, Appelbaum E, et al. Spectrum and clinical significance of systolic function and myocardial fibrosis assessed by cardiovascular magnetic resonance in hypertrophic cardiomyopathy. Am J Cardiol 2010;106:261–7. [DOI] [PubMed] [Google Scholar]
- [21].Khosla R, Singh A, Miedema BW, et al. Cholecystectomy alleviates acalculous biliary pain in patients with a reduced gallbladder ejection fraction. South Med J 1997;90:1087–90. [DOI] [PubMed] [Google Scholar]
- [22].Yost F, Margenthaler J, Presti M, et al. Cholecystectomy is an effective treatment for biliary dyskinesia. Am J Surg 1999;178:462–5. [DOI] [PubMed] [Google Scholar]
- [23].Delgado-Aros S, Cremonini F, Bredenoord AJ, et al. Systematic review and meta-analysis: does gall-bladder ejection fraction on cholecystokinin cholescintigraphy predict outcome after cholecystectomy in suspected functional biliary pain? Aliment Pharmacol Ther 2003;18:167–74. [DOI] [PubMed] [Google Scholar]


