

Abstract
Although G protein-coupled receptor (GPCR) heteromerization has been extensively demonstrated in vitro using heterologous cells that overexpress epitope-tagged receptors, their presence in endogenous systems is less well established. This is because a criterion to identify receptor heteromerization is the demonstration that the two interacting receptors are present not only in the same cell but also in the same subcellular compartment in close enough proximity to allow for direct receptor-receptor interaction. This has been difficult to study in native tissues due to a lack of sensitive and selective tools not only capable of detecting low-abundance proteins but also of demonstrating that they are in sufficiently close proximity to interact. The latter can be achieved using a proximity ligation assay (PLA). Detailed in this unit are protocols for demonstrating the presence of GPCR heteromers in endogenous cells as well as animal and human tissues, the controls required for these assays, and troubleshooting tips.
Keywords: dimerization, G-protein coupled receptors, in situ proximity ligation assay, receptor heteromers
INTRODUCTION
G-protein coupled receptors (GPCRs), also known as heptahelical or 7-transmembrane (7TM) receptors, comprise a large family of proteins that sense extracellular signals that result in activation of intracellular signaling pathways and, ultimately, a cellular response. GPCRs sense a variety of signals ranging from photons, odorants, and chemokines to biogenic amines, peptides, and hormones. As the name implies, GPCRs couple to heterotrimeric G proteins (α, β, and γ subunits; Gomes et al., 2013a). The binding of an agonist to a GPCR leads to a conformational change in the receptor that favors the binding of GTP to the Gα subunit. This allows dissociation of the Gα subunit from the Gβγ complex and activation of signaling pathways downstream of Gα and Gβγ (Gomes et al., 2013a). Following continued agonist exposure, the GTP associated with the Gα subunit is hydrolyzed to GDP, with reconstitution of the heterotrimeric G-protein complex and termination of signaling (for review, see (Gomes et al., 2013a).
For years it was believed the GPCR is composed of a single receptor (i.e., a protomer) associated with heterotrimeric G-proteins. However, an increasing body of evidence indicates that, at least in vitro, GPCRs can associate to form not only dimeric but also oligomeric complexes (Kaczor and Selent, 2011; Hiller et al., 2013; Moreno et al., 2013; Gomes et al., 2013b). It has also been found that a given GPCR can associate with another subtype of the same receptor or with a different GPCR to form heteromers that exhibit properties different from each individual receptor protomer. These in vitro findings were generated using epitope-tagged receptors that could be overexpressed in heterologous cells (Kaczor and Selent, 2011; Hiller et al., 2013; Moreno et al., 2013; Gomes et al., 2013b). In addition, a wide array of techniques were developed to study receptor heteromerization in heterologous systems. However, most of these are incapable of demonstrating receptor heteromerization in endogenous tissue. Thus, the physiological role of receptor heteromers in endogenous tissues has been difficult to study due to a lack of sensitive tools/techniques to detect the presence of endogenous heteromers and to monitor changes in their levels under normal and pathological conditions. Another concern has been that some of the results reported to be due to receptor heteromerization could instead be due to downstream receptor cross-talk. To address this issue, investigators in the GPCR field proposed a set of criteria that must be met to establish that two receptors form heteromers (Ferre et al., 2009). These criteria are: (1) the heteromers must co-localize to the same subcellular compartment and must be in sufficiently close proximity to allow for physical interactions; (2) the heteromers must exhibit a unique “biochemical fingerprint” that differs from that associated with individual receptor protomers; and (3) heteromer disruption leads to a loss of interaction and a loss of the unique biochemical fingerprint (Gomes et al., 2016a). These criteria were developed to guide the demonstration of receptor heteromers in endogenous tissue and to establish their physiological relevance.
Attempts to meet these criteria utilize a number of techniques and approaches including co-localization, co-immunoprecipitation, and proximity-based assays (Gomes et al., 2016a). A combination of techniques is needed to address Criterion 1, as no single procedure is capable of conclusively demonstrating that two receptor protomers are in direct contact with one another. For example, while co-localization studies can demonstrate that the two GPCR protomers are present in the same subcellular compartment, they do not reveal whether they are in direct contact with each other. Co-localization studies are easier to conduct in heterologous cells expressing differentially epitope-tagged receptors (i.e., one receptor tagged with a Flag epitope and the other with a Myc epitope). Well-characterized commercial antibodies selective for these epitope tags are available. Demonstrating co-localization between GPCRs in endogenous systems (cells or tissues) is more problematic due to: (a) the need to rigorously demonstrate that each antibody is selective only for the protomer being targeted, and (b) the fact that antibodies may be unable to detect low endogenous receptor expression. The in situ proximity ligation assay (PLA; Fredriksson et al., 2002), which is the focus of this unit, is used to detect the presence of receptor heteromers in endogenous systems even when they are expressed at low levels. The use of this technique to detect the presence of GPCR heteromers is discussed in detail in the protocols, with approaches to determine subcellular localization of receptor heteromers using PLA in combination with either immunofluorescence or electron microscopy (described in the Commentary).
Similarly, while co-immunoprecipitation studies can show that two receptor protomers are present as a complex, they do not indicate the number of other proteins that may be between the two receptors in the complex. Like co-localization studies, it is easier to conduct co-immunoprecipitation analysis in heterologous cells expressing differentially epitope-tagged receptors due to the commercial availability of well-characterized epitope tag–selective antibodies and the ease of generating cell lines co-expressing both receptors or expressing only individual receptor protomers. Co-immunoprecipitation analysis in an endogenous setting requires validation of the selectivity of protomer-specific antibodies and the availability of cells/tissues that endogenously co-express both receptors, as well as cells/tissues that endogenously express only individual receptor protomers. In the case of the proximity-based approaches, such as bioluminescence resonance energy transfer (BRET) or fluorescence resonance energy transfer (FRET) (Jaeger et al., 2014), while these demonstrate that two receptors are in close enough proximity for direct interactions, care must be taken when interpreting the results. For example, an increase in signal (indicative of close proximity between the differentially tagged receptor proteins) could be due to receptor overexpression or to a conformational change that decreases the distance between the tags on the receptors. Alternatively, a decrease in signal could be the result of a movement of the tags away from each other even though the two proteins are directly associated. In addition, the tagging of target receptors with large proteins such as luciferase or fluorescent protein could influence how the tagged receptors interact with other proteins and affect individual protomer function such that the results do not reflect the endogenous system. In general, because proximity-based assays require overexpression of tagged protein in heterologous cells, they are not suitable for demonstrating close proximity between two receptors in endogenous tissue.
Advances in time-resolved fluorescence resonance energy transfer that make use of protomer-selective antibodies (antibody-aided FRET) or ligands (ligand-aided FRET) labeled with an energy donor/acceptor pair permit the detection of close proximity for direct interaction between two receptor protomers in endogenous systems (Albizu et al., 2010; Comps-Agrar et al., 2011; Cottet et al., 2011; Cottet et al., 2013; Hounsou et al., 2015). However, major requirements for these studies are to demonstrate the selectivity of the antibodies or ligands employed, showing that the labels do not affect the binding of the tagged antibodies or ligands, and to determine the optimal signal-to noise ratio. Mice that co-express green fluorescent protein–tagged δ opioid receptors and mCherry-tagged μ opioid receptors have been generated (Erbs et al., 2015). These animals are proving to be invaluable tools for demonstrating the presence of μ and δ opioid receptor heteromers not only in the same cell but also within the same subcellular compartment (Erbs et al., 2015). However, because these receptors are tagged with fluorescent proteins that could potentially modify not only protomer localization but also interactions with other proteins, the data generated with these mice may not accurately reflect the endogenous situation. Moreover, the time, effort, and cost required to generate such mice make the technology inappropriate for use in investigating all heteromer pairs of interest.
Most investigators studying GPCR heteromerization have used Criterion 2, the demonstration of a unique biochemical fingerprint, as evidence for receptor heteromerization. To this end, they generally examine either the binding, signaling, or trafficking, or a combination of these, of the putative heteromer in heterologous cells co-expressing epitope-tagged receptors, and compare them with cells expressing only individual protomers (Gomes et al., 2016a). Such studies help establish that the presence of the two receptors is required to establish the unique biochemical profile. However, to fulfill the criteria for heteromerization in endogenous tissue, it is essential to demonstrate that the unique fingerprint observed in heterologous cells is also present in wild-type tissue co-expressing both receptors but not in tissues from animals lacking one of the receptor protomers. It is also important to show that this fingerprint is lost following heteromer disruption. This latter requirement, which also helps fulfill Criterion 3 for receptor heteromerization, requires the development of reagents that target only the desired heteromer. Investigators have invested considerable time and effort in generating such reagents and specialized animals. These include heteromer-selective antibodies (Gupta et al., 2010; Rozenfeld et al., 2011; Berg et al., 2012; Bushlin et al., 2012), bivalent or bifunctional/multifunctional ligands that target a desired heteromer (Bhushan et al., 2004; Daniels et al., 2005; Lenard et al., 2007; Yamamoto et al., 2007; Vardanyan et al., 2011; Akgun et al., 2013; Yuan et al., 2013; Journe et al., 2014), small-molecule ligands that are biased towards the desired heteromer (Yekkirala et al., 2011; Gomes et al., 2013c), membrane-permeable peptides that disrupt heteromer formation (Pei et al., 2010; He et al., 2011; Liu et al., 2011; Sevigny et al., 2011; O’Dowd et al., 2012; Kabli et al., 2014), and mice expressing dimerization-deficient mutants (Gonzalez et al., 2012; Moreno et al., 2012; Baba et al., 2013). Use of such tools is beginning to tease apart the physiological role of GPCR heteromers and its alteration under pathological conditions.
Of the three criteria proposed to demonstrate GPCR heteromerization (see above), Criterion 1 is the most critical, because without demonstration of co-localization of interacting receptors to the same subcellular compartment and their close proximity for direct receptor-receptor interactions, results for validating Criteria 2 and 3 could be due to down-stream receptor cross-talk rather than direct receptor-receptor interactions. When used with the appropriate controls, the in situ PLA assay described below can be employed to demonstrate not only the close proximity of two receptors in endogenous tissue that will allow for direct interactions, but also make possible their localization to a subcellular compartment as well as detection of alterations of heteromer levels following drug manipulation or in association with pathologies. Moreover, the technique is sufficiently sensitive to detect low-abundance proteins. The technique and the detailed protocols for its use in our laboratory are described below. Basic Protocol 1 describes indirect PLA performed on fixed mouse tissue slices; Basic Protocol 2 details the indirect PLA procedure used with cells; Basic Protocol 3 describes indirect PLA on formalin-fixed, paraffin-embedded human brain sections; and Basic Protocol 4 is a procedure for direct PLA using tissue slices or cells. Support Protocols are provided for preparing tissue sections and cells for PLA, for conjugation of primary antibodies to oligonucleotide probes to be used in PLA assays, and for image acquisition and data analysis for these assays.
In Situ Proximity Ligation Assay (PLA)
The PLA exploits both antibody and DNA binding properties by making use of double recognition by oligonucleotide-conjugated antibodies. This provides high selectivity of protein detection and good signal-to-noise ratio (Weibrecht et al., 2010). In addition, the use of DNA and techniques that allow DNA modification permits the detection and visualization of single protein molecules with a high degree of spatial accuracy and sensitivity (Weibrecht et al., 2010). Thus, PLA can be used to detect the presence of receptor heteromers in endogenous systems either using primary antibodies coupled to short oligonucleotide sequences (direct PLA) or primary antibodies in combination with secondary antibodies coupled to short oligonucleotide sequence (indirect PLA). In addition, the technique can be used in combination with protein markers of different intracellular compartments to demonstrate the intracellular localization of a given receptor heteromer. However, given that the assay depends on the use of antibodies that recognize a given protomer, it is critical to evaluate the selectivity of the antibodies for that protomer to reduce the chances for signal artifacts.
Detailed in the following sections are PLA protocols that can be used for the detection of receptor heteromers in endogenous systems (indirect and direct PLA), as well as approaches for using PLA in combination with subcellular compartment markers to determine the localization of heteromers. Examples are provided of results obtained with cells or tissues endogenously expressing receptors, as well as information on data analysis and assay troubleshooting.
PLA principle
Samples such as adherent cells or tissue slices expressing the endogenous receptors of interest are incubated with IgG-class primary antibodies raised in different species (e.g., mouse, rabbit or goat) against protomers to be detected, followed by incubation with commercially available species-specific secondary antibodies coupled to a short oligonucleotide sequence. These antibodies are also called PLA probes. There are two PLA probes, PLUS and MINUS. The PLA probe PLUS binds to the antibody recognizing one protomer, while the PLA probe MINUS binds to the antibody recognizing the second protomer. If the two protomers are in close proximity (less than 17 nm apart; Trifilieff et al., 2011), addition of two oligonucleotides that hybridize with the two PLA probes will lead to the formation of a closed circle template following addition of a ligase. This closed circle is amplified by means of a rolling-circle amplification using polymerase and complementary fluorescently labeled oligonucleotides (amplification step, Fig. 2.16.1). This generates a signal that is visible as a distinct fluorescent spot that can be detected and quantified by fluorescence microscopy.
Figure 2.16.1.
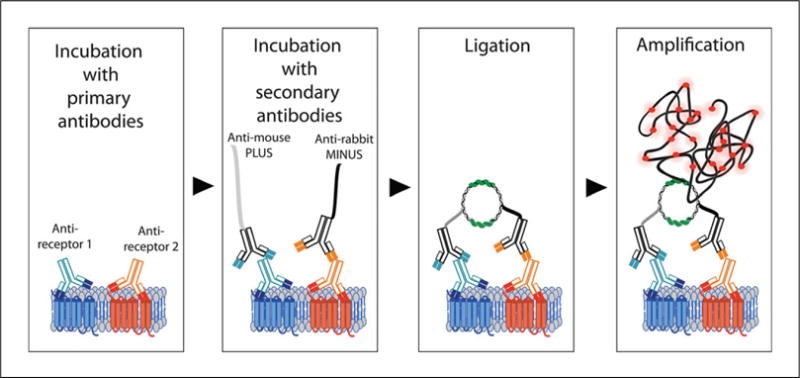
Schematic representation of indirect PLA to detect receptor heteromers. Samples are first incubated with antibodies that selectively recognize each receptor protomer. This is followed by incubation with species-specific secondary antibodies coupled to oligonucleotide sequences (i.e., the PLA probes PLUS and MINUS). Ligation of the oligonucleotide sequences creates a rolling circle template that is amplified by polymerase in the presence of fluorescent oligonucleotides.
INDIRECT PLA IN MOUSE TISSUE SLICES
40-μm-thick fixed mouse brain tissue slices are used for this assay (see Support Protocol 1). The antibodies to individual receptor protomers are unconjugated and raised in two different species (mouse, rabbit or goat), while the species-specific PLA probes, one PLUS and the other MINUS, are used as secondary antibodies.
Materials
Fixed free-floating mouse brain tissue slices co-expressing both of the receptor protomers being investigated or expressing only individual protomers (Support Protocol 1)
1× phosphate-buffered saline (1× PBS; see recipe for 10×)
Gelatin from bovine skin (Sigma-Aldrich, cat. no. G9391)
0.05 M Tris·Cl, pH 7.6 (APPENDIX 2A)
Triton X-100 (Sigma-Aldrich, cat. no. X-100)
PLA probes (species-specific secondary antibodies conjugated to either PLUS or MINUS oligonucleotide sequences): every PLA probe kit includes the blocking and antibody diluent solutions (Sigma-Aldrich, cat. no. DUO92001 to DUO 92010; check company Web site) in addition to the conjugated secondary antibodies (the method for determining the selectivity of the PLA probes is described in Critical Parameters)
Primary antibodies that selectively recognize each GPCR protomer of interest: these may be either obtained commercially or generated and validated in-house (the technique for determining the selectivity of antibodies for a protomer is described below in Critical Parameters)
Duolink In Situ Wash Buffer (Fluorescence) comprising PLA Buffer A and Buffer B (Sigma-Aldrich, cat. no. DUO82049), or equivalent reagents prepared in-house (see recipes)
Duolink In Situ Detection Reagent Red (includes ligase, ligase reagent, polymerase, and amplification reagent; Sigma- Aldrich, cat. no. DUO92008; for fluorophores different from Red, check the Web site)
0.01× PLA Buffer B (see recipe)
Duolink In Situ Mounting Medium with DAPI (Sigma-Aldrich, cat. no. DUO82040)
Nail polish or acrylic resin
Superfrost Plus Microscope Slides (Fisher Scientific, cat. no. 22-037-246)
Hydrophobic pen (Vector Laboratories, cat. no. H-4000)
Coplin jars (Sigma-Aldrich, cat. no. S5766-6EA)
Orbital shaker
Opaque Humidity Chamber Plus (Biolegend, cat. no. 926301)
Blotting paper
Tweezers
Coverslips (glass)
Leica TCS SP5 confocal laser scanning microscope (405-nm laser line for DAPI, 568-nm laser line for Detection Reagent Red)
Rinse tissue slices
-
1
Defrost cryotube vials containing previously fixed tissue slices, and place the tissue in 1.5-ml tubes containing 1× PBS.
-
2
Rinse the free-floating slices for 5 min at room temperature in 1 ml of 1× PBS. Discard the PBS solution and repeat the rinse step two more times.
Mount tissue slices on slides
All steps at this stage are conducted at room temperature.
-
3Mount one to three tissue slices on a “Superfrost” slide by using either 1× PBS or 0.2% gelatin in 0.05 M Tris Cl, pH 7.6.Gelatin makes it easier to mount the slice and does not alter the results.
-
4
Air dry the slides under a hood (requires 10 to 15 min). Ensure the slides are completely dry, otherwise the tissue slices detach when rinsing.
-
5
Encircle the dry tissue slices on the slides with a hydrophobic pen to create a barrier that keeps reagents localized onto the slices. Allow to dry for 10 to 15 min (Fig. 2.16.2).
-
6
Place the slides in a Coplin jar filled with 0.01% Triton X-100 in 1× PBS. Shake on an orbital shaker at low speed for 12 min.
-
7
Rinse the slides three times (each time for 5 min) in the Coplin jar with 1× PBS.
-
8
Place the slides in a humidity chamber.
Figure 2.16.2.

Creation of a barrier using a hydrophobic pen. To create a barrier to keep the reagents on the sample, encircle the dry sample using a hydrophobic pen.
Blocking step
-
9Add blocking solution (from Duolink PLA probe kit; yellow cap) to the slices.We typically use 50 to 70 μl for each axial/sagittal mouse brain slice.
-
10Cover the humidity chamber and place it in an incubator for 1 hr at 37°C.The blocking solution should be added only after the slides are placed in the humidity chamber and inside the incubator, in order to keep the reagent in the desired place.
-
11Discard the blocking solution by overturning the slide onto blotting paper.The sample should not be allowed to become totally dry.
Incubate with primary antibodies
-
12Add 50 to 70 μl of primary antibody solution and incubate in the humidity chamber overnight at 4°C.Given that commercially available PLA probes from Sigma-Aldrich are raised in mouse, rabbit, or goat, make certain that the primary antibodies used to recognize one of the protomers is raised in one of these species (e.g., goat) and the antibodies used to recognize the other protomer is from another of these species (e.g., rabbit). Dilute the antibodies (e.g., 1:200) in 1× antibody diluent solution. It may be necessary to titrate the antibody dilution for optimal results.
-
13
Discard the antibody solution and place the slides in a Coplin jar filled with PLA Buffer A and stir on an orbital shaker at low speed for 5 min. Repeat this step three times with PLA Buffer A.
Incubate with PLA probes
-
14Place slides in the humidity chamber and in the incubator and add 50 to 70 μl of PLA probe solution. Incubate for 1 hr at 37°C.Dilute the PLA probes 1:5 using 1× antibody diluent solution from the same kit. One probe should be PLUS and the other MINUS (e.g., anti-goat PLUS and anti-rabbit MINUS). It does not matter which secondary antibody is linked to the PLUS or MINUS oligonucleotide sequence, as long as one secondary antibody is linked to the PLUS and the other to the MINUS sequence.
-
15
Wash unbound PLA probes with PLA Buffer A as described in step 13.
Form the rolling circle template
-
16
Place slides in the humidity chamber and in the incubator (see step 10), and add 50 to 70 μl of ligation solution (from Duolink In Situ Detection Reagent Red kit). Incubate at 37°C for 30 min to 1 hr.
-
17
Discard the ligation solution and repeat washes in PLA Buffer A as described in step 13.
Amplify and incorporate fluorescent oligonucleotides
-
18Place slides in the humidity chamber and in the incubator and add 50 to 70 μl of polymerase solution (from Duolink In Situ Detection Reagent Red kit). Incubate at 37°C for 100 min.From this step onward, make certain that the tissue humidity chamber is covered with aluminum foil or kept in the dark, because the fluorophore added during this amplification process is light sensitive.
-
19Discard the polymerase solution and wash slides in PLA Buffer B as described in step 13, except for 10 min instead of 5 min, and perform the third wash in 0.01× Buffer B.Make certain that the Coplin jar is covered with aluminum foil.
Mount coverslips
-
20
Air dry the slides in the dark (we usually place the slides tilted inside a slide storage box).
-
21
Once completely dry, add 4 to 6 μl of Duolink In Situ Mounting Medium with DAPI to the tissue slice using a 20-μl pipet tip with the end cut off to enlarge the opening.
-
22
Cover the tissue slices with glass coverslips. Place the slides on a black background. Use tweezers to place the coverslip on top of the tissue slice at an angle, gently dropping it on top of the slice to avoid trapping air bubbles on the sample. Because the mounting medium does not solidify, the coverslip is easily displaced. Therefore, seal the edges of the coverslip to the slide using nail polish or an acrylic resin.
-
23Once the nail polish or acrylic resin is dry, visualize samples under the microscope.Slides can be stored in the dark for 15 days at 4°C or for months at −20°C. However, because the PLA signal is light sensitive it is best to view the samples as soon as possible.An example of how the PLA signal is visualized in tissue slices is provided in Fig. 2.16.3, where the red dots (positive PLA signal) are noted in cells expressing the heteromer being investigated and no PLA signal is seen in cells where one of the protomers forming the receptor heteromer pair is not present. The DAPI present in the Duolink In Situ Mounting Medium helps identify individual cell nuclei.
Figure 2.16.3.
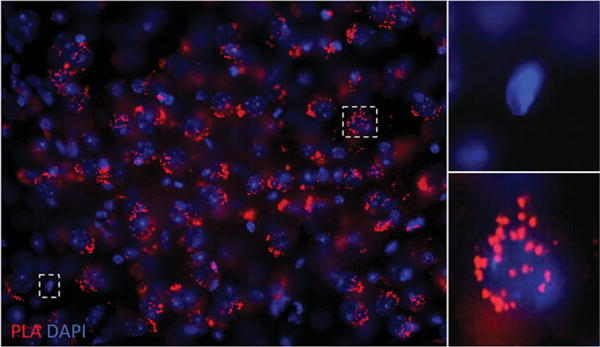
Indirect PLA in a mouse brain slice. Mouse brain slices are incubated with anti-goat antibody selective for protomer A and anti-rabbit antibody selective for protomer B, followed by incubation with species-specific PLA probes PLUS and MINUS. Ligation of the oligonucleotide sequences creates a rolling circle template that is amplified by polymerase in the presence of fluorescent oligonucleotides and that can be detected as red dots by confocal microscopy. (Left Panel) Positive PLA signal (red dots) with the nuclei stained in blue by DAPI. (Upper Right Panel) Higher magnification of a cell devoid of PLA signal. (Lower Right Panel) Higher magnification of a cell positive for PLA signal.
INDIRECT PLA FOR CELLS
In this protocol, cells are processed for conducting a PLA (also see Support Protocol 2). The antibodies to individual receptor protomers are unconjugated and raised in two different species (mouse, rabbit or goat), while the species-specific PLA probes, one PLUS and the other MINUS, are employed as secondary antibodies.
Materials
Cells endogenously expressing one or both receptor protomers being investigated, plated and processed as in Support Protocol 2
PLA probes (species-specific secondary antibodies conjugated to either PLUS or MINUS oligonucleotide sequences): every PLA probe kit includes the blocking and antibody diluent solutions (Sigma-Aldrich, cat. no. DUO92001 to DUO 92010; check company Web site) in addition to the conjugated secondary antibodies (the method for determining the selectivity of the PLA probes is described in Critical Parameters)
Primary antibodies from a commercial supplier or generated and validated in-house, that selectively recognize each protomer being investigated (described in Critical Parameters is a procedure for determining the selectivity of the antibodies for a target protomer)
Duolink In Situ Wash Buffer (Fluorescence) comprising PLA Buffer A and Buffer B (Sigma-Aldrich, cat. no. DUO82049), or equivalent reagents prepared in-house (see recipes)
0.01× PLA Buffer B (see recipe)
Duolink In Situ Detection Reagent Red (includes ligase, ligation reagent, polymerase, and amplification reagent; Sigma-Aldrich, cat. no. DUO92008; for fluorophores different from Red, check the Web site)
Duolink In Situ Mounting medium with DAPI (Sigma-Aldrich, cat. no. DUO82040)
Nail polish or acrylic resin
Blotting paper
Coverslips (glass)
Leica TCS SP5 confocal laser scanning microscope (405 nm laser line for DAPI, 568 nm laser line for Detection Reagent Red)
Additional reagents and equipment for plating and processing cells for PLA (Support Protocol 2)
-
1
Follow Support Protocol 2 for plating and processing cells for PLA.
Perform blocking
-
2
Add 60 μl of blocking solution (from Duolink PLA probe kit; yellow cap) to each well of the Lab-Tek chamber slide with cover glass slide containing cells processed as described in Support Protocol 2.
-
3
Cover the Lab-Tek chamber slide with the lid and place it in an incubator for 1 hr at 37°C.
-
4Discard the blocking solution by overturning the Lab-Tek chamber slide onto blotting paper.The cells should not be allowed to totally dry.
Incubate with primary antibodies
-
5Add 60 μl primary antibody solution/well, cover the chamber, and incubate overnight at 4°C.Given that commercially available PLA probes from Sigma-Aldrich are raised in mouse, rabbit, or goat, make certain the primary antibodies used to recognize one of the protomers is raised in one of these species (e.g., mouse) and the antibodies used to recognize the other protomer is from another of these species (e.g., rabbit). Dilute the antibodies (e.g., 1:200) in 1× antibody diluent solution. The antibody dilution may need to be titrated for optimal results.
-
6
Discard the antibody solution and fill the wells with PLA Buffer A. Wash for 5 min at room temperature. Repeat this step three times.
Incubate with PLA probes
-
7Add 60 μl of PLA probe solution/well, cover the chamber. Incubate for 1 hr at 37°C.Dilute the PLA probes 1:5 using 1× antibody diluent solution from the same kit. One probe should be PLUS and the other MINUS (e.g., anti-mouse PLUS and anti-rabbit MINUS). It does not matter which secondary antibody is linked to the PLUS or MINUS oligonucleotide sequence, as long as one secondary antibody is linked to the PLUS and the other to the MINUS sequence.
-
8
Repeat step 6.
Form the rolling circle template
-
9
Add 60 μl of ligation solution (from Duolink In Situ Detection Reagent Red kit) per well, and cover the chamber. Incubate at 37°C for 30 to 60 min.
-
10
Discard the ligation solution and repeat washes in PLA Buffer A as described in step 6.
Amplify and incorporate fluorescent oligonucleotides
-
11Add 60 μl of polymerase solution (from Duolink In Situ Detection Reagent Red kit) and incubate at 37°C for 100 min.From this step onward, make certain that the Lab-TEK chamber slide is covered with aluminum foil or kept in the dark, because the fluorophore added during this amplification process is light sensitive.
-
12
Discard the polymerase solution, detach the wells from the slides, then place the slides in a Coplin jar and perform washes in Buffer B using the technique described in step 5 by placing the Coplin jar on an orbital shaker at low speed for 10 min instead of 5 min; perform the final wash in 0.01× Buffer B.
Mount coverslips
-
13
Air dry the slides in the dark (detach the silicone gasket attached to the slide and place the slides tilted inside a slide storage box).
-
14
Once the slides are completely dry, add 2 to 3 μl of Duolink In Situ Mounting Medium with DAPI to each sample on the slide using a 20 μl pipet with the end cut off to enlarge the opening.
-
15
Cover the tissue slices with glass coverslips. Place the slides on a black background. Use tweezers to place the coverslip on top of the tissue slice at an angle, then gently drop it on top of the slice to avoid trapping air bubbles on the sample. Because the mounting medium does not solidify, the coverslip is easily displaced. Therefore, seal the edges of the coverslip to the slide with nail polish or an acrylic resin.
-
16Once the nail polish or acrylic resin is dry, visualize the samples under the microscope.Slides can be stored in the dark for 15 days at 4°C or for months at −20°C. However, because the PLA signal is light sensitive, the samples should be visualized as soon as possible.An example of how the PLA signal is visualized in cells co-expressing the heteromer of interest is displayed on Fig. 2.16.4. Red dots indicate a positive PLA signal. The cell nuclei are stained blue by the DAPI present in the Duolink In Situ Mounting Medium.
Figure 2.16.4.
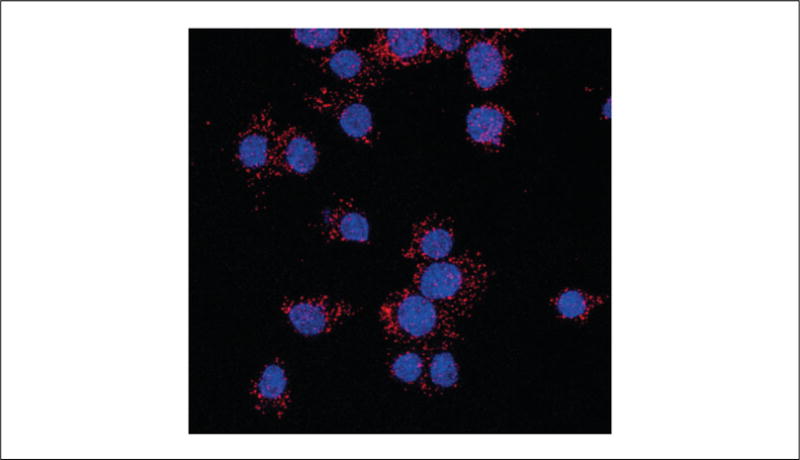
Indirect PLA in cells. Cells co-expressing GPCR protomer A and GPCR protomer B are incubated with anti-mouse antibody selective for protomer A and anti-rabbit antibody selective for protomer B, followed by incubation with species-specific PLA probes PLUS and MINUS. Ligation of the oligonucleotide sequences creates a rolling circle template that is amplified by polymerase in the presence of fluorescent oligonucleotides and can be detected as red dots by confocal microscopy with the nuclei stained in blue by DAPI.
INDIRECT PLA USING FORMALIN-FIXED PARAFFIN-EMBEDDED HUMAN BRAIN SECTIONS
A major goal is to demonstrate the presence and regulation of heteromers in human tissue. Described below is a protocol for conducting a PLA using formalin fixed paraffin embedded (FFPE) human brain sections. When using such samples, it is necessary to conduct tissue hydration and antigen retrieval prior to performing the PLA, to uncover the epitopes recognized by the primary protomer-selective antibodies. In addition, it is necessary to quench the autofluorescence of lipofuscin, a pigment that accumulates in the cytoplasm of cells with age (Brizzee et al., 1974), which can obscure the PLA signal. To mask the lipofuscin autofluorescence, an additional step must be added to the PLA protocol as described below.
Materials
Formalin fixed-paraffin embedded human brain sections (these were a kind gift from from Dr. Marco Hefti, Department of Pathology, Mount Sinai Hospital, New York)
Xylene (mixed isomers; Fisher Scientific, cat. no. X5-1)
100%, 95%, 75%, and 50% ethanol
10 mM sodium citrate solution containing 0.05% (v/v) Tween 20
0.1% Sudan Black B in 70% ethanol solution (see recipe)
Duolink In Situ Wash Buffer (Fluorescence) comprising PLA Buffer A and Buffer B (Sigma-Aldrich, cat. no. DUO82049), or equivalent reagents prepared in-house (see recipes)
0.01× PLA Buffer B
Duolink In Situ Mounting Medium with DAPI (Sigma-Aldrich, cat. no. DUO82040)
Hydrophobic pen (Vector Laboratories, cat. no. H-4000)
10-ml ml syringe
Tweezers
Coverslips (glass)
Leica TCS SP5 confocal laser scanning microscope (405 nm laser line for DAPI, 568 nm laser line for Detection Reagent Red)
Additional reagents and equipment for indirect PLA (see Basic Protocol 1, steps 6 to 19)
Rehydrate slides containing human tissue sections
Perform all steps at room temperature in Coplin jars.
-
1
Immerse slides in xylene (mixed isomers) for 20 min.
-
2
Immerse slides in 100% ethanol for 20 min.
-
3
Immerse slides in 95% ethanol in distilled water for 5 min.
-
4
Immerse slides in 75% ethanol in distilled water for 5 min.
-
5
Immerse slides in 50% ethanol in distilled water for 5 min.
-
6
Immerse slides in distilled water for 5 min.
Perform antigen retrieval
-
7Immerse slides for 10 min at 95° to 100°C in 10 mM sodium citrate buffer containing 0.05% Tween 20, pH 6.Make certain the slides are placed in a hot plate to maintain the temperature for 10 min.
-
8
Dry slides at room temperature for 30 min.
-
9
Encircle the region of interest on the slide with a hydrophobic pen to create a barrier that keeps reagents localized on the desired region. Let dry for 15 min.
Perform indirect PLA
-
10
Conduct an indirect PLA as described in steps 6 to 19 of Basic Protocol 1.
Quenching of lipofuscin autofluorescence
-
11Incubate the sections with 0.1% Sudan Black B in 70% ethanol solution for 20 min.This solution should be prepared on the previous day as described in Reagents and Solutions.
-
12
Wash sections with PLA Buffer B (from Duolink In Situ Wash Buffer kit) twice for 10 min each time.
-
13
Fill a 10-ml syringe with PLA Buffer B and jet wash the section to remove excess Sudan Black B solution.
-
14
Place slides in the Coplin jar with 0.01 × PLA Buffer B for 1 min.
-
15
Air dry the slides in the dark (we typically place the slides tilted inside a slide storage box).
-
16Once completely dry, add 4 to 6 μl of Duolink In Situ Mounting Medium with to the tissue slice using a 20-μl pipet tip with the end cut off to enlarge the opening.While 4 to 6 μl are usually added, this can be increased to 8 μl for larger sections.
-
17
Cover the slides with glass coverslips. Place the slides on a black background. Use tweezers to place the coverslip on top of the tissue slice at an angle, and gently drop it on top of the slice to avoid trapping air bubbles on the sample. Because the mounting medium does not solidify, the coverslip could be easily displaced. Therefore, seal the edges of the coverslip to the slide with nail polish or an acrylic resin.
-
18Once the nail polish or acrylic resin is dry, visualize the samples under the microscope.Slides can be stored in the dark for 15 days at 4°C or for months at −20°C. However, since the PLA signal is light sensitive, the samples should be visualized as soon as possible.An example of how the PLA signal is visualized in sections with or without lipofuscin autofluorescence quenching is displayed on Fig. 2.16.5.
Figure 2.16.5.
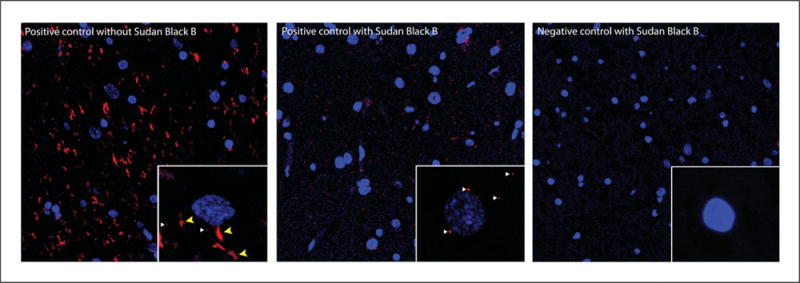
Indirect PLA with a human brain slice with or without quenching of lipofuscin autofluorescence. (Left Panel) Positive PLA (red dots) and lipofuscin autofluorescence signals (red tangle-shaped) with the nuclei stained in blue with DAPI. Inset shows an individual cell containing PLA (white arrows) and lipofuscin (yellow arrows) signals in red. (Middle Panel) Positive PLA signal (red dots) with the nuclei stained with DAPI and treated with Sudan Black B solution to quench lipofuscin autofluorescence. Inset shows PLA (white arrows) signals. (Right Panel) No PLA or lipofuscin signal is obtained when primary antibodies are not added and Sudan Black B solution is used. Inset shows no red signal.
DIRECT PLA FOR TISSUE SLICES OR CELLS
The direct PLA protocol is essentially the same as that described for tissue slices (Basic Protocol 1) or cells (Basic Protocol 2), except that the primary antibody is conjugated directly with the PLA oligonucleotide PLUS or MINUS (see Support Protocol 3) using commercially available probemakers, and secondary antibodies are not used (see Fig. 2.16.6). We usually perform direct PLA when the primary antibodies to the individual receptor protomers are raised in the same species or when one or both antibodies are hosted in species other than mouse, rabbit, or goat (commercially PLA probes are derived from these species only).
Figure 2.16.6.
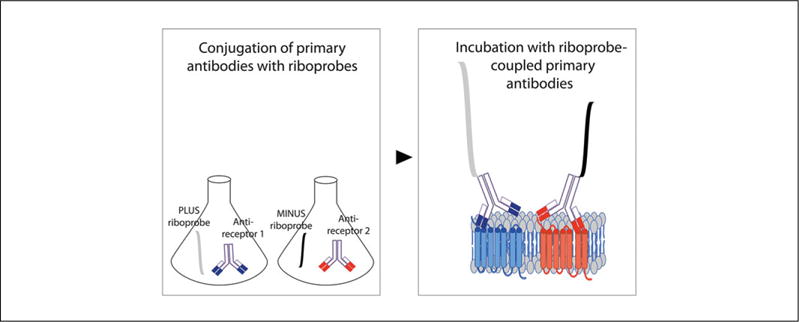
Schematic of direct PLA. Antibodies that selectively recognize one receptor protomer are conjugated directly with the PLA oligonucleotide PLUS while the antibodies that recognize the other receptor protomer are conjugated directly with the PLA oligonucleotide MINUS using commercially available probemakers. The PLA assay is then carried out in the absence of secondary antibodies.
Materials
Fixed free-floating mouse brain tissue slices/cells co-expressing both receptor protomers of interest or expressing only individual protomers
Primary antibodies coupled to oligonucleotide sequence PLUS or MINUS (see Support Protocol 3)
Duolink In Situ Wash Buffer (Fluorescence) comprising PLA Buffer A and Buffer B (Sigma-Aldrich, cat. no. DUO82049), or equivalent reagents prepared in-house (see recipes)
0.01× PLA Buffer B
Duolink In Situ Detection Reagent Red (includes ligase, ligation reagent, polymerase, and amplification reagent; Sigma- Aldrich, cat. no. DUO92008; for fluorophores different from Red, check the Web site)
Duolink In Situ Mounting Medium with DAPI (Sigma-Aldrich, cat no. DUO82040)
Nail polish or acrylic resin
Leica TCS SP5 confocal laser scanning microscope (405 nm laser line for DAPI, 568 nm laser line for Detection Reagent Red)
Additional reagents and equipment for indirect PLA assays (Basic Protocol 1 for tissue slices or Basic Protocol 2 for cells)
-
1
Follow Basic Protocol 1 for tissue slices and Basic Protocol 2 for cells to the point where primary antibodies are added.
Incubate with primary antibodies
-
2Add 50 to 70 μl primary antibody solution (coupled to oligonucleotide sequence PLUS or MINUS as described in Support Protocol 3) for tissue slices and 60 μl for cells and incubate as described in Basic Protocols 1 and 2 overnight at 4°C.Dilute the antibodies (e.g., 1:5) in 1× antibody diluent solution.
-
3
Discard the antibody solution and wash tissue slices/cells in PLA Buffer A (from Duolink In Situ Wash Buffer kit) as described in Basic Protocols 1 and 2.
Form the rolling circle template
-
4
Incubate tissue slices with 50 to 70 μl and cells with 60 μl ligation solution (from Duolink In Situ Detection Reagent Red kit) as described in Basic Protocols 1 and 2.
-
5
Discard the ligation solution and wash in PLA Buffer A as described in step 3.
Amplify and incorporate fluorescent oligonucleotides
-
6
Incubate tissue slices with 50 to 70 μl or cells with 60 μl of polymerase solution (from Duolink In Situ Detection Reagent Red kit) at 37°C for 100 min as described in Basic Protocols 1 and 2.
-
7
Discard the polymerase solution and repeat washes in PLA Buffer B (from Duolink In Situ Wash Buffer kit) as described in Basic Protocols 1 and 2.
Mount coverslips
-
8
Air dry tissue slices/cells in the dark as described in Basic Protocols 1 and 2.
-
9
Add Duolink In Situ Mounting Medium with DAPI to the tissue slices/cells as described in Basic Protocols 1 and 2.
-
10
Cover the tissue slices/cells with coverslips and add nail polish or acrylic resin as described in Basic Protocols 1 and 2.
-
11Visualize samples under the microscope.The PLA signal is similar to that observed following Basic Protocols 1 and 2.
PREPARATION OF TISSUE SECTIONS FOR PLA
This section describes the preparation of mouse brain tissue sections for PLA analysis.
Materials
Mice (wild-type, and lacking one of the receptor protomers; of the same strain background)
Ketamine hydrochloride/xylazine hydrochloride (Sigma-Aldrich, cat. no. K113)
1× Ringer’s solution (see recipe)
4% paraformaldehyde (see recipe)
1× phosphate-buffered saline (1× PBS; see recipe for 10×)
Cryoprotectant solution (see recipe)
Deltaphase isothermal pad (Braintree Scientific, Inc., cat. no. 39DP)
Surgical tape
Surgical work surface, e.g., Styrofoam sheet
Surgical instruments for mice
18-G needles
Peristaltic pump (Cole Parmer, cat. no. WU-07525-20)
Tubing for peristaltic pump
22- to 23-G blunt needles
Leica SM 2000 R sliding microtome with BFS-3 MP Physitemp Temperature Controller (or dry ice tray) or Leica VT1000 S vibratome
Cryotubes
Additional reagents and equipment for injection of mice (Donovan and Brown, 2006)
Prepare mouse
-
1
Weigh the mouse to the nearest 0.1 g.
-
2
Anesthetize mouse with an intraperitoneal (i.p.) injection (Donovan and Brown, 2006) of ketamine hydrochloride/xylazine hydrochloride (80 and 12 mg/kg body weight, respectively).
-
3
Place the mouse in an isothermal pad for 5 to 10 min.
-
4
Assess the animal’s responses to tail/toe pinches and for the presence of ocular reflex (an anesthetized animal will not blink when cornea is touched). Proceed to transcardial perfusion (Gage et al., 2012) only if the animal does not respond to the noxious stimuli and the ocular reflex is absent. If the animal is not completely anesthetized, give a second injection of ketamine (50% of the original dose) after 10 min, and reassess responses.
Perform surgical procedures (Gage et al., 2012)
-
5
Once the animal is completely anesthetized, secure it in a supine position (lying on back with face upward) by gently taping the paws with surgical tape to a work surface (e.g., styrofoam sheet) inside a chemical hood.
-
6
Make a skin incision with surgical scissors along the thoracic midline from just beneath the xiphoid process to the clavicle. Make two additional lateral skin incisions from the xiphoid process along the base of the ventral ribcage.
-
7
Expose the entire thoracic field. Using blunt forceps, grasp the cartilage of the xiphoid process and raise it slightly to allow for insertion of pointed scissors.
-
8
Cut through the thoracic musculature and ribcage between the breastbone and medial rib insertion points and extend the incision rostrally to the level of the clavicles.
-
9
Separate the diaphragm from the chest wall on both sides with scissor cuts and tape or pin (using 18-G needles) the ribcage laterally to expose the heart.
Perform transcardial perfusion
-
10
Set the speed of the peristaltic pump to 20 to 25 ml/min.
-
11Once the pump is running and the circuit tubing and needle (22-G to 23-G, blunt) are filled with 1× Ringer’s solution (make certain there are no bubbles inside the tubing), break through the apex of the left ventricle with the blunt needle connected to the tubing and leave it there.Because keeping the needle in the left ventricle is challenging in mice, it is recommended this technique be perfected with practice animals before working on experimental mice.
-
12
Cut the right atrium with scissors to allow the blood to exit. Allow ~50 ml Ringer’s solution to pass through (the fluid running by the right atrium turns colorless).
-
13Perfuse with 4% paraformaldehyde (75 to 100 ml), making certain that the needle does not come out of the left ventricle.Signs of an acceptable perfusion are muscle spasms of the limbs, tail elevation, and pale liver.
-
14
Remove the needle from the left ventricle, rinse out the paraformaldehyde from the peristaltic pump, tubing, and needle by pumping Ringer’s solution through the system, and extract the brain (Gage et al., 2012).
Post-fix tissues
-
15
Post-fix the brain in 4% paraformaldehyde for 24 hr at 4°C.
-
16
Rinse the brain three times in 1× PBS, and immerse in cryoprotectant solution at 4°C for 3 to 5 days.
Tissue slicing and storage
-
17
Cut 40-μm thick slices using a freezing microtome, or by adding dry ice to the receptacle of a regular microtome, or by vibratome.
-
18
Collect the sections in cryotube vials (we use 12 cryotubes per brain) filled with cryoprotectant solution.
-
19
Store at −80°C until use.
PREPARATION OF CELLS TO BE USED FOR PLA
Described below is a protocol to fix and permeabilize cells prior to conducting a PLA as described in either Basic Protocol 2 or Basic Protocol 4.
Materials
Cells endogenously expressing individual receptor protomers or co-expressing the two protomers being investigated
Cell growth medium, e.g.:
F12 medium (Life Technologies, cat. no. 11765-054) containing 10% FBS (BioTC, cat. no. FBS-01) and penicillin-streptomycin (Corning, cat. no. 30-002-CI) for CHO cells
DMEM (Corning Cellgro, cat. no. 10-013-CV) containing 10% FBS (BioTC, cat. no. FBS-01) and penicillin-streptomycin (Corning, cat. no.30-002-CI) for HEK-293 cells
Poly-D-lysine (Sigma-Aldrich; Cat. No. P6407)
4% paraformaldehyde (see recipe)
1× phosphate-buffered saline (1× PBS; see recipe for 10×)
1× PBS containing 20 mM glycine
1× PBS containing 20 mM glycine and 0.05% Triton-X-100
Sterile 16-well Lab-Tek chamber slide with cover glass slide (Thermo Scientific, cat. no. 178599).
Leica TCS SP5 confocal laser scanning microscope (405 nm laser line for DAPI, 568 nm laser line for Detection Reagent Red)
Plate cells
-
1Plate 1000 to 3000 cells/well in 200 μl growth medium (amount of cells depends on growth rate) of a 16-well sterile Lab-Tek chamber slide.Alternatively, cells can be plated on coverslips placed in 24-well tissue culture plates. However, given that the amount of PLA reagents provided by the company is limited and expensive, the use of coverslips could increase experimental costs, technical difficulties (coverslips are fragile and tend to air dry fast), and time taken to conduct the experiment. Therefore, it is recommended that cells be plated in a 16-well sterile Lab-Tek chamber slide.If using cells that easily detach, such as HEK-293, the wells should be coated with poly-D-lysine (5 mg in 50 ml sterile water; Sigma-Aldrich, cat. no. P6407) prior to addition of cells. To this end, add 100 μl of poly-D-lysine solution to coat the well, incubate for 5 min, aspirate the solution, and wash the wells three times with 200 μl sterile water. Air dry the wells for 2 hr before plating the cells.
-
2
On the following day, check the morphology of the cells under a light microscope. If they show a normal morphology (i.e., spread out and not rounded), proceed to the steps described below. Otherwise, give the cells another 24 hr to spread out.
Fix cells
-
3
Aspirate the medium by suction and rinse the cells two to three times, each time with 200 μl of 1× PBS.
-
4
Fix the cells with 200 μl 4% paraformaldehyde for 15 min.
-
5
Rinse cells twice, each time with 200 μl of 1× PBS.
-
6
Rinse cells in 200 μl 1× PBS containing 20 mM glycine for 10 min.
Permeabilize cells
-
7
Permeabilize cells with 200 μl 1× PBS containing 20 mM glycine and 0.05% Triton X-100 for 12 min.
-
8
Rinse cells twice with 200 μl 1× PBS containing 20 mM glycine.
-
9
Proceed with the PLA protocol (Basic Protocol 2 or Basic Protocol 4).
CONJUGATION OF PRIMARY ANTIBODIES TO OLIGONUCLEOTIDE PROBES PLUS OR MINUS
Described below is a protocol to directly conjugate the primary protomer-selective antibodies with oligonucleotide probes PLUS or MINUS. This is to be done when the primary antibodies are raised in the same species or when one or both antibodies are hosted in species other than mouse, rabbit, or goat, the only species used for generating commercial PLA probes. In such cases, one of the antibodies (e.g., to protomer A) is labeled with the PLUS probe while the other antibody (e.g., to protomer B) is labeled with the MINUS probe, or vice versa.
Materials
Primary antibodies to each receptor protomer at a concentration of 1 mg/ml in 1× PBS.
Duolink In Situ Probemaker PLUS kit (Sigma-Aldrich, cat. no. DUO92009): the box includes conjugation buffer (green lid), stop reagent (red lid), and storage solution (blue lid)
Duolink In Situ Probemaker MINUS kit (Sigma-Aldrich, cat. no. DUO92010): the box includes conjugation buffer (green lid), stop reagent (red lid), and storage solution (blue lid)
0.2-ml PCR tubes (Thermo Scientific cat. no. AB0337)
- Add 20 μl of the primary antibody against each receptor protomer to a separate PCR tube.If the antibody concentration is >1 mg/ml, dilute it in 1× PBS. Do not use solutions containing bovine serum albumin as diluents. Lower concentrations of antibodies can be used for conjugation as long as the final amount of antibody is 20 μg.
Add 2 μl of commercial conjugation buffer (green lid) to each tube and mix.
Add one antibody solution to the Duolink In Situ Probemaker PLUS vial and the other antibody solution to the Duolink In Situ Probemaker MINUS vial.
Leave overnight (stirring is not required) at room temperature.
The next day, add 2 μl of the Stop reagent (red lid) and incubate for 30 min at room temperature (no stirring is required).
Add 24 μl of the Storage solution (blue lid) and store at 4°C for up to 1 month.
IMAGE ACQUISITION AND DATA ANALYSIS
The PLA signal, which is sub-micrometer in size, is detected as colored spots, with the color depending on the fluorophore employed. Each spot represents a single interaction of the two proteins of interest. A confocal microscope should be used to capture the images, especially in tissue. It is also recommended that at least three tissue slices per condition be used from three individual animals. For experiments with cells, triplicate wells should be used for each condition, with the experiment repeated on three separate occasions. Compared to a fluorescence microscope, the confocal microscope produces a higher out-of-focus discrimination (i.e., higher resolution) and allows for imaging a thin slice out of a thick specimen, facilitating the signal count throughout the entire cell. However, it can be difficult to distinguish individual PLA signals when high amounts of interacting proteins are present. In this case, the use of Z-stacking during confocal microscopy can facilitate the visualization of individual PLA signals. Z-stacking is the acquisition of images at different distances with subsequent merging to yield a composite image that gives a greater depth of field. Post-acquisition analysis (described below) can also solve this problem. Blurred signal is due to out-of-focus PLA spots or technique background, especially when tissue is being studied. Keep the settings (gain, offset, pinhole and Z-stack) constant for every experiment.
Materials
ImageJ, 64-bit
Iterative Deconvolve 3-D plugin (http://www.optinav.com/Iterative-Deconvolve-3D.htm)
Images from the above protocols
Deconvolution analysis
Using this post-image acquisition process it is possible to reverse the optical distortion that takes place by using the microscope, thus creating clearer images. The freely available ImageJ64 software can assist in deconvoluting captured images.
-
1aInstall the free Iterative Deconvolve 3-D plugin (http://www.optinav.com/Iterative-Deconvolve-3D.htm) by copying the entire Iterative Deconvolve 3D.java file into the Plugins folder within the ImageJ folder on your computer. Re-start ImageJ after plugin installation.The Iterative Deconvolve 3-D plugin appears under the Plugins menu.
-
2a
Open the image you want to deconvolve. Channels need to be split, as each should be deconvolved separately. Select Image > Color > Split Channels (these single grayscale images are 8-bit size each) (Fig. 2.16.7A).
-
3a
Select Plugin > Iterative Deconvolve 3D. A new window opens with several options (Fig. 2.16.7B). Click on the grayscale image you want to deconvolute in ImageJ and select Normalize PSF, Show Iteration. A new window will open with the number of Iteration steps. Then, select the maximum number of iterations (we usually apply 1 to 3 iterations for each PLA signal channel) and click OK.
-
4a
After the channels have been deconvolved, select Image > Color > Merge Channels. A new window will open. Select the grayscale image that corresponds to each channel and click OK (see Fig. 2.16.7C).
-
5aClick on Image > Type, select RGB color, and then click Save.Shown in Figure 2.16.8 is the image of the PLA signal for a receptor heteromer in a mouse brain tissue slice before and after deconvolution analysis.
Figure 2.16.7.
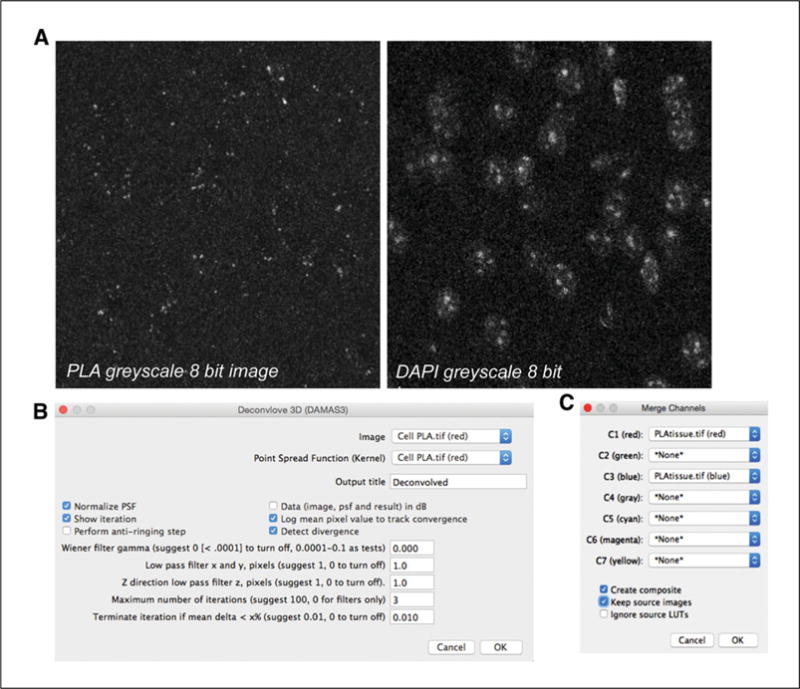
Screenshots of image deconvolution analysis using ImageJ software. (A) Grayscale 8-bit images obtained in ImageJ after splitting the original image before deconvolution. (Left Panel) Grayscale PLA signal. (Right Panel) Grayscale DAPI signal. (B) Screenshot in ImageJ showing selection of 3 iterations for the red channel (PLA signal). (C) Screenshot in ImageJ showing the merge channels tool. Selection of the channels that correspond to the deconvolved grayscale images will merge the channels into a color image.
Figure 2.16.8.
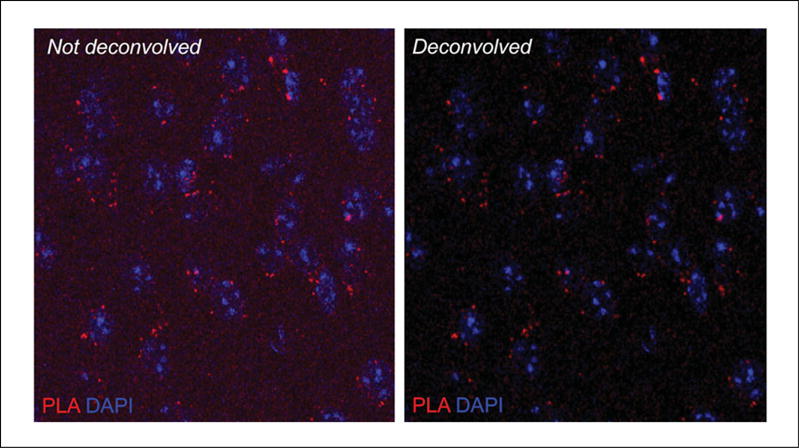
Image of the PLA signal (red channel) for a receptor heteromer in a mouse brain tissue slice before (Left Panel) and after (Right Panel) deconvolution analysis. Nuclei visualized with DAPI staining (blue channel).
PLA signal quantification
There are many ways of quantifying the PLA signal. Sigma-Aldrich has software (Duolink Image Tool) to quantify the PLA signal. Described here is an automated way (no plugin required) to quantify the PLA signal using the free software ImageJ64. Because high-magnification images are required to quantify the PLA signal, it is recommend that images be captured at 40× magnification. Following image acquisition, crop every individual cell and save as individual files. The better the images, the better the quantification. It is best to image at least 30 cells per experiment so a parametric tests can be used for statistical analysis. While tedious, this approach makes counting of PLA dots accurate. To use ImageJ64 software for analysis:
-
1b
Open the image to be counted (single cell, see Fig. 2.16.9A) and select Image > Color > Split channels and the grayscale PLA channel.
-
2b
Select Image > Adjust > Threshold to highlight the dots for counting.
-
3bUse the sliders or “set” button to type in a known range of pixel intensities and click Apply (see Fig. 2.16.9B). Keep settings constant for every image.A new window with a two pixel intensities image (black and white) will be created (Fig. 2.16.9C).
-
4b
As shown on Figure 2.16.9C, dots of different sizes are obtained. It is possible some will not be counted because they are too small or too large. By selecting Process > Binary > Watershed you can adjust the size of dots to be counted.
-
5b
Go to Analyze > Analyze Particles. A new window will open with some options (Fig. 2.16.9D) for where the size limits for your dots can be set; otherwise, the program will count everything. Modify the numbers until you obtain the desired size.
-
6bSelect Show > Outlines (to show the dots counted). Once one dot size is defined, is must be kept constant for all the images. Then, Click OK.Two new windows open (Fig. 2.16.9E,F). One window shows the counted dots as numbered outlines (each dot is outlined and given a number), with the Summary window providing data, such as the name of the image, number of dots, and the total area or average size for every cell studied.
Figure 2.16.9.
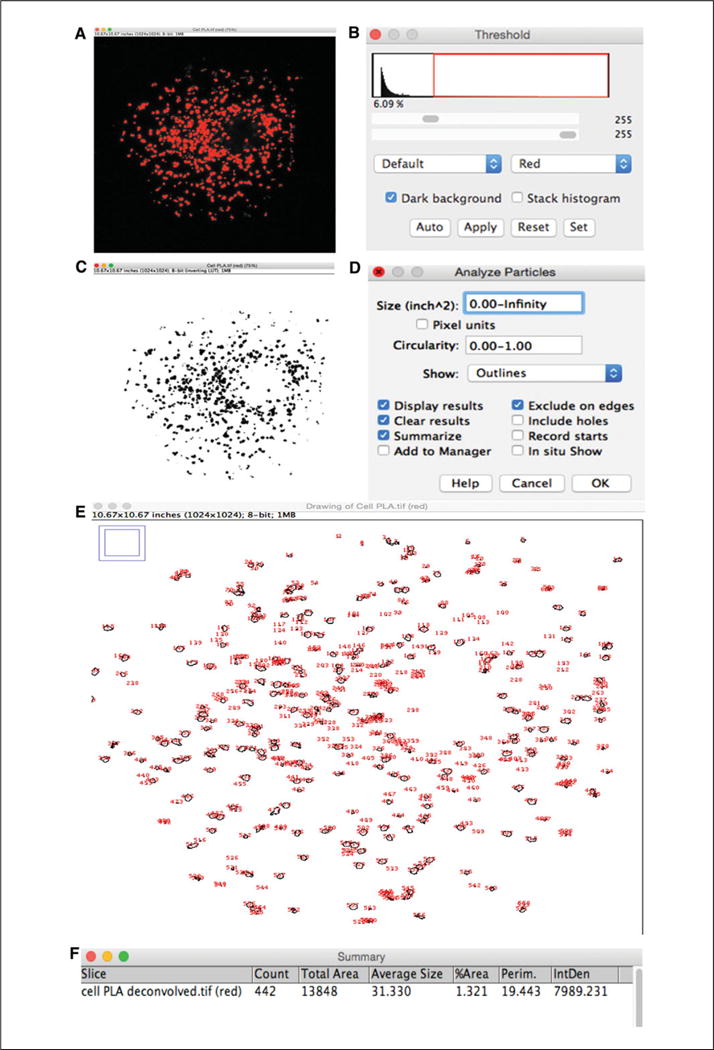
Screenshots of PLA signal analysis using the ImageJ software. (A) Screenshot of pixel intensities to be counted. Pixel intensity image shows the dots to be counted by subtracting background according to the desired threshold set as described in B. (B) Screenshot showing how to set the threshold for the PLA signal we want to count by using the sliders. (C) Screenshot of a two pixel intensity image. Binary version of the pixel intensity picture (A) with two intensities; black and white. (D) Screenshot showing selection of the desired size (inches or pixels) of the PLA signal to be counted. By selecting 0.00-Infinity, every dot listed in the two pixel intensity image is counted. (E) Screenshot of PLA dots as numbered outlines. Every red number corresponds to an individual dot counted by the program in an individual cell. (F) Screenshot of summary window results for every cell counted. This provides information about the name of the image and data such as number of dots, total area, or average size of dots for every cell counted.
REAGENTS AND SOLUTIONS
Use deionized, distilled water in all recipes and protocol steps unless otherwise specified. For common stock solutions, see APPENDIX 2A.
Amplification solution
Prepare a 1:5 dilution of the amplification reagent (from the Duolink In Situ Detection Reagent Red kit, Sigma-Aldrich, cat. no. DUO92008; stored at −20°) and 1:80 dilution of the polymerase (from that same kit; stored at −20°C) in MilliQ water. Prepare fresh.
For fluorophores different from Red check the Sigma-Aldrich Web site..
Cryoprotectant solution
20 ml DMSO
200 ml glycerol
244 ml 0.4 M sodium phosphate buffer, pH 7.4 (APPENDIX 2A)
536 ml double-distilled water
Store up to 6 months at 4°C
Ligation solution
Prepare a 1:5 dilution of ligation reagent (from the Duolink In Situ Detection Reagent Red kit, Sigma-Aldrich, cat. no. DUO92008; stored at −20°C) and 1:40 dilution of ligase (from the same kit; stored at −20°C) in MilliQ water. Prepare fresh.
For fluorophores different from Red check the Sigma-Aldrich Web site.
Paraformaldehyde, 4%
4 g paraformaldehyde powder
10 ml of 10× PBS (see recipe)
80 ml double-distilled water
Heat the mixture to 55° to 60°C while stirring, add 2 drops of 10 M NaOH and filter the solution through a Nalgene Rapid-FLow 0.2-μm bottle-top filter (cat. no. 73521-000) attached to a 1-liter bottle. Adjust the pH to 7.6, and place in ice until use. Prepare fresh.
Phosphate buffered saline (PBS), 10×
3.45 g NaH2PO4
8.55 g Na2HPO4
83 g NaCl
Dissolve in 800 ml of distilled water
Adjust the pH to 7.4 using 12 N HCl
Make up the volume with distilled water to 1 liter
Store indefinitely at room temperature
To prepare 1× PBS solution, add 900 ml of distilled water to 100 ml of 10× PBS.
PLA Buffer A
If commercially purchased (part of Duolink In Situ Wash Buffer Fluorescence kit; Sigma-Aldrich), dissolve the packet provided and make up to to 1 liter with MilliQ water.
To prepare in the laboratory, combine:
1.2 g Tris base
8.8 g NaCl
0.5 ml Tween 20
Dissolve in 800 ml MilliQ water. Adjust the pH to 7.4 with 12 N HCl. Make up the volume to 1 liter with MilliQ water. Filter the solution through a 0.22-μm filter. Store at 4°C for up to 1 month. Bring the buffer to room temperature before use.
PLA Buffer B
If commercially purchased (part of Duolink In Situ Wash Buffer Fluorescence kit; Sigma-Aldrich), dissolve the packet provided and make up to to 1 liter with MilliQ water.
To prepare in the laboratory, combine:
4.24 g Tris base
26 g Tris hydrochloride
5.84 g NaCl
Dissolve in 800 ml MilliQ water. Adjust the pH to 7.5 with 12 N HCl. Make up to 1 liter with MilliQ water. Filter the solution through a 0.22-μm filter. Store at 4°C for up to 1 month. Bring the buffer to room temperature before use.
PLA buffer B, 0.01×
Dilute PLA Buffer B (see recipe) 1: 100 with MilliQ water.
Ringer’s solution, 10× stock
85 g NaCl
2.5 g KCl
2 g NaH2CO3
Dissolve in 800 ml of distilled water
Make up the volume to 1 liter
Store up to 6 months at room temperature
Sodium citrate solution, 10 mM, containing 0.05%Tween 20
Dissolve 2.94 g sodium citrate in 800 ml distilled water. Adjust the pH to 6 with 12 N HCl. Add 0.5 ml Tween 20 and make up the volume to 1 liter with distilled water. Prepare fresh on day of the experiment.
Sudan Black B, 0.1%, in 70% ethanol solution
Add 100 mg of Sudan Black B to 100 ml of 70% ethanol solution. Cover the container and stir overnight at room temperature. Prepare fresh on day of the experiment. Filter the solution through a 0.22-μm filter prior to use.
COMMENTARY
Background information
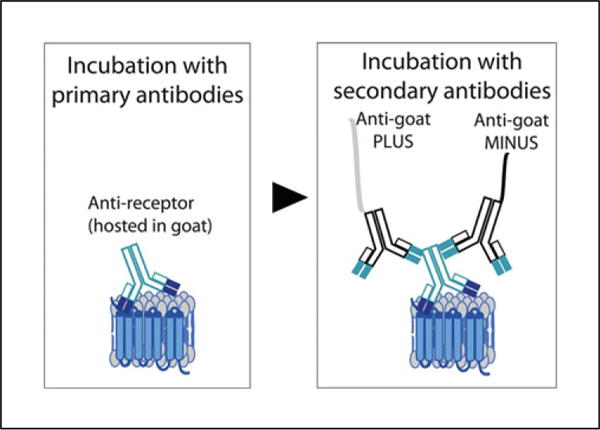
The in situ proximity ligation assay (PLA) was first described by Fredriksson et al. (2002) to detect extremely low levels of platelet derived growth factor in biological samples. Since then, the technique has been used not only to detect and measure single endogenous proteins, but also to detect protein-protein interactions and post-translational modifications such as protein phosphorylation (Jarvius et al., 2007; Pinto et al., 2012; Leuchowius et al., 2013). Because the technique requires that the two proteins being investigated be less than 17 nm apart (Trifilieff et al., 2011), it is useful for demonstrating the presence of receptor heteromers in endogenous system, as this short distance indicates that the two receptor protomers are in close enough proximity for direct interactions. There are many adaptations of this technique used for detecting the presence of receptor heteromers in endogenous systems. As described in this unit, direct or indirect PLA can be used to detect the presence of receptor heteromers in endogenous tissue. Our lab has generated a number of heteromer-selective antibodies (Gupta et al., 2010; Rozenfeld et al., 2011; Berg et al., 2012; Bushlin et al., 2012) that are being explored in combination with PLA to detect heteromers in endogenous tissue. An approach that is under consideration is the use of single-recognition PLA (Fig. 2.16.10) to increase the signal-to-noise ratio and to quantify the signal obtained using the heteromer-selective antibodies. With this approach, tissue slices or cells can be incubated with the heteromer-selective antibody as described in the indirect PLA protocol, and the next day a combination of anti-mouse PLA probes PLUS and MINUS can be used as secondary antibodies (Fig. 2.16.10). Compared in Figure 2.16.11 are immunohistofluorescence (IHF) and single-recognition PLA using heteromer-selective antibodies in a mouse slice. As shown, the signal obtained with the single-recognition PLA is more discrete than in IHF.
Figure 2.16.10.
Schematic of single recognition PLA. In this modification of the PLA protocol, samples are incubated with an antibody that recognizes a single receptor protomer, followed by incubation with species specific PLA probes (i.e., a mixture of secondary antibodies coupled to oligonucleotides PLUS along with antibodies coupled to oligonucleotides MINUS).
Figure 2.16.11.
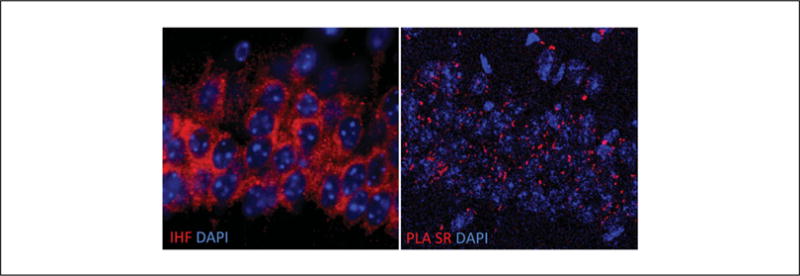
Comparison of immunohistofluorescence staining (Left Panel) and single recognition PLA (Right Panel) signals in a mouse brain slice using the same heteromer-selective antibody.
Efforts are also underway to combine regular immunocytofluorescence (ICF) or IHF protocols for markers of different subcellular compartments with PLA to determine subcellular localization of receptor heteromers in endogenous systems. Although this approach is not routinely employed, it was used to detect the presence of PKCζ-Bcl10 interacting complexes within the nuclear envelope of cells (Pacchiana et al., 2014). Three things must be considered to conduct immunostaining with PLA: (i) that PLA is an antibody-based technique so the third antibody to be used in ICF or IHF should be raised in a species different from the protomer selective antibodies; thus, if antibodies raised in rabbit and mouse are used for PLA, a chicken, camel, or goat/sheep should be used for immunostaining; (ii) as the PLA protocol gives two signals, blue for DAPI and second color that depends on the fluorophore used in the amplification step, the channels used must be taken into account—because we typically use Red fluorophore (Texas Red analog) for the PLA signal, colors other than red and blue have to be used for ICF or IHF; (iii) inasmuch as the PLA procedure might fade the signal of the previous immunostaining assay, the ICF or IHF protocols may have to be modified. We find that adding the third antibody (diluted to the desired dilution in 1× antibody diluent solution) to the primary PLA antibody solution and addition of a fluorescently labeled secondary antibody that recognizes the species to which the third antibody was raised to the PLA probe solution (indirect PLA protocol) allows for the detection of the subcellular localization of the heteromer being investigated. Shown in Figure 2.16.12 is a representative image of a cell expressing BacMam 2.0 (a plasma membrane marker), and shown in Figure 2.16.13 are cells treated with a cytoskeletal marker (phalloidin conjugated to Alexa Fluor 488; a high-affinity filamentous actin probe) on which indirect PLA was performed to detect a receptor heteromer. Thus, similar approaches using markers for different intracellular compartments for which antibodies are available could be used in combination with PLA to determine the subcellular localization of a given receptor heteromer. In the case of brain slices, a combination of immunodetection of previously injected neurotracers to selectively trace specific neurons and PLA was used to detect receptor heteromers in the labeled neurons (Sierra et al., 2015). In addition, PLA was used in combination with electron microscopy to detect the ultrastructural localization of the receptor heteromer under investigation (Sierra et al., 2015). Given the versatility of the PLA technique, it should be possible to use a combination of heteromer-selective antibodies and antibodies to different signaling molecules to identify signaling complexes associated with the receptor heteromer at the cell surface.
Figure 2.16.12.
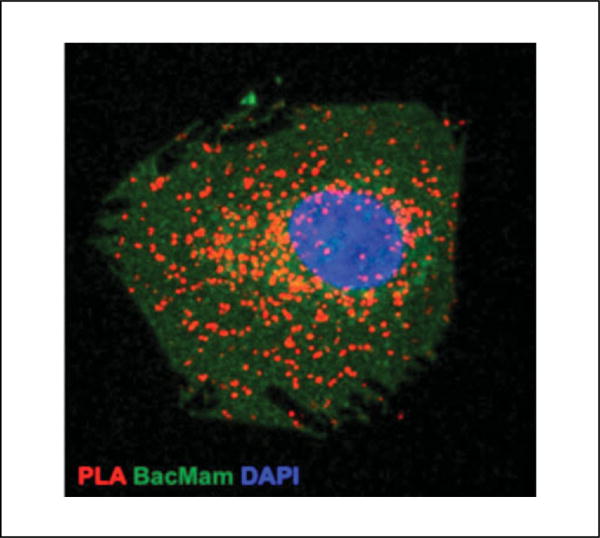
Indirect PLA for a receptor heteromer (red dots) in a cell expressing BacMam 2.0 (green) to label the plasma membrane where the nuclei were stained with DAPI (blue).
Figure 2.16.13.
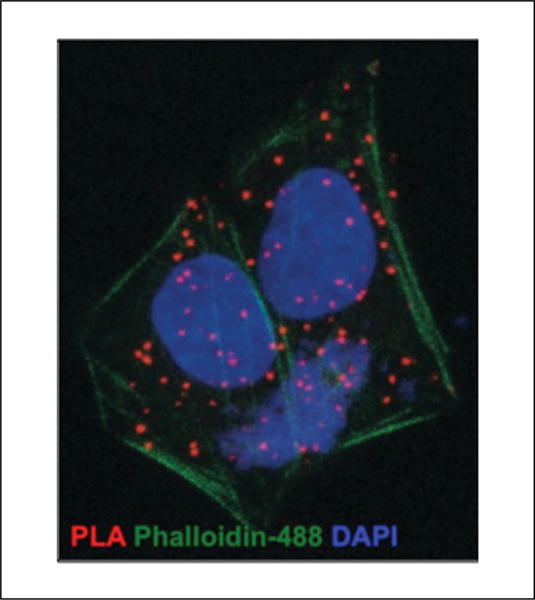
Indirect PLA for a receptor heteromer (red dots) in cells stained with Phalloidin-488 (green) to label actin filaments and the nuclei with DAPI (blue).
This technology can also be employed in a drug-discovery program. The PLA could be used to identify drugs that increase or decrease heteromer levels. This could be accomplished using cell lines stably expressing the heteromer of interest, and, as controls, cells stably expressing only one of the receptor protomers. Cells expressing the heteromer and cells expressing individual receptor protomers would be plated on the same 384-well plate and treated with the drug candidates, fixed and permeabilized as described in Support Protocol 2, and, processed for either indirect or direct PLA. Cells would then be imaged with an imaging system such as the IN Cell Analyzer 2200 (GE Healthcare), which is capable of detecting DAPI nuclear staining as well as the red PLA signal. This imaging system has the software needed to identify individual cells and to quantify the number of PLA signal dots within the cell. In addition, the system can image tissue sections and could potentially be used to detect PLA signals in tissue sections. Thus, in the absence of the known drug or drug candidate, a PLA signal would be detected only in cells expressing the heteromer—with the addition of the test substance either increasing, decreasing, or having no effect on the PLA signal in these cells. They should have no effect in cells expressing individual protomers. A limitation of using PLA in drug discovery would be the number of drug candidates that could be screened at any given time using either cells or tissue sections, given the labor-intensive nature of the assay. An automated PLA technology would make possible high-throughput screening of allosteric compounds that disrupt heteromer formation.
Critical Parameters
As PLA is an antibody-based technique, as with any immunostaining protocol a number of controls are needed. Many of the controls used for immunostaining can also be used for PLA (reviewed in Burry, 2011). The most critical controls are those that demonstrate that the primary antibodies are selective only for the protomer being investigated. This can be accomplished by first testing for protomer selectivity by immunofluorescence (IF) in cells (immunocytofluorescence, ICF), tissue (immunohistofluorescence, IHF), or both (see http://www.cellsignal.com/common/content/content.jsp?id=if). The antibodies should recognize the protomer of interest only in cells or tissue sections in which it is expressed. Controls for studies demonstrating antibody selectivity would involve cells that do not express the protomer of interest, cells where the gene for the protomer of interest has been knocked-out using CRISPR-Cas9 technology, tissue sections from regions that do not express the receptor of interest, or cells from animals that lack the receptor. Also, during the PLA experiment to determine the proximity of the two receptors, slices or cells from animals lacking one of the receptor protomers should be processed in parallel as negative controls. Additional controls should be included to demonstrate that the PLA probes specifically label the primary antibody. In this case, PLA is performed in the absence or presence of the primary antibodies. In addition, if the primary antibody is raised in the same species as the tissue/cell (e.g., mouse anti-receptor in mouse tissue), it is important to demonstrate that the PLA probes, such as the donkey anti-mouse, do not recognize tissue endogenous IgG. It can be concluded that the probes recognize endogenous IgG when a signal is observed using only the PLA probes. The solution to this problem is to conjugate the primary antibody with the probemaker so that PLA probes are not used.
Before proceeding to the PLA experiment, the conditions for binding of the primary antibodies towards cells or tissues expressing the protomers being investigated need to be optimized so they are used for the two primary antibodies. With regard to the location of the epitopes recognized by the two primary antibodies, they can both be at the N-terminus or at the C-terminus, or one can be at the N-terminus and the other the C-terminus. We have successfully used an antibody that recognizes the N-terminal epitope of one receptor protomer and a second antibody that recognizes a C-terminal epitope on the other receptor protomer to detect the presence of GPR171 and GPR83 heteromers (Gomes et al., 2016b).
Troubleshooting
The main problems encountered with PLA assays are the absence of a PLA signal or the presence of a high background that compromises data analysis. Listed in Table 2.16.1 are some troubleshooting tips for overcoming problems encountered with PLA assays.
Table 2.16.1.
Troubleshooting Tips for PLA
| Problem | Causes | Solutions |
|---|---|---|
| No PLA signal | Tissue slice/cells dried out during the assay | Use a hydrophobic pen to draw a line around the sample to keep the reagent there; do not allow cells do dry out |
| Protein levels to be detected might be low | Increase the concentration of primary antibodies | |
| Commercial blocking solution and/or 1× antibody did diluent solution not work | Use the blocking/antibody diluent solutions normally used for immunofluorescence with the antibodies | |
| High background | High concentration of primary antibodies | Decrease primary antibody concentration |
| Amplification carried out for longer time | Do not exceed 100 min for the amplification step | |
| Microscope settings need to be adjusted | Do not overexpose the sample to light; use a confocal microscope | |
| Presence of dust, fixative, or salt precipitation (fluorescent particles) | Use new reagents and add additional washes with new wash solutions; change the blocking solution; make certain there are no autofluorescent particles in the sample (e.g., lipofuscin) | |
| Wash buffers improperly prepared | Follow the recipe as described (e.g., do not use Tris base instead of Tris hydrochloride) | |
| Poor animal perfusion | Use tissue from another animal | |
| Tissue slice is too thick | Use thinner slices (40-μm or less) or use confocal microscopy to adjust Z-stack | |
| Primary antibodies conjugated with PLA riboprobes fail to work | Design experiments to use the entire amount of primary antibodies linked to PLA riboprobes or store them at 4°C for a short period of time (less than 1 week) |
Anticipated Results
The PLA signal will appear in the form of red dots if using red fluorophore, with each dot corresponding to the presence of a single heteromer. The size of the dot is dependent on whether or not the amplification step goes to completion or the presence of multimeric arrays. Advances in PLA technology permitting the use of multiple PLA probes coupled to fluorophores could help clarify this issue.
In experiments using tissue slices, the nuclei are stained blue by DAPI and there is a PLA signal in the form of red dots only within cells co-expressing both protomers of interest. In cells not expressing both protomers or only expressing one of them, nuclear staining but no PLA signal would be detected (Fig. 2.16.3). In addition, only nuclear staining but no PLA signal would be detected in controls using knockout tissue. Controls should be included where one of the primary antibodies is omitted or where only secondary antibodies but no primary antibodies are used.
Like experiments using cells endogenously expressing the heteromer being investigated, a PLA signal in the form of red dots (if using red fluorophore) is found only in cells co-expressing both receptor protomers (Fig. 2.16.14). No or few PLA signals are observed in the absence of primary antibodies or in cells lacking one of the receptor protomers compared to cells coexpressing both receptor protomers (Fig. 2.16.14).
Figure 2.16.14.
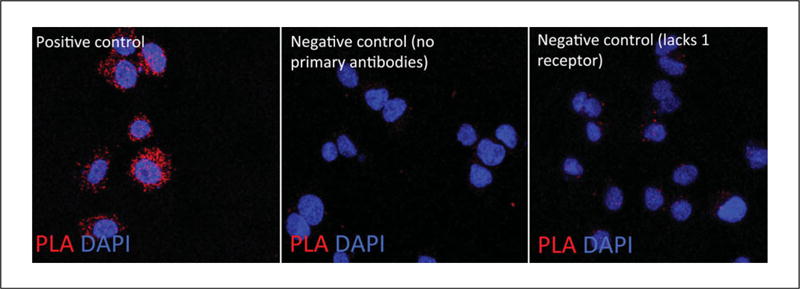
Controls for indirect PLA performed in cells. (Left Panel) PLA performed in cells expressing the heteromer of interest. (Middle Panel) PLA performed in the absence of primary antibodies. (Right Panel) PLA performed in cells lacking one of the receptor protomers.
Time Considerations
Detailed below are the time considerations for a PLA experiment from tissue processing to image analysis.
Tissue processing
Once the buffers are freshly prepared, the anesthesia, perfusion, and brain extraction require an average of 30 min per animal. Cutting the tissue sections requires ~20 min per brain.
PLA (cells and tissue)
Once cells or tissue slices are ready, 2 days are needed to perform the PLA experiment. If combined with subcellular markers, an additional day is required for regular immunofluorescence.
Image acquisition
Image acquisition on a confocal microscope can take 1 to 3 hr depending on the number of samples being imaged.
Post-imaging analysis
Once the image is acquired, deconvolution analysis takes 2 to 3 min per image (10 to 20 cells per picture). Dot counting requires approximately 2 to 3 min per cell.
Acknowledgments
This work was supported by National Institute Health Awards DA008863 and NS026880 to L.A.D. S.S.’s salary is supported by a grant from Alfonso Martin Escudero Foundation. Human tissue was provided by Dr. Marco Hefti (Department of Pathology at Mount Sinai Hospital, New York City). Microscopy analysis was performed at the Microscopy CORE at the Icahn School of Medicine at Mount Sinai. Figures 2.16.1, 2.16.2, 2.16.6, and 2.16.10 were composed using the Motifolio.com PPT Drawing Toolkits Biology Bundle. Post-imaging analysis was performed with ImageJ64 [version 1.48]. We would like to show our gratitude to Elvira Roda for sharing her wisdom on fixative solution recipes.
Footnotes
Conflicts of Interest
The authors declare no conflict of interest.
Literature Cited
- Akgun E, Javed MI, Lunzer MM, Smeester BA, Beitz AJ, Portoghese PS. Ligands that interact with putative MOR-mGluR5 heteromer in mice with inflammatory pain produce potent antinociception. Proc Natl Acad Sci USA. 2013;110:11595–11599. doi: 10.1073/pnas.1305461110. [DOI] [PMC free article] [PubMed] [Google Scholar]
- Albizu L, Cottet M, Kralikova M, Stoev S, Seyer R, Brabet I, Roux T, Bazin H, Bourrier E, Lamarque L, Breton C, Rives ML, Newman A, Javitch J, Trinquet E, Manning M, Pin JP, Mouillac B, Durroux T. Time-resolved FRET between GPCR ligands reveals oligomers in native tissues. Nat Chem Biol. 2010;6:587–594. doi: 10.1038/nchembio.396. [DOI] [PMC free article] [PubMed] [Google Scholar]
- Baba K, Benleulmi-Chaachoua A, Journe AS, Kamal M, Guillaume JL, Dussaud S, Gbahou F, Yettou K, Liu C, Contreras-Alcantara S, Jockers R, Tosini G. Heteromeric MT1/MT2 melatonin receptors modulate photoreceptor function. Sci Signal. 2013;6:ra89. doi: 10.1126/scisignal.2004302. [DOI] [PMC free article] [PubMed] [Google Scholar]
- Berg KA, Rowan MP, Gupta A, Sanchez TA, Silva M, Gomes I, McGuire BA, Portoghese PS, Hargreaves KM, Devi LA, Clarke WP. Allosteric interactions between delta and kappa opioid receptors in peripheral sensory neurons. Mol Pharmacol. 2012;81:264–272. doi: 10.1124/mol.111.072702. [DOI] [PMC free article] [PubMed] [Google Scholar]
- Bhushan RG, Sharma SK, Xie Z, Daniel DJ, Portoghese PS. A bivalent ligand (KDN-21) reveals spinal delta and kappa opioid receptors are organized as heterodimers that give rise to delta(1) and kappa(2) phenotypes. Selective targeting of delta-kappa heterodimers. J Med Chem. 2004;47:2969–2972. doi: 10.1021/jm0342358. [DOI] [PubMed] [Google Scholar]
- Brizzee KR, Ordy JM, Kaack B. Early appearance and regional differences in intraneuronal and extraneuronal lipofuscin accumulation with age in the brain of a nonhuman primate (Macaca mulatta) J Gerontol. 1974;29:366–381. doi: 10.1093/geronj/29.4.366. [DOI] [PubMed] [Google Scholar]
- Burry RW. Controls for immunocytochemistry: An update. J Histochem Cytochem. 2011;59:6–12. doi: 10.1369/jhc.2010.956920. [DOI] [PMC free article] [PubMed] [Google Scholar]
- Bushlin I, Gupta A, Stockton SD, Jr, Miller LK, Devi LA. Dimerization with cannabinoid receptors allosterically modulates delta opioid receptor activity during neuropathic pain. PLoS One. 2012;7:e49789. doi: 10.1371/journal.pone.0049789. [DOI] [PMC free article] [PubMed] [Google Scholar]
- Comps-Agrar L, Kniazeff J, Norskov-Lauritsen L, Maurel D, Gassmann M, Gregor N, Prézeau L, Bettler B, Durroux T, Trinquet E, Pin JP. The oligomeric state sets GABA(B) receptor signalling efficacy. EMBO J. 2011;30:2336–2349. doi: 10.1038/emboj.2011.143. [DOI] [PMC free article] [PubMed] [Google Scholar]
- Cottet M, Albizu L, Comps-Agrar L, Trinquet E, Pin JP, Mouillac B, Durroux T. Time resolved FRET strategy with fluorescent ligands to analyze receptor interactions in native tissues: Application to GPCR oligomerization. Methods Mol Biol. 2011;746:373–387. doi: 10.1007/978-1-61779-126-0_21. [DOI] [PubMed] [Google Scholar]
- Cottet M, Faklaris O, Falco A, Trinquet E, Pin JP, Mouillac B, Durroux T. Fluorescent ligands to investigate GPCR binding properties and oligomerization. Biochem Soc Trans. 2013;41:148–153. doi: 10.1042/BST20120237. [DOI] [PubMed] [Google Scholar]
- Daniels DJ, Lenard NR, Etienne CL, Law PY, Roerig SC, Portoghese PS. Opioid-induced tolerance and dependence in mice is modulated by the distance between pharmacophores in a bivalent ligand series. Proc Natl Acad Sci USA. 2005;102:19208–19213. doi: 10.1073/pnas.0506627102. [DOI] [PMC free article] [PubMed] [Google Scholar]
- Donovan J, Brown P. Parenteral injections. Curr Protoc Immunol. 2006;73:1.6.1–1.6.10. doi: 10.1002/0471142735.im0106s73. [DOI] [PubMed] [Google Scholar]
- Erbs E, Faget L, Scherrer G, Matifas A, Filliol D, Vonesch JL, Koch M, Kessler P, Hentsch D, Birling MC, Koutsourakis M, Vasseur L, Veinante P, Kieffer BL, Massotte D. A mu-delta opioid receptor brain atlas reveals neuronal co-occurrence in subcortical networks. Brain Struct Funct. 2015;220:677–702. doi: 10.1007/s00429-014-0717-9. [DOI] [PMC free article] [PubMed] [Google Scholar]
- Ferre S, Baler R, Bouvier M, Caron MG, Devi LA, Durroux T, Fuxe K, George SR, Javitch JA, Lohse MJ, Mackie K, Milligan G, Pfleger KD, Pin JP, Volkow ND, Waldhoer M, Woods AS, Franco R. Building a new conceptual framework for receptor heteromers. Nat Chem Biol. 2009;5:131–134. doi: 10.1038/nchembio0309-131. [DOI] [PMC free article] [PubMed] [Google Scholar]
- Fredriksson S, Gullberg M, Jarvius J, Olsson C, Pietras K, Gustafsdottir SM, Ostman A, Landegren U. Protein detection using proximity-dependent DNA ligation assays. Nat Biotechnol. 2002;20:473–477. doi: 10.1038/nbt0502-473. [DOI] [PubMed] [Google Scholar]
- Gage GJ, Kipke DR, Shain W. Whole animal perfusion fixation for rodents. J Vis Exp. 2012:e3564. doi: 10.3791/3564. [DOI] [PMC free article] [PubMed] [Google Scholar]
- Gomes I, Wardman JH, Stockton SDJ, Devi LA. Morgan & Claypool Life Sciences. Vol. 4. San Rafael, Calif: 2013a. Neuropeptide Receptors; pp. 1–153. [Google Scholar]
- Gomes I, Fujita W, Chandrakala MV, Devi LA. Disease-specific heteromerization of G-protein-coupled receptors that target drugs of abuse. Prog Mol Biol Transl Sci. 2013b;117:207–265. doi: 10.1016/B978-0-12-386931-9.00009-X. [DOI] [PMC free article] [PubMed] [Google Scholar]
- Gomes I, Fujita W, Gupta A, Saldanha SA, Negri A, Pinello CE, Eberhart C, Roberts E, Filizola M, Hodder P, Devi LA. Identification of a mu-delta opioid receptor heteromer-biased agonist with antinociceptive activity. Proc Natl Acad Sci USA. 2013c;110:12072–12077. doi: 10.1073/pnas.1222044110. [DOI] [PMC free article] [PubMed] [Google Scholar]
- Gomes I, Ayoub MA, Fujita W, Jaeger WC, Pfleger KDG, Devi LA. G protein-coupled receptor heteromers. Annu Rev Pharmacol Toxicol. 2016a;56:403–425. doi: 10.1146/annurev-pharmtox-011613-135952. [DOI] [PMC free article] [PubMed] [Google Scholar]
- Gomes I, Bobeck EN, Margolis EB, Gupta A, Sierra S, Fakira AK, Fujita W, Müller TD, Müller A, Tschöp MH, Kleinau G, Fricker LD, Devi LA. Identification of GPR83 as the receptor for the abundant neuroendocrine peptide PEN. Sci Signal. 2016b;9:ra43. doi: 10.1126/scisignal.aad0694. [DOI] [PMC free article] [PubMed] [Google Scholar]
- Gonzalez S, Rangel-Barajas C, Peper M, Lorenzo R, Moreno E, Ciruela F, Borycz J, Ortiz J, Lluís C, Franco R, McCormick PJ, Volkow ND, Rubinstein M, Floran B, Ferré S. Dopamine D-4 receptor, but not the ADHD-associated D-4.7 variant, forms functional heteromers with the dopamine D-2S receptor in the brain. Mol Psychiatry. 2012;17:650–662. doi: 10.1038/mp.2011.93. [DOI] [PMC free article] [PubMed] [Google Scholar]
- Gupta A, Mulder J, Gomes I, Rozenfeld R, Bushlin I, Ong E, Lim M, Maillet E, Junek M, Cahill CM, Harkany T, Devi LA. Increased abundance of opioid receptor heteromers after chronic morphine administration. Sci Signal. 2010;3:ra54. doi: 10.1126/scisignal.2000807. [DOI] [PMC free article] [PubMed] [Google Scholar]
- He SQ, Zhang ZN, Guan JS, Liu HR, Zhao B, Wang HB, Lu YJ, Bao L, Zhang X. Facilitation of mu-opioid receptor activity by preventing delta-opioid receptor-mediated codegradation. Neuron. 2011;69:120–131. doi: 10.1016/j.neuron.2010.12.001. [DOI] [PubMed] [Google Scholar]
- Hiller C, Kuhhorn J, Gmeiner P. Class A G-protein-coupled receptor (GPCR) dimers and bivalent ligands. J Med Chem. 2013;56:6542–6559. doi: 10.1021/jm4004335. [DOI] [PubMed] [Google Scholar]
- Hounsou C, Margathe JF, Oueslati N, Belhocine A, Dupuis E, Thomas C, Mann A, Ilien B, Rognan D, Trinquet E, Hibert M, Pin JP, Bonnet D, Durroux T, Mann A, Ilien B, Rognan D, Trinquet E, Hibert M, Pin JP, Bonnet D, Durroux T. Time-resolved FRET binding assay to investigate hetero-oligomer binding properties: Proof of concept with dopamine D1/D3 heterodimer. ACS Chem Biol. 2015;10:466–474. doi: 10.1021/cb5007568. [DOI] [PubMed] [Google Scholar]
- Jaeger WC, Armstrong SP, Hill SJ, Pfleger KD. Biophysical detection of diversity and bias in GPCR function. Front Endocrinol. 2014;5:26. doi: 10.3389/fendo.2014.00026. [DOI] [PMC free article] [PubMed] [Google Scholar]
- Jarvius M, Paulsson J, Weibrecht I, Leuchowius KJ, Andersson AC, Wahlby C, Gullberg M, Botling J, Sjöblom T, Markova B, Ostman A, Landegren U, Söderberg O. In situ detection of phosphorylated platelet-derived growth factor receptor beta using a generalized proximity ligation method. Mol Cell Proteomics. 2007;6:1500–1509. doi: 10.1074/mcp.M700166-MCP200. [DOI] [PubMed] [Google Scholar]
- Journe AS, Habib SAM, Dodda BR, Morcos MNF, Sadek MS, Tadros SAA, Witt-Enderby P, Jockers R, Zlotos DP. N1-linked melatonin dimers as bivalent ligands targeting dimeric melatonin receptors. Medchemcomm. 2014;5:792–796. doi: 10.1039/c4md00079j. [DOI] [Google Scholar]
- Kabli N, Nguyen T, Balboni G, O’Dowd BF, George SR. Antidepressant-like and anxiolytic-like effects following activation of the mu-delta opioid receptor heteromer in the nucleus accumbens. Mol Psychiatry. 2014;19:986–994. doi: 10.1038/mp.2013.115. [DOI] [PubMed] [Google Scholar]
- Kaczor AA, Selent J. Oligomerization of G protein-coupled receptors: Biochemical and biophysical methods. Curr Med Chem. 2011;18:4606–4634. doi: 10.2174/092986711797379285. [DOI] [PubMed] [Google Scholar]
- Lenard NR, Daniels DJ, Portoghese PS, Roerig SC. Absence of conditioned place preference or reinstatement with bivalent ligands containing mu-opioid receptor agonist and delta-opioid receptor antagonist pharmacophores. Eur J Pharmacol. 2007;566:75–82. doi: 10.1016/j.ejphar.2007.02.040. [DOI] [PubMed] [Google Scholar]
- Leuchowius KJ, Clausson CM, Grannas K, Erbilgin Y, Botling J, Zieba A, Landegren U, Söderberg O. Parallel visualization of multiple protein complexes in individual cells in tumor tissue. Mol Cell Proteomics. 2013;12:1563–1571. doi: 10.1074/mcp.O112.023374. [DOI] [PMC free article] [PubMed] [Google Scholar]
- Liu XY, Liu ZC, Sun YG, Ross M, Kim S, Tsai FF, Li QF, Jeffry J, Kim JY, Loh HH, Chen ZF. Unidirectional cross-activation of GRPR by MOR1D uncouples itch and analgesia induced by opioids. Cell. 2011;147:447–458. doi: 10.1016/j.cell.2011.08.043. [DOI] [PMC free article] [PubMed] [Google Scholar]
- Moreno JL, Holloway T, Gonzalez-Maeso J. G protein-coupled receptor hetero-complexes in neuropsychiatric disorders. Prog Mol Biol Transl Sci. 2013;117:187–205. doi: 10.1016/B978-0-12-386931-9.00008-8. [DOI] [PMC free article] [PubMed] [Google Scholar]
- Moreno JL, Muguruza C, Umali A, Mortillo S, Holloway T, Pilar-Cuellar F, Mocci G, Seto J, Callado LF, Neve RL, Milligan G, Sealfon SC, López-Giménez JF, Meana JJ, Benson DL, González-Maeso J. Identification of three residues essential for 5-hydroxytryptamine 2A-metabotropic glutamate 2 (5-HT2A.mGlu2) receptor heteromerization and its psychoactive behavioral function. J Biol Chem. 2012;287:44301–44319. doi: 10.1074/jbc.M112.413161. [DOI] [PMC free article] [PubMed] [Google Scholar]
- O’Dowd BF, Ji X, O’Dowd PB, Nguyen T, George SR. Disruption of the mu-delta opioid receptor heteromer. Biochem Biophys Res Commun. 2012;422:556–560. doi: 10.1016/j.bbrc.2012.05.023. [DOI] [PubMed] [Google Scholar]
- Pacchiana R, Abbate M, Armato U, Dal Pra I, Chiarini A. Combining immunofluorescence with in situ proximity ligation assay: A novel imaging approach to monitor protein-protein interactions in relation to subcellular localization. Histochem Cell Biol. 2014;142:593–600. doi: 10.1007/s00418-014-1244-8. [DOI] [PubMed] [Google Scholar]
- Pei L, Li S, Wang M, Diwan M, Anisman H, Fletcher PJ, Nobrega JN, Liu F. Uncoupling the dopamine D1-D2 receptor complex exerts antidepressant-like effects. Nat Med. 2010;16:1393–1395. doi: 10.1038/nm.2263. [DOI] [PubMed] [Google Scholar]
- Pinto R, Carvalho AS, Conze T, Magalhaes A, Picco G, Burchell JM, Taylor-Papadimitriou J, Reis CA, Almeida R, Mandel U, Clausen H, Söderberg O, David L. Identification of new cancer biomarkers based on aberrant mucin glycoforms by in situ proximity ligation. J Cell Mol Med. 2012;16:1474–1484. doi: 10.1111/j.1582-4934.2011.01436.x. [DOI] [PMC free article] [PubMed] [Google Scholar]
- Rozenfeld R, Gupta A, Gagnidze K, Lim MP, Gomes I, Lee-Ramos D, Nieto N, Devi LA. AT1R-CB(1)R heteromerization reveals a new mechanism for the pathogenic properties of angiotensin II. EMBO J. 2011;30:2350–2363. doi: 10.1038/emboj.2011.139. [DOI] [PMC free article] [PubMed] [Google Scholar]
- Sevigny LM, Austin KM, Zhang P, Kasuda S, Koukos G, Sharifi S, Covic L, Kuliopulos A. Protease-activated receptor-2 modulates protease-activated receptor-1-driven neointimal hyperplasia. Arterioscler Thromb Vasc Biol. 2011;31:e100–106. doi: 10.1161/ATVBAHA.111.238261. [DOI] [PMC free article] [PubMed] [Google Scholar]
- Sierra S, Luquin N, Rico AJ, Gomez-Bautista V, Roda E, Dopeso-Reyes IG, Vázquez A, Martínez-Pinilla E, Labandeira-García JL, Franco R, Lanciego JL. Detection of cannabinoid receptors CB1 and CB2 within basal ganglia output neurons in macaques: Changes following experimental parkinsonism. Brain Struct Funct. 2015;220:2721–2738. doi: 10.1007/s00429-014-0823-8. [DOI] [PMC free article] [PubMed] [Google Scholar]
- Trifilieff P, Rives ML, Urizar E, Piskorowski RA, Vishwasrao HD, Castrillon J, Schmauss C, Slättman M, Gullberg M, Javitch JA. Detection of antigen interactions ex vivo by proximity ligation assay: Endogenous dopamine D2-adenosine A2A receptor complexes in the striatum. Biotechniques. 2011;51:111–118. doi: 10.2144/000113719. [DOI] [PMC free article] [PubMed] [Google Scholar]
- Vardanyan R, Kumirov VK, Nichol GS, Davis P, Liktor-Busa E, Rankin D, Varga E, Vanderah T, Porreca F, Lai J, Hruby VJ. Synthesis and biological evaluation of new opioid agonist and neurokinin-1 antagonist bivalent ligands. Bioorg Med Chem. 2011;19:6135–6142. doi: 10.1016/j.bmc.2011.08.027. [DOI] [PMC free article] [PubMed] [Google Scholar]
- Weibrecht I, Leuchowius KJ, Clausson CM, Conze T, Jarvius M, Howell WM, Kamali-Moghaddam M, Söderberg O. Proximity ligation assays: A recent addition to the proteomics toolbox. Expert Rev Proteomics. 2010;7:401–409. doi: 10.1586/epr.10.10. [DOI] [PubMed] [Google Scholar]
- Yamamoto T, Nair P, Davis P, Ma SW, Navratilova E, Moye S, Tumati S, Lai J, Vanderah TW, Yamamura HI, Porreca F, Hruby VJ. Design, synthesis, and biological evaluation of novel bifunctional C-terminal-modified peptides for delta/mu opioid receptor agonists and neurokinin-1 receptor antagonists. J Med Chem. 2007;50:2779–2786. doi: 10.1021/jm061369n. [DOI] [PMC free article] [PubMed] [Google Scholar]
- Yekkirala AS, Lunzer MM, McCurdy CR, Powers MD, Kalyuzhny AE, Roerig SC, Portoghese PS. N-naphthoyl-beta-naltrexamine (NNTA), a highly selective and potent activator of mu/kappa-opioid heteromers. Proc Natl Acad Sci USA. 2011;108:5098–5103. doi: 10.1073/pnas.1016277108. [DOI] [PMC free article] [PubMed] [Google Scholar]
- Yuan Y, Arnatt CK, El-Hage N, Dever SM, Jacob JC, Selley DE, Hauser KF, Zhang Y. A bivalent ligand targeting the putative mu opioid receptor and chemokine receptor CCR5 heterodimers: Binding affinity versus functional activities. Medchemcomm. 2013;4:847–851. doi: 10.1039/c3md00080j. [DOI] [PMC free article] [PubMed] [Google Scholar]