

Abstract
Introduction
Blood transfusion is one of the most common medical procedures during hospitalization in the United States. To understand the benefits of transfusion while mitigating potential risks, a multicenter database containing detailed information on transfusion incidence and recipient outcomes would facilitate research.
Methods
The Recipient Epidemiology and Donor Evaluation Study-III (REDS-III) program has developed a comprehensive transfusion recipient database utilizing data from hospital electronic health records at 12 participating hospitals in four geographic regions. Transfused inpatient and outpatient data from January 1, 2013 until December 31, 2014 included patient age, sex, ethnicity, primary diagnosis, type of blood product provided, issue location, pre- and post-transfusion hemoglobin, and hospital outcomes. Transfusion incidence per encounter was calculated by blood product and various patient characteristics.
Results
During the two-year study period, 80,362 (12.5%) inpatient encounters involved transfusion. Among inpatients, the most commonly transfused blood products were red cells (10.9% of encounters), followed by platelets (3.2%), and plasma (2.9%). Among transfused patients, the median number of red-cell units was one, pre-transfusion hemoglobin was 7.6 g/dL, and hemoglobin increment/unit was 1.4 g/dL. Encounter mortality increased with patient age, number of units transfused, and the use of platelet or plasma products. The most common reported transfusion reaction was febrile non-hemolytic.
Conclusion
The REDS-III recipient database contains comprehensive data regarding transfusion use and patient outcomes. This report describes an evaluation of the first two years of a planned four-year linked blood donor-component-recipient database which represents a critical new resource for transfusion medicine researchers.
Keywords: Transfusion Practices, Red cell transfusion, Blood Management, Transfusion incidence
Introduction
Transfusion of human-derived blood products is essential to life for many clinical conditions, making it one of the most common medical procedures for inpatient hospitalizations in the United States. The study of transfusion practice presents challenges to investigators whose subjects, treatments, and duration of follow-up are often heterogeneous. Access to detailed clinical data for large numbers of transfused patient populations from geographically diverse health care institutions may allow for a more refined characterization of transfusion medicine (TM) practice and consequent outcomes in the United States.
The use of large databases that extract data from various independent sources are becoming more common in TM, but examples of well-validated TM-focused databases are few. Key advantages of databases of this type include the ability to do observational studies that are sufficiently large to allow both detailed risk assessment and subgroup analyses.1,2 Databases of this type can also assist clinical trial or observational study design by informing enrollment projections and timelines rather than conducting pilot studies.2 One of the most successful recent examples is the Scandinavian Donations And Transfusions database (SCANDAT).2 In its most current form, SCANDAT contains donation and transfusion data on 3.7 million unique persons with lengthy follow-up derived from linkage to national registries.2 This database has been used to determine the risk for recipient mortality based on both red cell storage and donor age,3,4 to determine the risk for gastric cancer based on ABO blood group,5 to elucidate the inverse relationship between donor mortality and donation frequency,6 and to clarify the partial genetic heritability of blood donation tendencies between monozygotic and dizygotic twins.7 Despite its utility, SCANDAT is limited by a lack of granular clinical data, such as comprehensive laboratory values, medications, vital signs, and issue locations, which reduces its usefulness in some studies.
In the United States, a few large transfusion recipient-focused databases have been created to explore blood management strategies and specific transfusion-related adverse events or populations: examples include those from Johns Hopkins, the Mayo Clinic, Kaiser Permanente Northern California, and Medicare.8,9,10,11,12 However, each of these databases is limited due to either finite inpatient clinical data or limitation to a single institution or region.
To address these limitations, over the past six years the National Heart, Lung, and Blood Institute (NHLBI) Recipient Epidemiology and Donor Evaluation Study-III (REDS-III: see appendix) has developed and validated a linked donor-component-transfusion recipient database.2 This database combines recipient, blood component, and donor information from four major blood centers and 12 community and academic hospitals in the United States.13 The REDS-III Transfusion Recipient Database specifically utilizes and combines clinical and laboratory patient data from multiple distinct inpatient and outpatient electronic records for both transfused and non-transfused individuals and is the subject of this report. A study using a piloted version of this database was able to show both over-utilization and inadequate dosing of plasma transfusions based on a correlation with pre- and post-transfusion coagulation laboratory values.14
This report aims to: 1) describe the methods employed in creating this database and ensuring its quality; 2) present broad statistics on transfusion utilization using two years of transfusion inpatient and outpatient recipient data gathered from this new national resource; and 3) define the database’s breadth and depth of scope that will be used in future REDS-III analyses.
Materials and Methods
Database structure
The infrastructure of the REDS-III Domestic Program has been described previously.13 In brief, four large U.S. blood centers (located in Connecticut, Pennsylvania, Wisconsin, and California) serve as “hubs” with “spokes” comprised of selected hospitals including a mix of large academic medical centers and smaller community-based hospitals. IRB approval was obtained by each participating entity and the data coordinating center (DCC). Data collected in the REDS-III transfusion recipient database are subject to the NHLBI Policy for Data Sharing from Clinical Trials and Epidemiological Studies,15 for eventual release as a public use data set.
Data were extracted at the hospital level and harmonized at the hub level using a codebook developed by the REDS-III program. Data was reviewed and revised between hub blood centers and hospital partners until the data extracted for the period met program codebook standards. Cleaned data from multiple hospitals were then aggregated at the hub for transmission to the DCC. Data were encrypted with secure FIPS 140-2 encryption schemes and transmitted to the DCC’s enhanced security network (ESN). Once at the DCC, data were maintained on secure servers hosted by Research Triangle International’s (RTI) ESN.
The transfusion recipient database itself is comprised of 18 relational tables with data from individual inpatient and outpatient encounters, laboratory diagnostics, clinical care interventions, and health outcomes of interest (Figure 1). Data were extracted on a quarterly basis and individual patient encounters were extracted into the database only after the patient had been discharged. Each hospital system preserved patient privacy using an “honest broker” system, namely by transforming medical record numbers or other identifiers into a new numeric string that served as a local primary key with the linkage retained by the provider. Consequently, individual patients may be tracked within a hospital, or in some cases a hospital grouping, but not across hubs. Core clinical data were included for all inpatient encounters during the study period and more detailed clinical data were included for encounters involving a blood transfusion (Supplemental Figure 1). Patient- and encounter-level data consisted of hospital medical records, diagnosis codes, laboratory data, and transfusion service data. Outpatient data were included only from patient encounters with a type-and-screen, type-and-crossmatch, and/or transfusion. Outpatients who did not receive a transfusion, type-and-screen, or type-and-crossmatch, but were admitted to the hospital within 45 days of an outpatient encounter were also included in the dataset.
Figure 1. Relational schematic representation of the REDS-III Recipient Outcomes Database design.
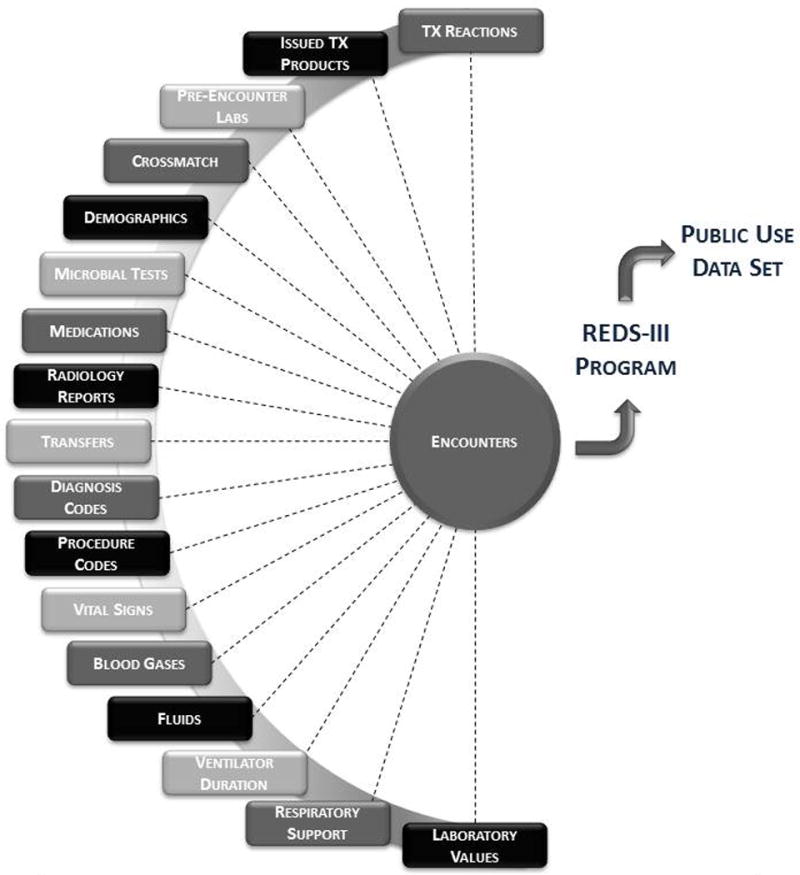
Each box represents a table within which reside data elements available for analysis. The completeness of each table depended on patient encounter type and transfusion history.
The quality control process involved a regular review of comprehensive quarterly reports for each of the relational table data files by a central working group consisting of an investigator from each hub and the DCC. Data for each quarter were compared to one or more prior quarters for consistency. A quality control manual was maintained documenting identified quality issues and associated resolutions.
Study Variables
The present analysis includes data collected from the recipient database over the calendar years 2013–2014, although the database will eventually contain linked blood donor, component manufacturing, and transfusion recipient information over a four-year period from January 1, 2013 through December 31, 2016. Data analysis took place in SAS/STAT software Version 9.4 of the SAS System for Windows.
For this study, a hospital encounter was defined as a unique patient medical event with recorded dates and times of admission and discharge. For each inpatient and outpatient hospital encounter, associated demographic variables (sex, age, race/ethnicity), in-hospital location and transfers, primary diagnosis, patient outcome (death or no death) and transfusion information (type of unit, number of units, transfusion adverse reactions, and issue location), were recorded. Patients could have more than one encounter during the study interval. To categorize patient admitting diagnoses and comorbidities, International Classification of Diseases, Ninth Revision (ICD-9), diagnosis codes were converted to Health Care Utilization Project (HCUP, http://www.ahrq.gov/data/hcup) single-level and multilevel Clinical Classifications Software categories.8 Transfusion reactions were recorded at each hospital according to passive reporting, namely reactions voluntarily reported to the transfusion service by practitioners. These reactions were then evaluated and diagnosed by the attending blood bank physician using standard hemovigilance diagnostic criteria. Transfusion reaction data were captured and entered into the database in a standard format using the NHSN/CDC Hemovigilance reporting module either through exchanges with NHSN/CDC participating hospitals, through the AABB Patient Safety Organization via data transfer agreement, or through direct upload of online forms completed by the hospital.16
A transfusion episode was defined as all transfused units of a particular type provided within a continuous four-hour period as defined by transfusion issue date and time, and a transfusion dose was defined as the number of units provided in one episode (a platelet dose was either one apheresis platelet or a single pool of whole-blood derived platelets). To evaluate the association between hemoglobin (Hgb) thresholds for issue location and primary diagnosis, the pre-transfusion Hgb for each transfusion episode was defined as the most proximate Hgb level within 24 hours of red cell transfusion. The post-transfusion Hgb was defined as the next proximate Hgb value identified after the last red cell unit was given for a transfusion episode within 24 hours of that transfusion. Only transfusions with both a pre- and post-transfusion Hgb were used for analyses involving these variables.
Statistical analysis
Categorical variables were summarized as frequencies with percentages, and continuous variables were summarized as means with standard deviations or medians with interquartile ranges (IQRs) as appropriate. Counts and frequencies were calculated both overall and by subgroup. In a small minority of cases (< 3%), encounters could be counted more than once, namely when an encounter had more than one primary diagnosis listed, transfusions were issued to more than one location per encounter, or more than one transfusion product type was provided per encounter (the encounter would be counted toward the tally of total encounters for each issued product type). Overall and subgroup-specific transfusion incidence were calculated for inpatient encounter variables where applicable and was calculated as the number of encounters with a transfusion divided by the number of encounters overall or per subgroup (whether a transfusion was issued or not) for that recipient variable. Incidence of outpatient transfusions could not be calculated as all outpatient encounters were not recorded in this database. Encounter inpatient mortality was calculated as the number of encounters including a patient death divided by the total number of encounters of the same type (i.e. number of male patient encounters who received a red cell and died divided by all male encounters where a red cell was issued).
Results
Hospital Characteristics
This retrospective patient database includes data from 12 academic and community hospitals including five Level I trauma centers. The hospitals range in size from 177 to 1500 beds and included hospitals on the East coast (5 hospitals), Midwest (4 hospitals), and West coast (3 hospitals). Subspecialty practice was also well represented with subspecialty surgery, subspecialty ICUs, and neonatology units being present in 100%, 83%, and 50% of reporting hospitals, respectively.
Inpatient Transfusions
During the two-year study period, our inpatient cohort included 641,751 total inpatient encounters, of which 80,362 (12.5%) involved a transfusion. Inpatients were most likely to receive a red cell unit (10.9% of inpatient encounters involved a red cell transfusion), followed by platelets (3.2%), and plasma (2.9%) (Table 1). Inpatient transfusion encounters most often consisted of two units of red cells, two units of plasma, or one dose of platelets. Encounters involving any transfusion were 4–6 days longer (9–11 days, IQR 5–21 days) depending on the product transfused than those that did not involve a transfusion (4 days, IQR: 3–6 days). Common primary HCUP diagnoses where blood products were most commonly provided included blood diseases (highest incidence for red cell and platelet use), infectious diseases (highest incidence for plasma use), neoplasms, cardiovascular diseases, gastrointestinal disease, and injury (Table 1). Lastly, about one-half of all transfused units (n=517,708) were issued to the general wards (overall: 47.1% of all issued transfusions, red cell use: 52.8%, platelet use: 41.1%, plasma use: 32.1%), followed by the ICU (25.7% overall) and the OR (19.8% overall) (data not shown).
Table 1. Transfusions by patient demographics and clinical characteristics for inpatient and outpatient encounters.
Incidence is calculated for inpatients only (in parentheses), and represents the percent of encounters with a transfusion by demographic variable, or row percent. The percent incidence for the number of units transfused uniquely uses the total number of encounters where a specific blood product was provided as the denominator, rather than the total number of encounters by row category. Encounters where more than one blood product type was provided were included in the count totals for each product type issued. (RBC=red blood cells transfused alone or in combination with other products, PLT=platelet transfused alone or in combination with other products, PLS=plasma transfused alone or in combination with other products, NO Txn=no units given).
| Inpatient Encounters (N=641,751) | Outpatient Encounters (N=106,758) | ||||||||
|---|---|---|---|---|---|---|---|---|---|
|
| |||||||||
| Demographics | RBC | PLT | PLS | NO Txn | RBC | PLT | PLS | NO Txn | |
|
| |||||||||
| TOTAL | 69,726 (10.9) | 20,509 (3.2) | 18,573 (2.9) | 561,398 (87.5) | 25,939 | 11,629 | 1,404 | 71,240 | |
|
| |||||||||
| SEX | Male | 33,599 (10.9) | 12,190 (3.9) | 10,693 (3.5) | 268,513(87.0) | 12,562 | 6,726 | 721 | 34,582 |
| Female | 36,116 (10.9) | 8,316 (2.5) | 7,879 (2.4) | 292,590(87.9) | 13,377 | 4,903 | 683 | 36,657 | |
|
| |||||||||
| AGE | Neonate/infant (<1) | 987 (2.6) | 493 (1.3) | 548 (1.4) | 37,472(97.0) | 131 | 38 | 15 | 137 |
| Child/adolescent (1–20) | 2,129 (6.5) | 914 (2.8) | 510 (1.6) | 30,492(92.7) | 1,373 | 805 | 45 | 1,862 | |
| 21–49 | 13,150 (7.5) | 3,608 (2.1) | 3,259 (1.9) | 159,967(91.9) | 4,916 | 2,160 | 510 | 18,471 | |
| 50–69 | 28,789 (12.8) | 9,494 (4.2) | 7,780 (3.5) | 191,644(85.3) | 10,479 | 5,597 | 563 | 32,696 | |
| 70+ | 24,669 (14.4) | 5,999 (3.5) | 6,476 (3.8) | 141,787(83.1) | 9,041 | 3,029 | 265 | 18,075 | |
|
| |||||||||
| RACE/ETHNICITY | White, non-Hispanic | 46,123 (11.6) | 14,317 (3.6) | 12,608 (3.2) | 345,224(86.5) | 17,828 | 9,238 | 922 | 51,151 |
| Black, non-Hispanic | 10,358 (10.4) | 1,757 (1.8) | 1,945 (2.0) | 88,188(88.7) | 4,279 | 631 | 248 | 8,380 | |
| Hispanic | 4,831 (8.9) | 1,710 (3.1) | 1,326 (2.4) | 48,792(89.9) | 1,430 | 838 | 64 | 4,349 | |
| Asian | 1,659 (12.1) | 610 (4.5) | 484 (3.5) | 11,806(86.3) | 739 | 373 | 38 | 1,067 | |
| Other | 6,755 (9.0) | 2,115 (2.8) | 2,212 (2.9) | 67,379(89.5) | 1,663 | 549 | 132 | 6,293 | |
|
| |||||||||
| PRIMARY DIAGNOSIS | Blood disease | 4,795 (55.9) | 1,280 (14.9) | 238 (2.8) | 3,447(40.2) | 8,206 | 1,913 | 247 | 2,435 |
| Circulatory | 10,504 (11.1) | 4,664 (5.0) | 4,240 (4.5) | 81,087(86.1) | 671 | 79 | 181 | 2,338 | |
| Gastrointestinal | 8,633 (15.6) | 1,848 (3.3) | 3,022 (5.5) | 45,495(82.2) | 303 | 189 | 88 | 1,370 | |
| Genitourinary | 2,463 (9.8) | 276 (1.1) | 411 (1.6) | 22,503(89.4) | 323 | 39 | 52 | 1,287 | |
| Infectious | 5,594 (19.4) | 1,705 (5.9) | 1,882 (6.5) | 22,482(77.9) | 108 | 87 | 22 | 163 | |
| Injury or fracture | 11,761 (16.6) | 3,307 (4.7) | 3,600 (5.1) | 56,706(80.2) | 280 | 119 | 165 | 1,158 | |
| Musculoskeletal | 4,772 (11.1) | 530 (1.2) | 769 (1.8) | 37,780(88.1) | 210 | 27 | 11 | 3,935 | |
| Neoplasm | 8,835 (19.1) | 3,416 (7.4) | 1,697 (3.7) | 36,204(78.4) | 7,013 | 5,367 | 45 | 8,257 | |
| Respiratory | 2,716 (6.9) | 528 (1.3) | 639 (1.6) | 36,122(92.2) | 71 | 34 | 18 | 236 | |
| Other | 11,064 (4.6) | 3,360 (1.4) | 2,413 (1.0) | 226,834(94.7) | 8,790 | 3,778 | 581 | 50,098 | |
|
| |||||||||
| UNITS PER ENCOUNTER | 1 unit | 18,403 (26.4) | 8,667 (42.2) | 2,523 (13.6) | N/A | 10,038 | 10,763 | 186 | N/A |
| 2 units | 24,122 (34.6) | 4,856 (23.7) | 6,160 (33.2) | N/A | 13,619 | 762 | 414 | N/A | |
| 3–4 units | 14,574 (20.9) | 3,202 (15.6) | 4,684 (25.2) | N/A | 1,246 | 78 | 362 | N/A | |
| 5–8 units | 7,925 (11.4) | 1,985 (9.7) | 2,927 (15.8) | N/A | 790 | 20 | 143 | N/A | |
| >8 units | 4,702 (6.7) | 1,799 (8.8) | 2,281 (12.3) | N/A | 246 | 6 | 299 | N/A | |
|
| |||||||||
| ENCOUNTER DURATION | Median days (IQR) | 9 (5,16) | 11 (6,21) | 10 (6,19) | 4 (3,6) | N/A | N/A | N/A | N/A |
When evaluating transfusion incidence by encounter, no marked differences were observed by sex or race/ethnicity, but black non-Hispanic patients did have a slightly lower incidence of plasma or platelet transfusions, and Hispanic patients had slight lower incidence of red cell transfusions (Table 1). Transfusion incidence did increase with patient age, and transfusion incidence, when stratified by age, was similar in male and female inpatients (Figure 2). In males, most transfusion encounters occurred in the 60–69 year age group (14,131 encounters, mean age = 66 years), and transfusion incidence was highest for 80–89 year olds (21.5%). Similarly, transfusion encounters were most common for females aged 60–69 years (12,741 encounters, mean age = 69 years), and transfusion incidence was highest at age 70–79 years (20.6%). Transfusion incidence generally followed a bimodal distribution with incidence peaks at 2–5 years and 70–89 years.
Figure 2. Inpatient transfusion incidence per encounter (%) by products received, age, and sex (A. male, B. female).
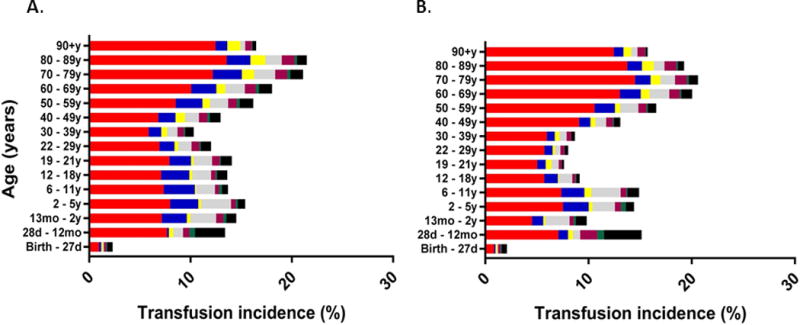
(red cells only=red, platelets only=blue, plasma only=yellow, red cells and platelets=grey, red cells and plasma=purple, platelets and plasma=green, all products=black).
Table 2 shows the inpatient encounters where the patient died. The overall inpatient mortality for those receiving any transfusion was 6.9%, which was markedly higher than in patients who did not receive a transfusion during their hospital encounters (1.4%). Mortality was notably higher for encounters where a platelet (12.6%) or a plasma unit (14.8%) was transfused either alone or in combination with other products, in comparison to red cell use alone or with other products (6.6%). No marked mortality differences were observed by sex or race/ethnicity, but mortality was slightly higher in black, non-Hispanic, patients when a plasma (15.7%) or platelet unit (15.7%) was provided. Mortality increased with age and was highest at the extremes (<1 year, >70 years) for each blood product type. Mortality also increased with increasing blood use, with mortality exceeding 20% when more than eight units of any one product type were transfused and with specific diagnoses (i.e. when infection or respiratory illness was the primary diagnosis).
Table 2. Number of deaths and mortality per inpatient encounter, according to patient demographics and clinical characteristics.
Mortality is shown as a percent in parentheses where applicable. The overall inpatient mortality for those receiving any transfusion was 6.9% (5,545 encounter deaths/80,362 encounters), and for those who did not receive a transfusion was 1.4% (7,624 encounter deaths/561,398 encounters). Encounters with mortality where more than one blood product type was provided were included in the counts for each product type issued. (RBC=red blood cells transfused alone or in combination with other products, PLT=platelet transfused alone or in combination with other products, PLS=plasma transfused alone or in combination with other products, NO Txn=no units given).
| Number of deaths (% mortality) | |||||
|---|---|---|---|---|---|
|
| |||||
| Demographics | RBC | PLT | PLS | NO Txn | |
|
| |||||
| ALL ENCOUNTERS | 69,726 | 20,509 | 18,573 | 561,398 | |
|
| |||||
| TOTAL DEATHS | 4,580 (6.6) | 2,758 (12.6) | 2,758 (14.8) | 7,624 (1.4) | |
|
| |||||
| SEX | Male | 2,553 (7.6) | 1,537 (12.6) | 1,581 (14.8) | 4,086 (1.5) |
| Female | 2,024 (5.6) | 1,052 (12.7) | 1,175 (14.9) | 3,520 (1.2) | |
|
| |||||
| Neonate/infant (<1) | 121 (12.3) | 88 (17.8) | 91 (16.6) | 188 (0.5) | |
| Child/adolescent (1–20) | 72 (3.4) | 47 (5.1) | 42 (8.2) | 56 (0.2) | |
| AGE | 21–49 | 649 (4.9) | 387 (10.7) | 423 (13.0) | 577 (0.4) |
| 50–69 | 1,923 (6.7) | 1,171 (12.3) | 1,165 (15.0) | 2,365 (1.2) | |
| 70+ | 1,813 (7.3) | 897 (15.0) | 1,035 (16.0) | 4,436 (3.1) | |
|
| |||||
| White, non-Hispanic | 2,997 (6.5) | 1,713 (12.0) | 1,816 (14.4) | 5,171 (1.5) | |
| Black, non-Hispanic | 575 (5.6) | 275 (15.7) | 305 (15.7) | 834 (0.9) | |
| RACE/ETHNICITY | Hispanic | 292 (6.0) | 181 (10.6) | 173 (13.0) | 422 (0.9) |
| Asian | 120 (7.2) | 70 (11.5) | 65 (13.4) | 225 (1.9) | |
| Other | 596 (8.8) | 352 (16.6) | 399 (18.0) | 972 (1.4) | |
|
| |||||
| Blood disease | 489 (5.5) | 283 (8.3) | 212 (12.5) | 736 (2.0) | |
| Circulatory | 890 (8.5) | 567 (12.2) | 576 (13.6) | 2,268(2.8) | |
| Gastrointestinal | 492 (5.7) | 265 (14.3) | 371 (12.3) | 330 (0.7) | |
| Genitourinary | 92 (3.7) | 41 (14.9) | 48 (11.7) | 205 (0.9) | |
| PRIMARY DIAGNOSIS | Injury or fracture | 737 (6.3) | 484 (14.6) | 507 (14.1) | 645 (1.1) |
| Infectious | 1,055 (18.9) | 529 (31.0) | 633 (33.6) | 1,404 (6.2) | |
| Musculoskeletal | 50 (1.0) | 20 (3.8) | 24 (3.1) | 50 (0.1) | |
| Neoplasm | 66 (1.4) | 46 (3.6) | 20 (8.4) | 13 (0.4) | |
| Respiratory | 353 (13.0) | 132 (25.0) | 153 (23.9) | 1,082 (3.0) | |
| Other | 435 (3.9) | 265 (7.9) | 258 (10.7) | 1,161 (0.5) | |
|
| |||||
| 1 unit | 863 (4.7) | 823 (9.5) | 241 (9.6) | N/A | |
| UNITS PER ENCOUNTER | 2 units | 956 (4.0) | 512 (10.5) | 622 (10.1) | N/A |
| 3–4 units | 921 (6.3) | 427 (13.3) | 654 (14.0) | N/A | |
| 5–8 units | 831 (10.5) | 389 (19.6) | 560 (19.1) | N/A | |
| >8 units | 1,009 (21.5) | 440 (24.5) | 681 (29.9) | N/A | |
Outpatient Transfusions
During the two-year study period, 38,972 outpatient transfusion encounters were recorded in the database. The most common outpatient transfusion product was a red cell (n=25,939), followed by platelets (n=11,629), and plasma (n=1,404) (Table 1). In comparison to inpatient encounters, the overall proportion of outpatient transfusion encounters was similar by sex, age, ethnicity, and number of units per encounter for each blood product type. While transfusion incidence could not be calculated because outpatient encounters were only partially captured in this database, most outpatient encounters involving a transfusion were for blood diseases or neoplasms, diagnoses that also had a high incidence of transfusion for inpatients.
Transfusions by Diagnosis and Hemoglobin Values
The median pre-transfusion and post-transfusion Hgb values as a function of issue location, number of red cells used per episode, and primary diagnosis are shown in Figure 3. A median of one red cell unit was transfused per transfusion episode for most locations and primary diagnoses considered. The overall median pre-transfusion Hgb was 7.6 g/dl (7.0–8.2 IQR) and medians ranged between 7.0–8.0 g/dl for all clinical diagnoses and issue locations recorded, including specific clinical diagnoses such as acute coronary syndrome (7.9 g/dl), stroke/intracranial hemorrhage (7.5 g/dl), and acute GI bleeding (7.4 g/dl) (data not shown). Red cell transfusions that were issued to the operating room were associated with a higher pre- and post-transfusion Hgb than other locations (pre: 7.9 g/dl, 7.4–8.4 IQR; post: 9.5 g/dl, 8.7–10.3 IQR), but were also associated with a lower adjusted transfusion increment/unit (0.8 g/dl), suggesting the transfusion occurred in the setting of acute hemorrhage. Outpatient transfusions had pre-and post-transfusion Hgb levels of 7.7 g/dl (7.1–8.3 g/dl IQR) and 9.2 g/dl (8.5–9.9 g/dl IQR) respectively, but unlike the operating room, the adjusted Hgb increment was not different from other locations (1.5 g/dl). Lastly, pre-transfusion Hgb was slightly higher for circulatory (7.8 g/dl) and musculoskeletal (7.9 g/dL) primary diagnoses than for other diagnoses.
Figure 3. Inpatient red cell transfusion practice by issue location (A) and primary diagnosis (B). Median values are shown.
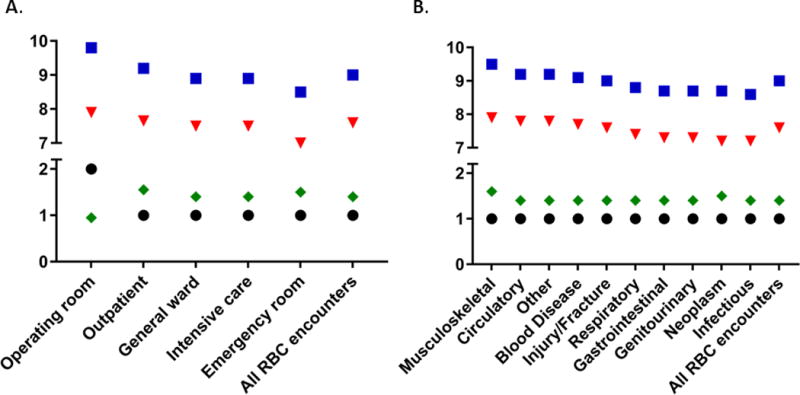
(square= post-transfusion Hgb (g/dL), triangle= pre-transfusion Hgb (g/dL), diamond= Hgb change per RBC dose (g/dL), circle=median number of units per episode).
Reported Adverse Transfusion Events
Transfusion reaction events were captured in this database when they were reported to the hospital transfusion service. The most commonly reported transfusion reaction was a febrile non-hemolytic transfusion reaction (n=742 reported cases: 11.3 events per 1000 patients, 6.4 events per 1000 encounters, 1.4 events per 1000 transfused units), followed closely by allergic transfusion reactions (n=573 reported cases: 8.7 events per 1000 patients, 4.9 events per 1000 encounters, 1.1 events per 1000 transfused units). Together, these two reactions accounted for over 75% of reported events. Severe transfusion reactions reported to blood banks, such as transfusion-related acute lung injury (TRALI) and acute hemolysis, were rare (about 1% of all reported transfusion reactions) (Table 3).
Table 3.
Adverse transfusion events reported in 2013 – 2014.
| Adverse event | Events reported (N, % total) | Events per 1000 transfused units (N=517,708) | Events per 1000 transfused patients (N=65,694) | Event per 1000 transfusion encounters (N=116,185) |
|---|---|---|---|---|
| Total | 1711 | 3.3 | 26.0 | 14.7 |
| Febrile nonhemolytic transfusion reaction (FNHTR) | 742 (43.4%) | 1.4 | 11.3 | 6.4 |
| Allergic reaction, including anaphylaxis | 573 (33.5%) | 1.1 | 8.7 | 4.9 |
| Other | 86 (5.0%) | 0.17 | 1.3 | 0.74 |
| Transfusion associated circulatory overload (TACO) | 84 (4.9%) | 0.16 | 1.3 | 0.72 |
| Unknown | 54 (3.2%) | 0.1 | 0.82 | 0.47 |
| Delayed hemolytic transfusion reaction (DHTR) | 47 (2.7%) | 0.09 | 0.72 | 0.40 |
| Delayed serologic transfusion reaction (DSTR) | 38 (2.2%) | 0.07 | 0.58 | 0.33 |
| Hypotensive transfusion reaction | 36 (2.1%) | 0.07 | 0.55 | 0.31 |
| Transfusion associated dyspnea (TAD) | 33 (1.9%) | 0.064 | 0.50 | 0.28 |
| Transfusion-related acute lung injury (TRALI) | 11 (0.64%) | 0.021 | 0.17 | 0.1 |
| Acute hemolytic transfusion reaction (AHTR) | 7 (0.41%) | 0.014 | 0.11 | 0.06 |
Discussion
Our findings provide a description of transfusion practice across a multicenter consortium of hospitals over 2 years and demonstrate the feasibility of using a database that combines clinical information from different electronic medical record systems. Using data from 80,362 inpatient transfusion encounters and 38,972 outpatient encounters, we demonstrate that transfusion incidence increases with age and differs minimally by sex and ethnicity. Mortality was higher in those who received a transfusion. The pre-transfusion Hgb trigger for a single red cell unit transfusion at most hospital locations and clinical diagnoses was between 7–8 g/dl, lower than historical transfusion triggers and consistent with widespread adoption of more restrictive transfusion policies. Overall, as will be described in the following paragraphs, these data confirm findings reported in previous studies and demonstrate the utility of this database for detailed future analyses of transfusion practice and health outcomes.
The key strength of this study is the reliance on a large-scale, detailed database with complete or near-complete coverage of all transfused inpatients and outpatients for 12 hospitals. This database has also undergone rigorous quality control and is as accurate as possible given its sourcing from disparate electronic medical records. Databases such as these are critically important, and similar international databases such as SCANDAT, PROTON, and SHOT have been used successfully to address a number of critical questions regarding blood donors and transfusion recipients.2–7,17,18,19 However, these databases lack the granular inpatient clinical data contained within the REDS-III clinical database such as laboratory values, medications, vital signs, and issue locations for each transfusion encounter and blood product. Another large database of similar type and granularity is in development in Canada,20 but to our knowledge, the REDS-III database is the largest multi-center collection of highly granular medical records for transfused inpatients and outpatients currently available.
Our initial review of transfusion practice using this database is likely to be representative of transfusion practice across the United States because it is consistent with the data reported from other large national surveys of transfusion practice, such as the 2013 AABB Blood Collection, Utilization, and Patient Blood Management Survey Report.21 Our findings similarly identify the general ward as the most common location for a transfusion, and report febrile non-hemolytic transfusion reactions as the most common reported adverse transfusion event at a rate of about 1:1000 units.21 The AABB survey, however, does not capture encounter-level data for individual transfused patients and thus, our analysis is more comparable to a study performed using the PROTON database in 2010.17,18 The PROTON database included 290,043 patients and 2,405,012 blood product transfusions over 20 hospitals. While our database shows generally similar trends to that reported by the PROTON database, we found a greater proportion of single unit red cell transfusions at both the episode and encounter level (26.4%), suggesting a possible increasing influence of patient blood management strategies in selected hospitals.8,9,22 Further comparisons between large databases will have the potential to reveal differences in the profile of blood product users in different countries over different time frames, possibly reflecting differences in patient mix and/or clinical practice.
Several databases capture clinical information on transfused individuals, but few capture complete data from transfused and non-transfused patients. While other studies, such as those using the Kaiser Permanente Northern California database,8 have also calculated transfusion incidence, our database includes a broader range of tertiary care and trauma centers than the community-based Kaiser network. The REDS-III database allows us to calculate transfusion incidence by sex, age, ethnicity, and clinical diagnosis, as well as to determine the number of transfused products used per inpatient encounter. Nevertheless, it is noteworthy that red cell transfusion incidence was similar between the two databases (11% vs. 13%).8 We additionally found that transfusion incidence was similar for sex, but increased with age and was higher for certain primary diagnoses and ethnicities (e.g. blood diseases). The lower platelet and plasma transfusion incidence in black patients combined with higher mortality in black patients who received these products was notable, and suggests either a possible disparity in how these products are administered, or a different mix of indications for platelet or plasma transfusions in that population. Future analyses of the full four years of REDS-III data will permit a review of trends in transfusion incidence, and characterization of transfusion practice over time, by geographic region, specific patient population, and/or subcategories of hospitals.
Using this database, we were able to quantify inpatient mortality according to patient demographics and type and dose of transfused blood products. We found, as observed in other database studies,8,22 that mortality was higher for transfused individuals overall, increased with the number of units provided during the encounter, and increased with patient age. However, these findings likely reflect an indication bias: patients who receive increasing numbers of transfusions for any indication are more ill than patients who do not receive transfusions and thus, are more likely to die during an encounter. Our finding that mortality was higher for all demographic variables with the use of platelet and plasma products versus red cells is also likely subject to indication bias as has been reported by smaller studies in specific populations, such as those receiving aortic valve replacement or cardiac bypass, and the PROTON study.18,23–25
Outpatient transfusion practices are rarely studied, and the REDS-III database provides comprehensive access to clinical data surrounding this patient population. Previous transfusion practice studies on outpatients have focused mainly on those with sickle cell disease, leukemia or aplastic anemia.26,27,28 The REDS-III database revealed that patients with blood diseases and neoplasms represented the largest proportion of outpatient transfusion encounters, with distributions for sex, age, and race/ethnicity being generally similar to inpatients. Outpatients most commonly received one or two units of red cells with a pre-transfusion Hgb between 7 and 8 g/dl. These observations add to the limited literature on this topic and closely mirror the findings from a physician-based survey recently performed for patients with acute leukemia.27 Future sub-analyses using this database will be able to address whether these transfusion practices are consistent across different outpatient primary diagnoses.
Lastly, while we were capable of looking at laboratory values related to any type of component using this database, we focused our evaluation on red cell transfusions and Hgb triggers. Recent large clinical trials support the use of a restrictive transfusion strategy and a pre-transfusion Hgb of 7 g/dl.22,29–32 National guidelines have now been published supporting the use of this restrictive strategy33 and blood management groups have formed in many hospitals to reduce red cell use by using these evidence-based guidelines.8,11,22 We found that, with the exception of surgical patients, current red cell transfusion practice generally follows a pre-transfusion trigger between 7–8 g/dl and that physicians in these 12 hospitals are generally ordering one red cell unit per inpatient transfusion episode. However, we did identify that some patient populations, such as those with acute cardiovascular disease, received red cell transfusions at slightly higher pre-transfusion Hgb. These findings support the conclusion that transfusion practice for red cells, whether attributable to new guidelines or patient blood management programs, generally follows the current evidence and standards.22,30,31,33
This study has several limitations, mostly related to the source data. First, the database was limited by how each electronic medical record system recorded the clinical variables and there were some missing, inaccurate, or unavailable clinical data. Data regarding hospital admission location was difficult to interpret because of the way several hospitals recorded intra-hospital transfers, making a calculation of transfusion incidence by admission location (e.g. emergency department, ICU, general ward) impossible. The database also does not capture discharge summaries that would facilitate the evaluation of cause of death, intraoperative fluid use, or transfusion indication(s), which may limit its ability to answer some transfusion-specific questions. Data on post-hospital mortality were also not available or reliable from most source systems and were not included. Second, while very large, the database is based upon twelve geographically dispersed but predominantly academic hospitals and is not necessarily representative of all hospital transfusion practice in the United States. In this analysis, we do not report on variability in transfusion practice among hospitals, although such variability could be a focus of future analyses. Lastly, while our reported outpatient transfusion data are novel, they are limited by lack of a reliable denominator for outpatient encounters.
In conclusion, we have described the methods used, preliminary data, and potential utility for the largest, multi-site, clinical database for transfusion medicine in the United States. Despite some inherent weaknesses, this database has the size and granularity necessary to inform many hypothesis-driven research questions for both inpatient and outpatient transfusion recipients. This database will contain recipient data through the end of 2016 and will be linked to donor and component databases over the same time period, greatly expanding the utility of this dataset. The substantial effort devoted to creating this database will yield many dividends in improving transfusion medicine’s ability to address current and future questions of blood utilization, patient safety, and clinical outcomes.
Supplementary Material
Supplemental Figure 1. Data extraction by recipient type.
(blue color: data extracted, orange color: data not extracted, inpt: inpatient, outpt: outpatient, T & S: type and screen, T & C: type and cross).
Acknowledgments
We thank Drs. Simone Glynn (NHLBI), Steve Kleinman, and members of the REDS-III Publications Committee for their input in data interpretation and manuscript development.
APPENDIX
The NHLBI Recipient Epidemiology Donor Evaluation Study-III (REDS-III), domestic component, is the responsibility of the following persons:
Hubs
A.E. Mast and J.L. Gottschall, Blood Center of Wisconsin (BCW), Milwaukee, WI
D.J. Triulzi and J.E. Kiss, The Institute for Transfusion Medicine
(ITXM), Pittsburgh, PA
E.L. Murphy and E.M. St. Lezin, University of California, San Francisco
(UCSF), and Laboratory Medicine, Department of Veterans Affairs Medical Center, San Francisco, CA
E.L. Snyder, Yale University School of Medicine, New Haven, CT
R.G. Cable, American Red Cross Blood Services, Farmington, CT
Data coordinating center
D.J. Brambilla and M.T. Sullivan, RTI International, Rockville, MD
Central laboratory
M.P. Busch and P.J. Norris, Blood Systems Research Institute, San Francisco, CA
Publication committee chairman
R.Y. Dodd, American Red Cross, Holland Laboratory, Rockville, MD
Steering committee chairman
S.H. Kleinman, University of British Columbia, Victoria, BC, Canada
National Heart, Lung, and Blood Institute, National Institutes of Health
S.A. Glynn, K.B. Malkin and A.M. Cristman
Footnotes
Author contributions were as follows: study concept and design—all authors; acquisition of data—MW; statistical analysis—MK, MW; analysis and interpretation of data—all authors; drafting of the manuscript—MK, WB, EM; critical revision of the manuscript for important intellectual content—all authors; administrative, technical, or material support—MS and MW.
CONFLICT OF INTEREST
The authors have disclosed no conflicts of interest.
References
- 1.Cook JA, Collins GS. The rise of big clinical databases. Br J Surg. 2015;102:e93–101. doi: 10.1002/bjs.9723. [DOI] [PubMed] [Google Scholar]
- 2.Kleinman S, Glynn SA. Database research in transfusion medicine: The power of large numbers. Transfusion. 2015;55(7):1591–5. doi: 10.1111/trf.13139. [DOI] [PubMed] [Google Scholar]
- 3.Vasan SK, Chiesa F, Rostgaard K, et al. Lack of association between blood donor age and survival of transfused patients. Blood. 2016;127(5):658–61. doi: 10.1182/blood-2015-11-683862. [DOI] [PubMed] [Google Scholar]
- 4.Halmin M, Rostgaard K, Lee BK, et al. Length of Storage of Red Blood Cells and Patient Survival After Blood Transfusion: A Binational Cohort Study. Ann Intern Med. 2017;166(4):248–256. doi: 10.7326/M16-1415. [DOI] [PubMed] [Google Scholar]
- 5.Edgren G, Hjalgrim H, Rostgaard K, et al. Risk of gastric cancer and peptic ulcers in relation to ABO blood type: a cohort study. Am J Epidemiol. 2010;172(11):1280–5. doi: 10.1093/aje/kwq299. [DOI] [PubMed] [Google Scholar]
- 6.Ullum H, Rostgaard K, Kamper-Jørgensen M, et al. Blood donation and blood donor mortality after adjustment for a healthy donor effect. Transfusion. 2015;55(10):2479–85. doi: 10.1111/trf.13205. [DOI] [PubMed] [Google Scholar]
- 7.Pedersen OB, Axel S, Rostgaard K, et al. The heritability of blood donation: a population-based nationwide twin study. Transfusion. 2015;55(9):2169–74. doi: 10.1111/trf.13086. [DOI] [PubMed] [Google Scholar]
- 8.Roubinian NH, Escobar GJ, Liu V, et al. Trends in red blood cell transfusion and 30-day mortality among hospitalized patients. Transfusion. 2014;54:2678–86. doi: 10.1111/trf.12825. [DOI] [PMC free article] [PubMed] [Google Scholar]
- 9.Roubinian N, Murphy EL, Swain BE, et al. Predicting red blood cell transfusion in hospitalized patients: role of hemoglobin level, comorbidities, and illness severity. BMC Health Serv Res. 2014;14:213. doi: 10.1186/1472-6963-14-213. [DOI] [PMC free article] [PubMed] [Google Scholar]
- 10.Menis M, Anderson SA, Forshee RA, et al. Transfusion-related acute lung injury and potential risk factors among the inpatient US elderly as recorded in Medicare claims data, during 2007 through 2011. Transfusion. 2014;54:2182–93. doi: 10.1111/trf.12626. [DOI] [PubMed] [Google Scholar]
- 11.Frank SM, Resar LM, Rothschild JA, et al. A novel method of data analysis for utilization of red blood cell transfusion. Transfusion. 2013;53:3052–59. doi: 10.1111/trf.12227. [DOI] [PubMed] [Google Scholar]
- 12.Warner MA, Jia Q, Clifford L, Wilson G, et al. Preoperative platelet transfusions and perioperative red blood cell requirements in patients with thrombocytopenia undergoing noncardiac surgery. Transfusion. 2016;56(3):682–90. doi: 10.1111/trf.13414. [DOI] [PMC free article] [PubMed] [Google Scholar]
- 13.Kleinman S, Busch MP, Murphy EL, et al. The National Heart, Lung, and Blood Institute Recipient Epidemiology and Donor Evaluation Study (REDS-III): a research program striving to improve blood donor and transfusion recipient outcomes. Transfusion. 2014;54:942–55. doi: 10.1111/trf.12468. [DOI] [PMC free article] [PubMed] [Google Scholar]
- 14.Triulzi D, Gottschall J, Murphy E, et al. A multicenter study of plasma use in the United States. Transfusion. 2015;55:1313–9. doi: 10.1111/trf.12970. [DOI] [PMC free article] [PubMed] [Google Scholar]
- 15.Policy for Data Sharing for Clinical Trials and Epidemiological Studies. 2016 (Accessed July 1, 2016 at http://www.nhlbi.nih.gov/funding/datasharing.htm.)
- 16.Harvey AR, Basavaraju SV, Chung KW, Kuehnert MJ. Transfusion-related adverse reactions reported to the National Healthcare Safety Network Hemovigilance Module, United States, 2010 to 2012. Transfusion. 2015;55(4):709–18. doi: 10.1111/trf.12918. [DOI] [PMC free article] [PubMed] [Google Scholar]
- 17.Borkent-Raven BA, Janssen MP, van der Poel CL, et al. The PROTON study: profiles of blood product transfusion recipients in the Netherlands. Vox Sang. 2010;99:54–64. doi: 10.1111/j.1423-0410.2010.01312.x. [DOI] [PubMed] [Google Scholar]
- 18.Borkent-Raven BA, Janssen MP, van der Poel CL, et al. Survival after transfusion in the Netherlands. Vox Sang. 2011;100(2):196–203. doi: 10.1111/j.1423-0410.2010.01378.x. [DOI] [PubMed] [Google Scholar]
- 19.Stainsby D, Jones H, Asher D, et al. Serious hazards of transfusion: a decade of hemovigilance in the UK. Transfus Med Rev. 2006;20:273–82. doi: 10.1016/j.tmrv.2006.05.002. [DOI] [PubMed] [Google Scholar]
- 20.Chassé M, McIntyre L, Tinmouth A, et al. Clinical effects of blood donor characteristics in transfusion recipients: protocol of a framework to study the blood donor-recipient continuum. BMJ Open. 2015;5(1):e007412. doi: 10.1136/bmjopen-2014-007412. [DOI] [PMC free article] [PubMed] [Google Scholar]
- 21.Whitaker BI, Rajbhandary S, Harris A. The 2013 AABB Blood Collection, Utilization, and Patient Blood Management Survey Report. AABB Press; 2015. [DOI] [PubMed] [Google Scholar]
- 22.Goodnough LT, Maggio P, Hadhazy E, Shieh L, Hernandez-Boussard T, Khari P, Shah N. Restrictive blood transfusion practices are associated with improved patient outcomes. Transfusion. 2014;54(10 Pt 2):2753–9. doi: 10.1111/trf.12723. [DOI] [PubMed] [Google Scholar]
- 23.Bjursten H, Al-Rashidi F, Dardashti A, et al. Risks associated with the transfusion of various blood products in aortic valve replacement. Ann Thorac Surg. 2013;96(2):494–9. doi: 10.1016/j.athoracsur.2013.04.053. [DOI] [PubMed] [Google Scholar]
- 24.Bjursten H, Dardashti A, Ederoth P, et al. Increased long-term mortality with plasma transfusion after coronary artery bypass surgery. Intensive Care Med. 2013;39(3):437–44. doi: 10.1007/s00134-012-2723-9. [DOI] [PubMed] [Google Scholar]
- 25.Spiess BD. Transfusion of blood products affects outcome in cardiac surgery. Semin Cardiothorac Vasc Anesth. 2004;8(4):267–81. doi: 10.1177/108925320400800402. [DOI] [PubMed] [Google Scholar]
- 26.Sagmeister M, Oec L, Gmür J. A restrictive platelet transfusion policy allowing long-term support of outpatients with severe aplastic anemia. Blood. 1999;93(9):3124–6. [PubMed] [Google Scholar]
- 27.Pine AB, Lee EJ, Sekeres M, et al. Wide variations in blood product transfusion practices among providers who care for patients with acute leukemia in the United States. Transfusion. 2017;57(2):289–295. doi: 10.1111/trf.13934. [DOI] [PMC free article] [PubMed] [Google Scholar]
- 28.Afenyi-Annan A, Bandarenko N. Transfusion practices for patients with sickle cell disease at a major academic medical center. Immunohematology. 2006;22(3):103–7. [PubMed] [Google Scholar]
- 29.Hébert PC, Wells G, Blajchman MA, et al. A multicenter, randomized, controlled clinical trial of transfusion requirements in critical care. Transfusion Requirements in Critical Care Investigators, Canadian Critical Care Trials Group. N Engl J Med. 1999;340:409–17. doi: 10.1056/NEJM199902113400601. [DOI] [PubMed] [Google Scholar]
- 30.Marik PE, Corwin HL. Efficacy of red blood cell transfusion in the critically ill: a systematic review of the literature. Crit Care Med. 2008;36:2667–74. doi: 10.1097/CCM.0b013e3181844677. [DOI] [PubMed] [Google Scholar]
- 31.Hajjar LA, Vincent J-L, Galas FRBG, et al. Transfusion requirements after cardiac surgery: the TRACS randomized controlled trial. JAMA. 2010;304:1559–67. doi: 10.1001/jama.2010.1446. [DOI] [PubMed] [Google Scholar]
- 32.Carson JL, Terrin ML, Noveck H, et al. Liberal or restrictive transfusion in high-risk patients after hip surgery. N Engl J Med. 2011;365:2453–62. doi: 10.1056/NEJMoa1012452. [DOI] [PMC free article] [PubMed] [Google Scholar]
- 33.Carson JL, Grossman BJ, Kleinman S, et al. Red blood cell transfusion: a clinical practice guideline from the AABB. Ann Intern Med. 2012;157:49–58. doi: 10.7326/0003-4819-157-1-201206190-00429. [DOI] [PubMed] [Google Scholar]
Associated Data
This section collects any data citations, data availability statements, or supplementary materials included in this article.
Supplementary Materials
Supplemental Figure 1. Data extraction by recipient type.
(blue color: data extracted, orange color: data not extracted, inpt: inpatient, outpt: outpatient, T & S: type and screen, T & C: type and cross).