

Abstract
HER2 overexpression drives Akt signaling and cell survival and HER2-enriched breast tumors have a poor outcome when Akt is upregulated. Akt is activated by phosphorylation at T308 via PI3K and S473 via mTORC2. The importance of PI3K activated Akt signaling is well documented in HER2-amplified breast cancer models, but the significance of mTORC2 activated Akt signaling in this setting remains uncertain. We report here that the mTORC2 obligate cofactor Rictor is enriched in HER2-amplified samples, correlating with increased phosphorylation at S473 on Akt. In invasive breast cancer specimens, Rictor expression was upregulated significantly compared to non-malignant tissues. In a HER2/Neu mouse model of breast cancer, genetic ablation of Rictor decreased cell survival and phosphorylation at S473 on Akt, delaying tumor latency, penetrance and burden. In HER2-amplified cells, exposure to an mTORC1/2 dual kinase inhibitor decreased Akt-dependent cell survival, including in cells resistant to lapatinib where cytotoxicity could be restored. We replicated these findings by silencing Rictor in breast cancer cell lines, but not silencing the mTORC1 cofactor Raptor (RPTOR). Taken together, our findings establish that Rictor/mTORC2 signaling drives Akt-dependent tumor progression in HER2-amplified breast cancers, rationalizing clinical investigation of dual mTORC1/2 kinase inhibitors and development of mTORC2-specific inhibitors for use in this setting.
Keywords: Rictor, Raptor, mTOR, Lapatinib resistance, HER2, Akt
Introduction
Akt phosphorylation is drives cell survival, motility, and proliferation in several diseases, including cancers, causing increased interest in upstream regulators of Akt. Many cancer studies focus on phosphoinositol-3 kinase (PI3K)-to-PDK1 signaling as the primary Akt activation pathway, via Akt T308 phosphorylation. PI3K inhibition reduces P-Akt T308, decreasing Akt signaling to its downstream effectors, including mTOR complex 1 (mTORC1). In many cancers, PI3K/Akt/mTORC1 inhibition decreases tumor cell growth and survival. However, mTORC1 inhibition releases endogenous restraints upon the PI3K pathway, causing resurgent PI3K/Akt signaling, and dampening net treatment response (1). A greater understanding of signaling pathways both upstream and downstream of Akt is required for effective Akt inhibition in cancers.
In addition to PI3K-mediated Akt T308 phosphorylation, Akt S473 phosphorylation activates Akt. Several serine-threonine kinases can phosphorylate Akt S473, including Inhibitor of κB-Kinase (IKK)-α, DNA protein kinase (DNA-PK), Integrin-Linked Kinase (ILK), and mTOR complex 2 (mTORC2) (2). Interestingly, this places the serine/threonine kinase mTOR in a position to activate Akt (mTORC2), and to be activated by Akt (mTORC1) (3). The two structurally distinct complexes of mTOR are defined by the mTOR-associated cofactors. Raptor is a required cofactor for mTORC1, while Rictor and Sin1 are required for mTORC2. Functional distinctions are also which is activated downstream of PI3K/Akt and regulates cell growth, protein translation, and metabolism (4)., which controls cell polarity and cytoskeletal dynamics (5). mTORC2 lies upstream of Akt, directly phosphorylating Akt S473 (6, 7). Given that mTORC1 and mTORC2 utilize distinct co-factors and substrates, mTORC1 and mTORC2 may have distinct physiological roles, and their dysregulation may produce distinct pathological consequences. This notion is supported by recent findings that Rictor/mTORC2, but not Raptor/mTORC1 is required during mammary gland development for ductal branching, mammary epithelial cell (MEC) motility, and MEC survival (8).
Breast cancers often hijack many signaling pathways used by normal MECs to support tumor cell growth, survival, and metastasis (9, 10). It is possible, therefore, that requirements for mTORC2 in MECs are paralleled in breast cancers. However relatively little is known about distinct roles of mTORC2 in breast cancer formation, progression, and treatment, despite its known role in activation of Akt, a key signaling node and critical effector of RTKs, including HER2. We used genetic and pharmacological models of Rictor/mTORC2 blockade to determine if Rictor/mTORC2 supports spontaneous tumor formation, tumor cell survival, and therapeutic response to HER2 inhibition. Our study uncovers a previously unreported role for Rictor/mTORC2 in HER2-amplified breast cancers.
Histological analysis
Human tissue microarray (de-identified breast carcinoma specimens with normal tissue controls) was purchased from Cybrdi (#CC08-10-001) and stained with antibodies against Rictor or Raptor. Average positive staining expressed in percentage and the intensity were calculated for each core. For mouse studies, tumors were resected from mice and paraffin sections (5-μm) were stained with hematoxylin and eosin or with the ApopTag TUNEL analysis kit (Calbiochem). IHC on paraffin-embedded sections or on human TMA’s was performed as described previously (11) using: Rictor (Santa Cruz Biotechnologies), Raptor (Abcam), Ki67 (Santa Cruz Biotechnologies), P-S6 (Cell Signaling Technologies); P-Akt S473 (Cell Signaling Technologies); Rictor (Santa Cruz) Immunodetection was performed using the Vectastain kit (Vector Laboratories), AF488-conjugated anti-rabbit, or AF621-conjugated anti-mouse (Life Technologies), according to the manufacturer’s directions.
Mice
All animals were housed under pathogen-free conditions, and experiments were performed in accordance with AAALAC guidelines and with Vanderbilt University Institutional Animal Care and Use Committee approval. RictorFL/FL mice (12) were kindly provided by Dr. Mark Magnuson (Vanderbilt University) and were inbred to FVB for >10 generations. MMTV-NIC mice (generated in FVB) have been previously described (13). All analyses of RictorFL/FL X MMTV-NIC mice were performed on age-matched siblings.
Cell culture
BT474, MDA-MB-361, and SKBR3 cells were purchased in 2012 from ATCC (cell identity verified by AACR using genotyping with a Multiplex STR assay) and cultured at low passage in DMEM with 10% fetal calf serum. MCF10A and MCF10A-RictorZFN cells (Sigma-Aldrich) were cultured in DMEM:F12 plus insulin (4 μg/mL), cholera toxin (1 μg/mL), EGF (100 ng/mL), hydrocortisone (2 μg/mL) and 5% horse serum and transduced with lentiviral HER2-IRES-RFP (GenTarget) and selected with 10 ug/mL blasticidin. AZD5363 and lapatinib were purchased from SelleckChem. Lapatinib-resistant cell lines were previously described (14).
Generation of stable knockdown cell lines
Lentiviral shRNA-encoding plasmids (Rictor shRNA #1853, 1854; Raptor shRNA #1857, 1858; scramble shRNA #1864, Addgene) were transfected into 293FT cells plus packaging vectors. Cultured media containing viral load were used to infect cells. Cells were selected and maintained at low passage with puromycin (2 μg/mL).
Western blotting
Cells were homogenized in ice-cold lysis buffer [50 mM Tris pH 7.4, 100 mM NaF, 120 mM NaCl, 0.5% NP-40, 100 μM Na3VO4, 1X protease inhibitor cocktail (Roche)] and cleared by centrifugation (4°C, 13,000 x g, 10 min). Protein concentration was determined using BCA assay (Pierce). Proteins separated by SDS-PAGE were transferred to nitrocellulose membranes. Membranes were blocked and probed with antibodies as described previously (10) using primary antibodies: α-actin (Sigma-Aldrich); Rictor (Santa Cruz); and the following from Cell Signaling Technologies [phospho-cocktail; AKT, P-Akt S473, P-Akt T308, S6, P-S6, and Raptor].
Xenograft experiments
0.17 mg β-estradiol pellets (14d release; Innovative Research of America) were implanted subcutaneously into 4-week-old female BALB/c athymic nu/nu mice (Harlan Laboratories). Right and left inguinal mammary fat pads were injected with 106 MDA-MB-361 shScramble or shRictor cells in 100 μl Matrigel. Tumors were measured with calipers twice weekly.
Growth assays
5,000 cells seeded in 12-well plates were cultured up to 14d. Growth media (with 1 μM lapatinib, PP242 or equal volumes of DMSO) was changed every 3d. Cells were washed with ice cold PBS, fixed with 10% formalin, stained with crystal violet, imaged and quantitated using the Odyssey fluorescence scanner and Odyssey software. For three-dimensional growth assay, 5,000 cells were suspended in 100 μL Matrigel and plated in 96-well plates. After Matrigel solidified, 100 μL growth media (supplemented with 1 μM lapatinib, PP242, or DMSO) was layered over cultures and changed every three days. Colonies were photographed after 14d.
Annexin V-FITC staining
5,000 cells were plated in 96-well plates in triplicate and cultured overnight. 5 uL Annexin V-FITC (Invitrogen, 807876) in 95 uL complete or serum-free DMEM was added to each well. Live cell fluorescence was captured at 6h and quantitated using Image J.
Caspase 3/7 Glo assay (Promega)
5,000 cells were plated in 96-well plates and cultured overnight. Caspase Glo 3/7 reagent was added (1:1 ratio) and incubated for 1h and luminescence was measured.
Statistics
Experimental groups were compared with a control group using Student’s unpaired, 2-tailed t test. Multiple groups were compared across a single condition using 1-way ANOVA. To compare the response of 2 agents combined to either single agent alone, 2-way ANOVA was used. P < 0.05 defined significant differences from null hypothesis.
Results
P-Akt correlates with decreased survival in patients with HER2-amplified breast cancers
Nearly 20% of all breast cancers exhibit HER2 gene amplification, driving PI3K signaling and Akt phosphorylation. Notably, HER2-amplified breast cancers rely on PI3K/Akt signaling. Because Akt is a critical signaling effector of HER2 in HER2-amplified breast cancers, we examined AKT1/2/3 mRNA and/or upregulation of P-Akt S473 in a panel of HER2-enriched breast tumor specimens curated by the Cancer Genome Atlas (TCGA) (Figure 1A). Overexpression (>1.5 S.D.) of AKT1, AKT2, or AKT3 and/or P-Akt S473 upregulation occurred more frequently in HER2-enriched tumors (25/58, or 43%) as compared to Luminal A/B breast cancers (20%, or 64/321 tumors,) and Basal-like breast cancers (33%, or 26/81 tumors, Figure 1B and Supplemental Figure S1A–B). AKT activating mutations and amplifications were rarely seen in HER2-enriched breast tumors, including one AKT1 E17K mutation, one AKT2 amplification and four AKT3 amplifications within the 58 tumors reported. Patients whose HER2-enriched tumors exhibited AKT1/2/3 mRNA or P-Akt S473 upregulation displayed substantially reduced overall survival (OS) as compared to the remaining HER2-enriched breast cancer patients (Figure 1C, P = 4.999e-5, log-rank test). In contrast, AKT1/2/3 mRNA and/or P-Akt S473 upregulation did not correlate with OS in patients with Luminal A/B or Basal-like breast cancers (Supplemental Figure S1A–S1B).
Figure 1. P-Akt and Rictor l are elevated in human breast cancer.
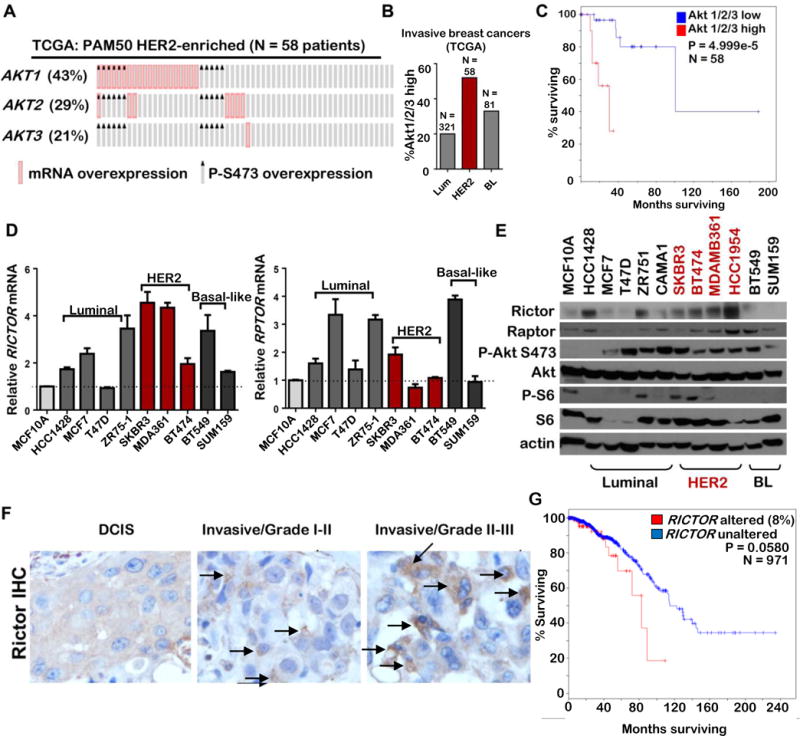
A–C. TCGA-curated breast cancers were assessed for mRNA overexpression of AKT1, AKT2, and AKT3 and RPPA-detected upregulation of P-Akt S473 using cBio software. A. Oncoprint showing HER2-enriched breast cancers harboring overexpression of AKT1/2/3 or P-Akt S473. B. Comparison of Akt1/2/3 mRNA and/or P-S473 overexpression in breast tumors representing three PAM50 molecular breast cancer subtypes. C. Kaplan-Meier survival analysis of patients diagnosed with HER2-enriched breast cancers dichotomized based on high versus low P-S473 and/or mRNA expression of Akt1/2/3. P value calculated using Log-rank test with cBio software. D–E. RICTOR mRNA (D) and protein levels (E) in breast cancer cell lines compared to untransformed MCF10A cells. F. Representative images of Rictor IHC in human breast cancers by stage and grade. Arrows indicate Rictor-positive cells. For Rictor IHC, DCIS (N = 9), Grade I-II (N=36), Grade II-III (N= 92). G. Overall survival of TCGA-curated invasive breast cancer cases (N = 971) were assessed, stratifying cases according to presence or absence of RICTOR gene amplification, mutation, and mRNA overexpression (> 2 S.D. above average RICTOR expression). Cases with Rictor alterations (N = 76/971; 8%) are represented in red.
Activating phosphorylation of Akt occurs at T308 and S473. While the importance of PI3K-mediated Akt T308 phosphorylation in HER2-amplified breast cancers is clear, less is known about how kinases governing Akt S473 phosphorylation participate in the genesis, maintenance, progression and treatment of HER2-amplified breast cancers. Consistent with a potential role for mTORC2 in HER2-amplified breast cancers, RICTOR mRNA levels assessed by RT-qPCR revealed elevated RICTOR expression in 3 of 3 HER2-amplified breast cancer cells assessed, as compared to what was seen in untransformed MCF10A mammary epithelial cells (MECs, Figure 1D). RICTOR expression was higher in 2 of the 3 HER2-amplified breast cancer cells as compared to luminal (N = 4) or basal-like (N = 2) breast cancer cells that were tested. We confirmed these findings using western analysis of whole cell lysates, revealing Rictor upregulation in 4 of 4 HER2-amplified breast cancer cell lines over untransformed MCF10A (Figure 1E).
Rictor upregulation in aggressive breast cancers
We used immunohistochemistry (IHC) to assess the mTORC2 obligate co-factor Rictor in clinical breast cancer tissue microarrays (TMAs). Rictor was expressed below the level of detection in normal breast and ductal carcinoma in situ specimens (Figure 1F, Supplemental Table 1, and Supplemental Figure S2A), in contrast to our previous findings that data Rictor/mTORC2 (but not Raptor/mTORC1) is required for mammary ductal branching and MEC survival during puberty. This may indicate that Rictor expression is higher during dynamic architectural changes in the mammary epithelium, such as during puberty, but its expression may be lower in mature, quiescent MECs, although this hypothesis has not been tested. Rictor was significantly upregulated in invasive breast carcinomas (Figure 1G), 37% of which scored positive for Rictor staining (Supplemental Table 1). Rictor was localized in the cytoplasm in a granular pattern, focused primarily at perinuclear location. The co expression of positivity for both markers was 43% in IDC and 88% in ILC.
Strikingly, Rictor staining intensity was higher in grade II/III breast tumors as compared to what was seen in grade I/II tumors (Supplemental Table 2, and Supplemental Figure S2B). Analysis of TCGA-curated invasive breast cancers revealed that 8% of all breast cancers assessed display RICTOR gene overexpression, mutation, or amplification (Supplemental Figure S3), correlating with decreased overall survival (Figure 1G). These data suggest that Rictor, a key factor for mTORC2 signaling, may play a role in tumor progression, an idea motivating further studies into Rictor/mTORC2 signaling in breast cancers.
RICTOR loss decreases HER2-driven premalignant changes to the mammary epithelium
We assessed the impact of Rictor/mTORC2 in the genesis of HER2-amplified breast tumors using a transgenic mouse model, MMTV-Neu-IRES-Cre (NIC)(15), which expresses a bi-cistronic transcript comprised of oncogenic Neu (the rat HER2 homologue), followed by internal ribosomal entry site (IRES) and Cre recombinase expression cassettes. These mice develop mammary tumors with an average latency of 6 months (13). Mice harboring floxed Rictor alleles (RictorFL/FL) were crossed with NIC mice to generate RictorFL/FLNIC, ensuring Cre-mediated Rictor elimination in Neu-transformed cells. Rictor mRNA levels were reduced in RictorFL/FLNIC mammary samples versus Rictor+/+NIC samples (Supplemental Figure S4). We analyzed hematoxylin and eosin (H&E)-stained mammary glands of 12-week old virgin female mice, a time point prior to palpable tumor formation (Figure 2A). Prominent epithelial structures seen in Rictor+/+NIC samples were diminished in RictorFL/FLNIC samples (Figure 2B). Whole mount hematoxylin stained mammary glands showed diffuse hyperplasia in Rictor+/+NIC, but not RictorFL/FLNIC samples (Figure 2A). Importantly, focal neoplasias seen in whole mounted Rictor+/+NIC mammary glands were reduced or absent in RictorFL/FLNIC samples (Figure 2B).
Figure 2. Loss of Rictor decreases P-Akt, epithelial density and cell survival in premalignant MMTV-NIC mammary glands.
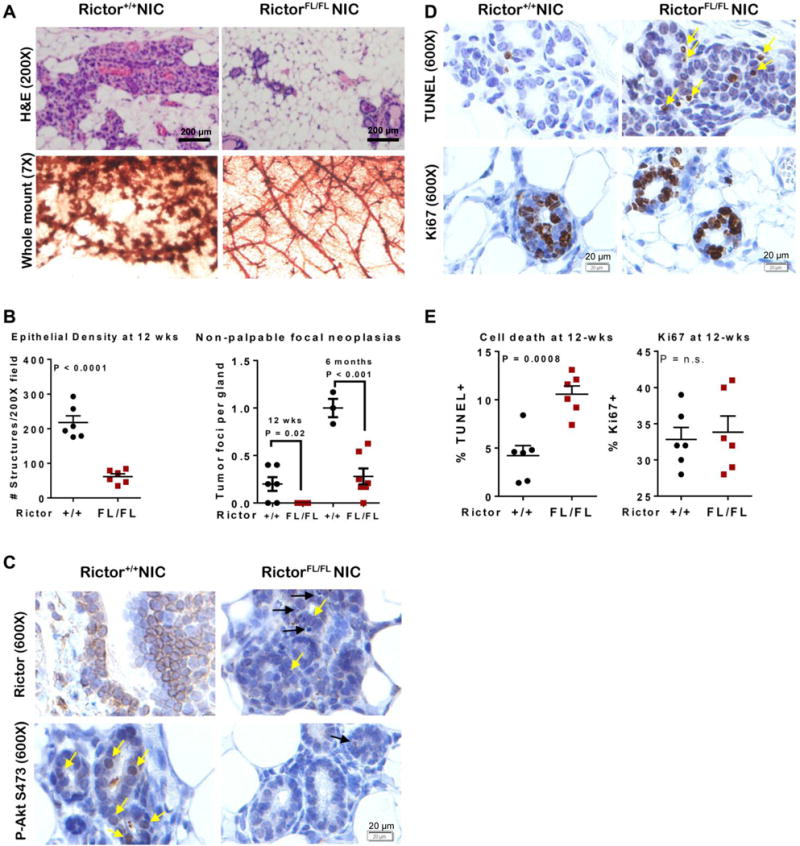
A. Mammary glands from 12-week old mice were assessed in hematoxylin and eosin (H&E)-stained sections (top) or by whole mount hematoxylin staining (bottom). Representative images are shown. B. Left panel: Average epithelial structures per field were assessed in H&E-stained sections of mammary glands from 12-week old mice. Right panel: The number of non-palpable focal neoplasias per whole mounted gland in 12-week old and 6 month old mice. Values are average ± S.D. Student’s T-test. C–D. IHC for Rictor (C, upper panels), P-Akt S473 (C, lower panels), Ki67 (D, upper panels) and TUNEL positive cells (D, lower panels). Yellow arrows indicate positive cells. Black arrows in C indicate hypercondensed nuclei of dying cells. Scale bar = 20 microns. E. The percentage of MECs positive for Ki67 (left panel) or TUNEL (right panel) was calculated. Each data point represents average of 5 randomly chosen 600X fields per gland, N = 6. Error bars are S.D., Student’s T-test.
Immunohistochemistry (IHC) revealed abundant Rictor expression in Rictor+/+NIC mammary glands, which was eliminated in RictorFL/FLNIC samples, although occasional cells retained Rictor expression (Figure 2C, yellow arrows). P-Akt S473 was decreased in RictorFL/FLNIC mammary glands as compared to Rictor+/+NIC. Histological evidence of apoptotic bodies in RictorFL/FLNIC samples (Figure 2C, black arrows) was investigated further by TUNEL analysis, revealing >2-fold more apoptotic cells in RictorFL/FLNIC over Rictor+/+NIC (Figure 2D–E). Ki67 staining, used as a marker of cellular proliferation, revealed similar proportions of proliferating cells in RictorFL/FLNIC and Rictor+/+NIC mammary glands (Figure 2D–E).
Conditional loss of Rictor delays HER2-driven tumor formation
Rictor+/+NIC mice (N = 11) formed tumors with 100% penetrance and an average latency of 135 days, but few RictorFL/FLNIC animals ever formed tumors (5/14, or 35%), doing so with a substantially delayed latency (Figure 3A) and decreased tumor multiplicity per mouse (Figure 3B), suggesting that Rictor promotes HER2-mediated mammary tumorigenesis. RictorFL/FLNIC tumors were distinct histologically from controls, harboring a lower nuclear-to cytoplasmic ratio, more serous fluid and more acellular debris (Figure 3C). Tumor cellularity was quantitated (excluding large areas of acellular debris from analysis) revealing decreased tumor cells per 600X-field in RictorFL/FLNIC samples versus Rictor-expressing controls (Figure 3D). Tumor volume measured at 28d after initial tumor palpation revealed decreased tumor burden in tumor-bearing RictorFL/FLNIC as compared to Rictor+/+NIC mice (Figure 3E, tumor-free mice were excluded from analysis).
Figure 3. Loss of Rictor delays HER2-driven tumor formation.
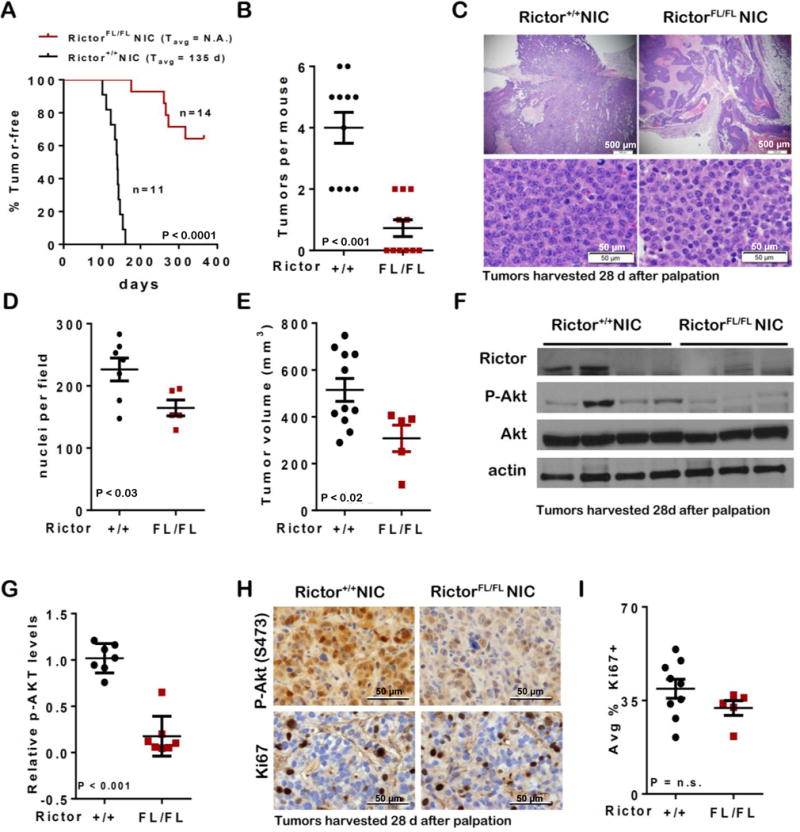
A. Mouse tumor latency was assessed by manual palpation. P value, Log-rank test. B. Tumors per mouse was determined. Midline is average, error bars are S.D. C–G. Tumors were harvested for analysis 28d after palpation. C. Representative images of H&E-stained tumor sections. D. Nuclei per 600X field of H&E-stained sections. Each point represents average of 5 fields/tumor. Student’s T-test. E. Total tumor volume per mouse was measured. Midlines are average, error bars are S.D. F. Western analysis of whole tumor lysates. Each lane represents one tumor. G. Intensity of P-Akt bands normalized to total Akt was quantitated using Image J. Values are average P-Akt per tumor. N = 3–4. H. IHC for P-Akt (S473) and Ki67. Representative images are shown, original magnification = 600X. I. The Ki67+ fraction of nuclei was counted. Each data point is average of 5 fields/tumor. Midline (average), error bar (S.D.) Student’s T-test.
RictorFL/FLNIC tumors harvested 28d after tumor palpation displayed reduced Rictor and decreased P-Akt S473, as assessed by western analysis of whole tumor lysates (Figure 3F–G). These results were confirmed by IHC for P-Akt S473 (Figure 3H). Ki67 staining was similar in Rictor+/+NIC and RictorFL/FLNIC tumors (Figure 3H–I). These data are consistent with the important role of Akt as an effector of HER2 signaling in breast tumorigenesis, and suggest that Rictor/mTORC2 is required for Akt phosphorylation in HER2-amplified tumor cells.
Rictor loss decreases growth and Akt S473 phosphorylation in established HER2-amplified breast cancer cells
Although mTORC1-selective inhibitors and mTORC1/2 dual kinase inhibitors currently exist, there are no mTORC2-selective inhibitors, and the impact of mTORC2-specific inhibition in the context of HER2-driven breast cancers is unclear. We addressed this by transducing HER2-amplified breast cancer cells with lentivirus encoding Rictor shRNA sequences (shRictor), or a scrambled control shRNA sequence (shScr). We confirmed Rictor depletion in SKBR3 (HER2amp), MDA-MB-361 (PIK3CAE545KHER2amp), and BT474 (PIK3CAK111NHER2amp) cells. Cells expressing shRictor displayed robust down-regulation of Rictor protein and decreased P-Akt S473 (Figure 4A). Rictor knockdown decreased growth of SKBR3, MDA-MB-361, and BT474 cells grown in monolayer (Figure 4B and Supplemental Figure S5B), or embedded in three-dimensional (3D) Matrigel (Figure 4C and Supplemental Figure S5C). To deplete Rictor using an independent method, zinc-finger nucleases (ZFNs) with specific homology to Rictor genomic sequences (ZFN-Rictor) were used to engineer homozygous RICTOR genomic deletions in MCF10A-HER2 cells. This approach confirmed that Rictor ablation decreased P-Akt S473 (Supplemental Figure S5A). MCF10A-HER2 cells expressing ZFN-Rictor exhibited decreased growth in monolayer and in 3D Matrigel as compared to parental MCF10-HER2 cells (Supplemental Figure S5D-S5F).
Figure 4. Rictor loss decreases growth and Akt S473 phosphorylation in established HER2-amplified breast cancer cells.
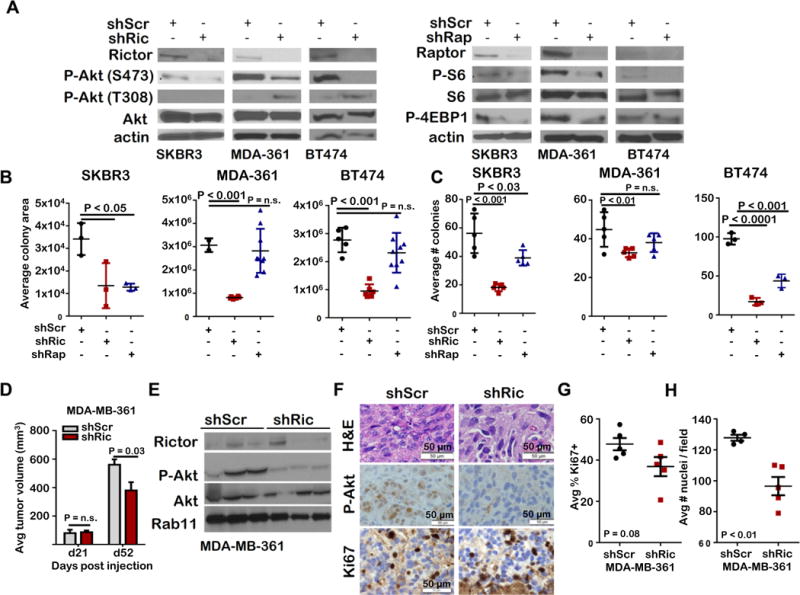
Breast cancer cells expressing shRNA for RICTOR or RPTOR were assessed. A. Whole cell lysates were assessed by western analysis. Representative blots shown. N=3 replicates. B. Cells were cultured 14d, stained with crystal violet, and scanned for fluorescent area using Odyssey. Midlines are average colony area, individual points are the average values obtained for samples assessed in duplicate, N = 3. Student’s T-test. C. Cells were embedded in Matrigel, cultured 14d, imaged, and colonies were counted. Midlines represent average number of colonies, data points represent the average value of duplicate samples. D–G. MDA-MB-361 shControl and shRictor xenografts were assessed. D. Tumors were measured and volume calculated (N = 8). Student’s T-test, P < 0.05. E. Western analysis of whole tumor lysates. Representative images are shown. F. Tumor sections were stained for H&E, P-Akt S473, and Ki67. Representative images are shown. Original magnification = 400X. G. Ki67-positive nuclei were quantitated using Image J. Data points represent the average value of 5 images per tumor, Midlines are average. Error bars are S.D. N = 4–5 tumors. Student’s T-test, P < 0.05. H. Average nuclei per field is shown (midlines). Error bars are S.D. Each data point is average of 5 images/tumor. Student’s T-test, P < 0.05.
Because mTORC2 activates Akt, which in turn activates mTORC1, it is possible that the effects of Rictor/mTORC2 targeting seen here are due to inhibition of Akt-mediated mTORC1 signaling. Therefore, it was important to distinguish the relative impacts of mTORC1 inhibition versus mTORC2 inhibition in this scenario. Thus, we assessed HER2-amplified breast cancer cells with knockdown of Raptor, the mTORC1 obligate cofactor. We confirmed Raptor depletion in SKBR3, MDA-MB-361 and BT474 cells (Figure 4A, right panel), finding decreased phosphorylation of the mTORC1 effectors ribosomal protein S6 and 4-EBP1. Raptor knockdown cells were assessed in parallel to Rictor knockdown cells in growth assays. Interestingly, S6 phosphorylation was not affected by inhibition of mTORC2. While Raptor ablation decreased growth of SKBR3 cells in monolayer, Raptor knockdown did not impact growth of MDA-MB-361 or BT474 cells in monolayer (Figure 4B and Supplemental Figure S5B). In 3D Matrigel cultures, shRaptor decreased colony formation in SKBR3 and BT474 cells, but not MDA-MB-361 cells (Figure 4C and Supplemental Figure S5C). In all cases, genetic Rictor/mTORC2 targeting decreased HER2-amplified breast cancer cell growth to an equal or greater extent than Raptor/mTORC1 targeting.
Xenografted MDA-MB-361 cells expressing shRictor formed palpable tumors 7–14 days after injection, similar to tumor formation in controls, suggesting that Rictor depletion did not affect tumor take rate in this model. Tumor measurements revealed similar tumor volumes in shScr and shRictor samples at 21 days post-injection, but decreased volume of shRictor tumors at 52 days post injection (Figure 4D). Tumors assessed at day 52 confirmed decreased Rictor and P-Akt S473 in shRictor tumors (Figure 4E–F). Cell proliferation was not affected by Rictor ablation in this xenograft model (Figure 4F–G), although shRictor tumors displayed fewer nuclei per 400X field (Figure 4F–4H).
Rictor-mediated Akt activation controls survival of HER2-positive breast cancer cells
The percentage of TUNEL+ cells was increased nearly 4-fold in spontaneous RictorFL/FLNIC tumors over controls (Figure 5A). Similarly, the cellular fraction staining with Annexin V, a marker of dying cells, was increased upon Rictor knockdown in MDA-MB-361, SKBR3 and BT474 cells (Figure 5B, Supplemental Figure S6A), and in MCF10A-HER2 cells lacking Rictor expression (Rictor-ZFN) (Supplemental Figure S6B–C). In contrast, shRaptor did not affect the percentage of Annexin V-positive SKBR3, MDA-MB-361, or BT474 cells (Figure 5B). Similar results were observed using a luminescent caspase 3/7 assay to measure caspase activity, demonstrating that shRictor, but not shRaptor, increased caspase activity (Figure 5C, Supplemental Figure S6A). MDA-MB-361-shRictor xenografts exhibited nearly 10-fold increased percentage of TUNEL+ tumor cells over shScr controls (Figure 5D), suggesting that tumor cell survival is affected downstream of Rictor/mTORC2 ablation, but not Raptor/mTORC1 ablation.
Figure 5. Rictor/mTORC2 signaling drives Akt-mediated survival of HER2-amplified breast cancers.
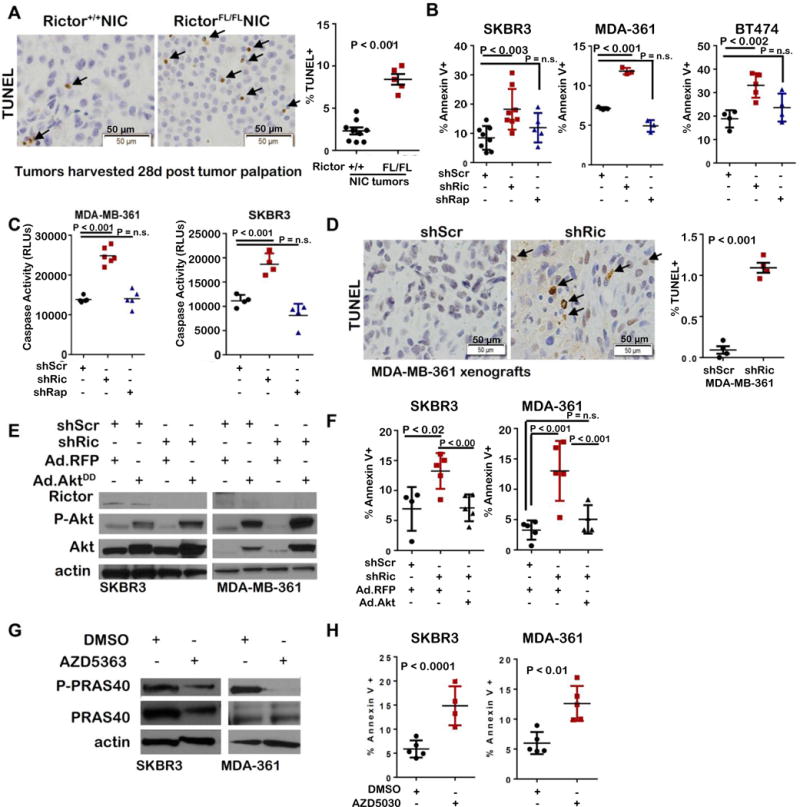
A. IHC for TUNEL positive cells in tumors harvested 28d after tumor palpation. Left panel: Representative images; original magnification, 400X. Right panel: The percentage of TUNEL+ tumor cells was determined. Each datapoint represents the average of 5 fields per tumor. Midline is average per genotype. Error bars are S.D. B. Cells labeled with Annexin V-FITC were imaged. Individual points are average for duplicate replicates. Midlines are average ± S.D. C. Cells were analyzed for caspase 3/7-mediated luminescence. Midlines are the average ± S.D. D. TUNEL analysis of MDA-MB-361 tumor sections. Left panel: Representative images; original magnification, 400X. Right panel: The percentage of TUNEL+ tumor cells was determined. Each datapoint represents the average of 5 fields per tumor. Midline is the average ± S.D. E–F. Cells expressing AktDD or RFP were assessed. E. Western analysis of whole cell lysates. F. Cells labeled with Annexin V-FITC for 6h were imaged. Midlines are the average ± S.D. G–H. Analysis of cells treated with AZD5363 (500 nM) for 24 hrs. G. Western analysis of whole cell lysates. H. Cells labeled with Annexin V-FITC for 6h were imaged. Individual points are average for replicates assessed in duplicate. Midlines are the average ± S.D. Student’s T-test.
To test the hypothesis that Rictor-to-Akt signaling drives survival of HER2+ breast cancer cells, we expressed active Akt phospho-mimetic (Ad.AktDD) in SKBR3-shRictor and MDA-MB-361-shRictor cells, rescuing P-Akt S473 despite sustained Rictor depletion (Figure 5E). Restoration of P-Akt in Rictor-depleted cells increased cell survival (Figure 5F, Supplemental Figure S7A). Conversely, the allosteric Akt kinase inhibitor AZD5363, which decreased phosphorylation of the Akt substrate PRAS40 (Figure 5G), decreased survival of parental SKBR3 and MDA-MB-361 cells (Figure 5H, Supplemental Figure S7B), suggesting that HER2-amplified breast cancer cells require Rictor-mediated Akt phosphorylation for cell survival. These results confirm that cell death occurs in response to loss of Rictor/mTORC2 signaling to Akt, but independently of Akt-mediated mTORC1 activation.
Rictor ablation enhances lapatinib-mediated cell death in HER2+ breast cancer cells
We tested the impact of Rictor/mTORC2 loss on therapeutically-induced tumor cell death, using lapatinib to block HER2 kinase activity in SKBR3, MDA-MB-361, and BT474 cells. Within 0.5h, lapatinib (1μM) decreased P-HER2 and P-Akt S473, as expected (Figure 6A). However, P-Akt S473 re-emerged after 4–8 h of lapatinib treatment, correlating temporally with Rictor (but not Raptor) protein upregulation, despite sustained suppression of P-HER2 and P-S6 (Figure 6A). RICTOR mRNA levels were increased after 4–8 h of lapatinib treatment in each cell line tested (Figure 6B), as was RPTOR (Supplemental Figure S8).
Figure 6. Rictor/mTORC2 loss increases lapatinib-mediated cell killing.
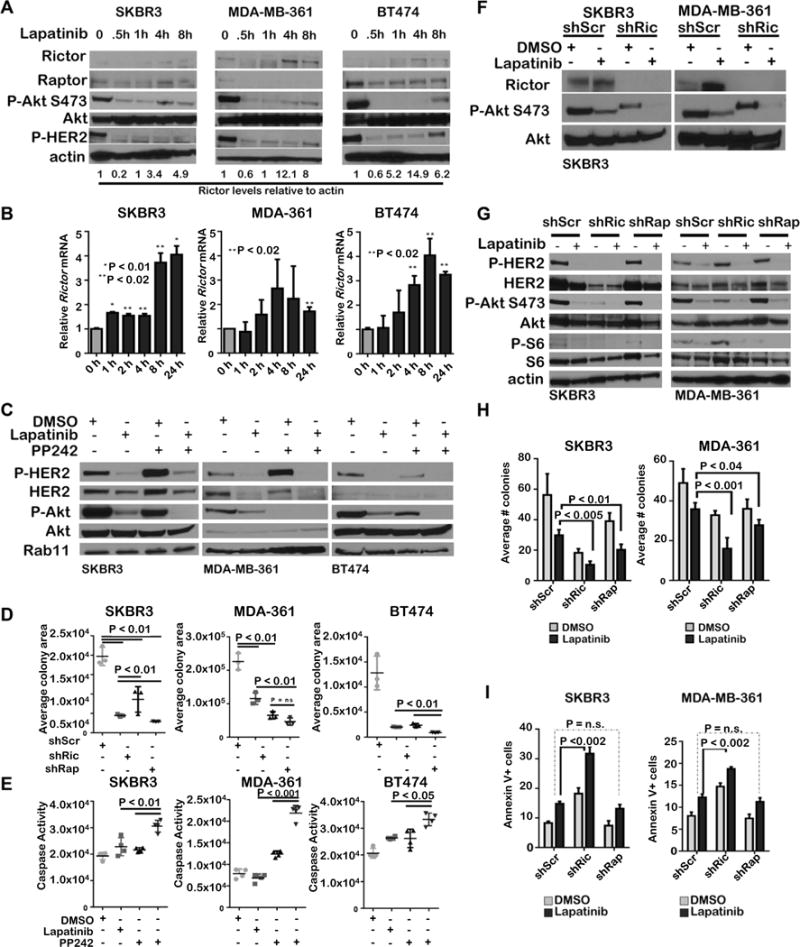
A–B. Cells treated with lapatinib (1uM) were assessed by western blot (A) or qRT PCR (B). N=3 replicates. Student’s T-test. C-E. Cells treated 6h (C and E) or 7 days (D) with PP242 (1 μM) ± lapatinib (1 μM) were analyzed by western analysis (C), for cell density by crystal violet staining (D). or for cell death by luminescent caspase assay (E). Midlines in D and E are the average ± S.D.. Student’s T-test. F-G. Cells treated 6h with PP242 (1 μM) ± lapatinib (1 μM) were analyzed by western analysis. H. Cells embedded in Matrigel were cultured 14d with PP242 (1 μM) ± lapatinib (1 μM) then imaged and colonies were enumerated. Values shown are the average ± S.D., N =3, each assessed in duplicate. I. Annexin V-FITC staining of cells cultured 6h with PP242 (1 μM) ± lapatinib (1 μM) Values shown are the average ± S.D. N = 3.
We next examined the effect of pharmacological mTORC1/2 inhibition on tumor cell response to lapatinib. As expected, lapatinib treatment blocked P-HER2 in SKBR3, MDA-MB-361 and BT474 cells, and decreased P-S6 and P-Akt S473 (Figure 6C). Dual mTORC1/2 inhibition using PP242 inhibited P-S6 and reduced P-Akt S473. However, combined treatment with lapatinib and PP242 completely abolished P-Akt S473 and P-S6 in all three cell lines. Although PP242 and lapatinib each decreased growth of SKBR3, MDA-MB-361, and BT474 cells as single agents, the combination of lapatinib with PP242 blocked cell growth to a greater degree than either agent alone (Figure 6D, Supplemental Figure S9). Further, the combination of lapatinib with PP242 increased caspase activity to a greater degree than either agent alone. (Figure 6E).
To define the impact of mTORC2-specific ablation on lapatinib-mediated cell death, we used SKBR3 and MDA-MB-361 cells expressing shRictor. HER2 inhibition combined with Rictor depletion decreased P-Akt S473 to a greater extent than lapatinib alone (Figure 6F). In contrast, shRaptor had no impact on P-Akt S473, but effectively blocked P-S6 (Figure 6G). Although lapatinib as a single agent decreased growth of SKBR3 and MDA-MB-361 acini in 3D Matrigel, the combination of lapatinib plus shRictor produced the greatest degree of growth inhibition (Figure 6H and Supplemental Figure S10A). The combination of lapatinib plus shRaptor blocked growth more than lapatinib alone, but not to the same extent as shRictor. Lapatinib-mediated cell death as measured by Annexin-V staining was highest in cells expressing shRictor as compared to shScr or shRaptor (Figure 6I, Supplemental Figure S10B). These data suggest that Rictor/mTORC2 targeting in HER2-amplified breast cancer cells improves tumor cell response to lapatinib.
Rictor/mTORC2 targeting blocks P-Akt S473 and cell survival in models of lapatinib resistance
To assess the requirement of mTORC1/2 in lapatinib-resistant cells, we used lapatinib-resistant SKBR3, MDA-MB-361, and BT474 cells. These cells were rendered lapatinib-resistant by culturing in progressively increasing concentrations of lapatinib for >6 months, and have been previously described (14). After withdrawing lapatinib for 48 hours, we treated SKBR3-LR, MDA-MB-361-LR and BT474-LR cells with lapatinib in the presence or absence of PP242. While P-HER2 and P-AktS473 were unaffected by lapatinib treatment, PP242 abolished P-Akt S473 (Figure 7A). PP242, but not lapatinib, decreased growth of SKBR3-LR, MDA-MB-361-LR and BT474-LR cells (Figure 7B). Caspase 3/7 activity was increased in cells treated with PP242, but not in cells treated with lapatinib (Figure 7C).
Figure 7. Rictor/mTORC2 blocks P-Akt and induces cell death in lapatinib-resistant HER2-amplified tumor cells.

Lapatinib-resistant (LR) cells were lapatinib-starved 48h prior to experimentation. A. Cells were treated 6h with PP242 (1μM) ± lapatinib (1μM) and assessed by western analysis. B. Cells were seeded and cultured in monolayer for 7d with PP242 (1μM) ± lapatinib (1μM) in 10% serum, stained with crystal violet, and scanned (Odyssey) for quantitation of cystal violet fluorescence. C. Cells were treated 6h with PP242 (1μM) ± lapatinib (1μM) and assessed by luminescent caspase-3/7 assay. D. Whole cell lysates and mTOR immunoprecipitates from BT474 and BT474-LR whole cell lysates were assessed by western analysis. E. Cells stably transduced with scrambled (shScr) or two distinct Rictor shRNA sequences (shRictor seq1 and seq2) were assessed by western analysis. F. Cells were seeded and cultured in monolayer for 7d ± lapatinib (1μM) in 10% serum. Cells were stained with crystal violet and scanned (Odyssey) for fluorescence quantitation. G. Cells were embedded in Matrigel and cultured 14d ± lapatinib (1μM). Colonies were imaged and enumerated. H. Cells were treated 6h ± lapatinib (1μM) and assessed by luminescent caspase-3/7 assay. For data shown in B, C, F, G, and H, midlines are the average ± S.D., individual points are individual replicates each assessed in duplicate.
We examined mTORC2 complex assembly in BT474 and BT474-LR cells using co-immunoprecipitation (co-IP) for mTOR with Rictor. Rictor co-precipitated with mTOR in both parental and BT474-LR cells (Figure 7D), confirming mTORC2 complex assembly. Interestingly, Raptor co-precipitated with mTOR to a lesser extent in BT474-LR cells as compared to what was seen in parental BT474 cells.
Since PP242 blocks both mTORC1 and mTORC2, we assessed the impact of Rictor/mTORC2-specific targeting in LR cells by Rictor knock-down, which was confirmed by western analysis (Figure 7E). Lapatinib did not affect the growth of SKBR3-LR, MDA-MB-361-LR, and BT474-LR cells expressing shScr, while cells expressing shRictor grew at a decreased rate (Figure 7F–G). Further, LR cells expressing shRictor exhibited increased cell death over shScr. (Figure 7H), suggesting that lapatinib-resistant cells are exquisitely sensitive to Rictor/mTORC2 targeting.
Taken together, these data highlight the critical role of Rictor/mTORC2 in activating Akt to support genesis, growth and survival of HER2-amplified breast cancers.
Discussion
Approximately 20% of breast cancers exhibit overexpression of human epithelial growth factor receptor 2 (HER2), a marker of aggressive disease (16). The studies presented here uncover the key roles played by mTORC2/Rictor in models of HER2-amplified breast cancer initiation, maintenance, and progression. Our results show that RICTOR ablation in a transgenic mouse model of HER2-driven breast cancer decreased tumor formation and tumor multiplicity, suggesting that Rictor promotes the genesis of HER2-overexpressing tumors. Consistent with the idea that mTORC2 is a key factor in Akt phosphorylation, Rictor depletion decreased Akt S473 phosphorylation and tumor cell survival in this model of spontaneous breast cancer. Further, RICTOR loss decreased Akt activation (P-S473) and cell survival in multiple HER2-amplified human breast cancer cell lines, including lines with activating PIK3CA mutations. Other intracellular serine-threonine kinases are capable of Akt S473 phosphorylation, including IKK-α, DNA-PK, and ILK (2). However, our studies suggest that HER2+ human breast cancer cells and mouse mammary tumors specifically require Rictor/mTORC2 for Akt S473 phosphorylation, as Rictor ablation eliminated Akt phosphorylation and decreased cell survival. Interestingly, this is distinct from what is seen in untransformed MECs, which rely on an Akt-independent, Rictor-PKCa-Rac1 signaling axis for cell survival, invasion, and morphogenesis (8).
Several pre-clinical studies demonstrate that Akt/mTOR inhibition is critical for full therapeutic response to HER2 inhibition in HER2-amplified breast cancers (17, 18). However, most clinical and preclinical studies have focused primarily on mTOR associated with mTORC1, perhaps because mTORC1 is activated downstream of HER2/PI3K signaling. While mTORC1 blockade produces therapeutic benefit, mTORC1 inhibition also induces resurgent PI3K signaling in tumor cells, reducing net anti-tumor activity, and driving therapeutic resistance. mTOR kinase inhibitors, which target both mTORC1 and mTORC2, have generated intense interest, though little is known about mTORC2-specific signaling in breast cancers. Our analyses, using novel transgenic mouse models and genetic inhibition of mTORC2 reveal a key role for Rictor/mTORC2 in HER2-amplified breast cancers, including those with acquired resistance to lapatinib.
Our studies confirm Rictor overexpression in invasive human breast tumors as reported by Zhang et al (19). RICTOR gene amplification and Rictor overexpression was noted in a subset of lung cancer patients with susceptibility to mTORC1/2 dual kinase inhibitors(20). Rictor overexpression was also reported in melanomas(21), glioblastomas (22, 23), gastric cancers(24), and hepatocellular carcinomas(25), supporting a potential role for mTORC2 components in aggressive tumors, and highlighting Rictor/mTORC2 as a potential therapeutic target.
As AKT1/2/3 and RICTOR gene mutations are rare in breast cancer (Figure 1A and Supplemental Figure S3), Akt and Rictor possibly are regulated at the levels of gene amplification, transcription, and/or catalytic activity. One recent study identified RICTOR transcripts as a miR-218 target, suggesting cancers may benefit from miR-218 loss in part through upregulation of Rictor/mTORC2. Another study demonstrated glucose-induced Rictor acetylation, which sustained mTORC2 activation in the absence of upstream signaling input, driving therapeutic resistance to inhibitors of the PI3K pathway (PMC4522814). Another study showed Rictor T1135 phosphorylation by the kinase S6K1, which down-regulated mTORC2 activity, suggesting that alterations in signaling pathways upstream of S6K1 could affect mTORC2. Because the mTORC2 substrate Akt was more frequently upregulated in HER2-positive breast cancers than in TNBC (Figure 1), we focused our studies on HER2-amplified breast cancers. However, Rictor expression was more frequently elevated in triple negative breast cancers (TNBC) than in HER2-positive breast cancers (Table 1), suggest that Rictor/mTORC2 signaling is not exclusive to HER2 tumors, but that its role in TNBCs may be independent of HER2 and Akt.
In summary, we have defined a previously unreported role for Rictor/mTORC2 in the genesis, maintenance, and therapeutic response of HER2-driven breast cancers. We have shown that Rictor/mTORC2 blockade is effective at each stage in the natural history of HER2-amplified tumors, supporting continued translational investigations of dual mTORC1/2 inhibitors to improve the outcome for patients with HER2-amplified breast cancers, and warranting future efforts to develop mTORC2-specific inhibitors.
Supplementary Material
Precis.
mTORC2 inhibition may offer a promising therapeutic strategy to help eradicate HER2-amplified breast cancers, especially in those cases where Akt signaling is activated or tumors are resistant HER2 targeted therapy.
Acknowledgments
Financial support: R.S. Cook received NIH award R01CA143126 and Susan G. Komen for the Cure grant KG100677. M. Morrison-Joly received NRSA F31 pre-doctoral award CA186329-01.and CTSA award No. UL1TR000445 from the National Center for Advancing Translational Sciences. M. Williams received NRSA F31 pre-doctoral award CA195989-01. C.D. Young received CDMRP-BCRP award W81XWH-12-1-0026.
Footnotes
The authors have declared that no conflict of interest exists.
References
- 1.Engelman JA. Targeting PI3K signalling in cancer: opportunities, challenges and limitations. Nature reviews Cancer. 2009 Aug;9(8):550–62. doi: 10.1038/nrc2664. [DOI] [PubMed] [Google Scholar]
- 2.McDonald PC, Oloumi A, Mills J, Dobreva I, Maidan M, Gray V, Wederell ED, Bally MB, Foster LJ, Dedhar S. Rictor and integrin-linked kinase interact and regulate Akt phosphorylation and cancer cell survival. Cancer research. 2008 Mar 15;68(6):1618–24. doi: 10.1158/0008-5472.CAN-07-5869. [DOI] [PubMed] [Google Scholar]
- 3.Kim DH, Sarbassov DD, Ali SM, King JE, Latek RR, Erdjument-Bromage H, Tempst P, Sabatini DM. mTOR interacts with raptor to form a nutrient-sensitive complex that signals to the cell growth machinery. Cell. 2002 Jul 26;110(2):163–75. doi: 10.1016/s0092-8674(02)00808-5. [DOI] [PubMed] [Google Scholar]
- 4.Guertin DA, Stevens DM, Thoreen CC, Burds AA, Kalaany NY, Moffat J, Brown M, Fitzgerald KJ, Sabatini DM. Ablation in mice of the mTORC components raptor, rictor, or mLST8 reveals that mTORC2 is required for signaling to Akt-FOXO and PKCalpha, but not S6K1. Developmental cell. 2006 Dec;11(6):859–71. doi: 10.1016/j.devcel.2006.10.007. [DOI] [PubMed] [Google Scholar]
- 5.Oh WJ, Jacinto E. mTOR complex 2 signaling and functions. Cell cycle. 2011 Jul 15;10(14):2305–16. doi: 10.4161/cc.10.14.16586. [DOI] [PMC free article] [PubMed] [Google Scholar]
- 6.Zhang Z, Zhang G, Xu X, Su W, Yu B. mTOR-rictor is the Ser473 kinase for AKT1 in mouse one-cell stage embryos. Molecular and cellular biochemistry. 2012 Feb;361(1-2):249–57. doi: 10.1007/s11010-011-1110-0. [DOI] [PubMed] [Google Scholar]
- 7.Sarbassov DD, Guertin DA, Ali SM, Sabatini DM. Phosphorylation and regulation of Akt/PKB by the rictor-mTOR complex. Science. 2005 Feb 18;307(5712):1098–101. doi: 10.1126/science.1106148. [DOI] [PubMed] [Google Scholar]
- 8.Morrison MM, Young CD, Wang S, Sobolik T, Sanchez VM, Hicks DJ, Cook RS, Brantley-Sieders DM. mTOR Directs Breast Morphogenesis through the PKC-alpha-Rac1 Signaling Axis. PLoS Genet. 2015 Jul;11(7):e1005291. doi: 10.1371/journal.pgen.1005291. [DOI] [PMC free article] [PubMed] [Google Scholar]
- 9.Balko JM, Miller TW, Morrison MM, Hutchinson K, Young C, Rinehart C, Sanchez V, Jee D, Polyak K, Prat A, Perou CM, Arteaga CL, Cook RS. The receptor tyrosine kinase ErbB3 maintains the balance between luminal and basal breast epithelium. Proc Natl Acad Sci U S A. 2012 Jan 3;109(1):221–6. doi: 10.1073/pnas.1115802109. [DOI] [PMC free article] [PubMed] [Google Scholar]
- 10.Morrison MM, Hutchinson K, Williams MM, Stanford JC, Balko JM, Young C, Kuba MG, Sanchez V, Williams AJ, Hicks DJ, Arteaga CL, Prat A, Perou CM, Earp HS, Massarweh S, Cook RS. ErbB3 downregulation enhances luminal breast tumor response to antiestrogens. J Clin Invest. 2013 Oct 1;123(10):4329–43. doi: 10.1172/JCI66764. [DOI] [PMC free article] [PubMed] [Google Scholar]
- 11.Qu S, Rinehart C, Wu HH, Wang SE, Carter B, Xin H, Kotlikoff M, Arteaga CL. Gene targeting of ErbB3 using a Cre-mediated unidirectional DNA inversion strategy. Genesis. 2006 Oct;44(10):477–86. doi: 10.1002/dvg.20243. [DOI] [PubMed] [Google Scholar]
- 12.Shiota C, Woo JT, Lindner J, Shelton KD, Magnuson MA. Multiallelic disruption of the rictor gene in mice reveals that mTOR complex 2 is essential for fetal growth and viability. Developmental cell. 2006 Oct;11(4):583–9. doi: 10.1016/j.devcel.2006.08.013. [DOI] [PubMed] [Google Scholar]
- 13.Northey JJ, Chmielecki J, Ngan E, Russo C, Annis MG, Muller WJ, Siegel PM. Signaling through ShcA is required for transforming growth factor beta- and Neu/ErbB-2-induced breast cancer cell motility and invasion. Molecular and cellular biology. 2008 May;28(10):3162–76. doi: 10.1128/MCB.01734-07. [DOI] [PMC free article] [PubMed] [Google Scholar]
- 14.Rexer BN, Ham AJ, Rinehart C, Hill S, Granja-Ingram Nde M, Gonzalez-Angulo AM, Mills GB, Dave B, Chang JC, Liebler DC, Arteaga CL. Phosphoproteomic mass spectrometry profiling links Src family kinases to escape from HER2 tyrosine kinase inhibition. Oncogene. 2011 Oct 6;30(40):4163–74. doi: 10.1038/onc.2011.130. [DOI] [PMC free article] [PubMed] [Google Scholar]
- 15.Finkle D, Quan ZR, Asghari V, Kloss J, Ghaboosi N, Mai E, Wong WL, Hollingshead P, Schwall R, Koeppen H, Erickson S. HER2-targeted therapy reduces incidence and progression of midlife mammary tumors in female murine mammary tumor virus huHER2-transgenic mice. Clinical cancer research: an official journal of the American Association for Cancer Research. 2004 Apr 1;10(7):2499–511. doi: 10.1158/1078-0432.ccr-03-0448. [DOI] [PubMed] [Google Scholar]
- 16.Ross JS, Fletcher JA. The HER-2/neu Oncogene in Breast Cancer: Prognostic Factor, Predictive Factor, and Target for Therapy. The oncologist. 1998;3(4):237–52. [PubMed] [Google Scholar]
- 17.Miller TW, Forbes JT, Shah C, Wyatt SK, Manning HC, Olivares MG, Sanchez V, Dugger TC, de Matos Granja N, Narasanna A, Cook RS, Kennedy JP, Lindsley CW, Arteaga CL. Inhibition of mammalian target of rapamycin is required for optimal antitumor effect of HER2 inhibitors against HER2-overexpressing cancer cells. Clinical cancer research: an official journal of the American Association for Cancer Research. 2009 Dec 1;15(23):7266–76. doi: 10.1158/1078-0432.CCR-09-1665. [DOI] [PMC free article] [PubMed] [Google Scholar]
- 18.Miller TW, Rexer BN, Garrett JT, Arteaga CL. Mutations in the phosphatidylinositol 3-kinase pathway: role in tumor progression and therapeutic implications in breast cancer. Breast cancer research: BCR. 2011;13(6):224. doi: 10.1186/bcr3039. [DOI] [PMC free article] [PubMed] [Google Scholar]
- 19.Zhang F, Zhang X, Li M, Chen P, Zhang B, Guo H, Cao W, Wei X, Cao X, Hao X, Zhang N. mTOR complex component Rictor interacts with PKCzeta and regulates cancer cell metastasis. Cancer research. 2010 Nov 15;70(22):9360–70. doi: 10.1158/0008-5472.CAN-10-0207. [DOI] [PubMed] [Google Scholar]
- 20.Cheng H, Zou Y, Ross JS, Wang K, Liu X, Halmos B, Ali SM, Liu H, Verma A, Montagna C, Chachoua A, Goel S, Schwartz EL, Zhu C, Shan J, Yu Y, Gritsman K, Yelensky R, Lipson D, Otto G, Hawryluk M, Stephens PJ, Miller VA, Piperdi B, Perez-Soler R. RICTOR amplification defines a novel subset of lung cancer patients who may benefit from treatment with mTOR1/2 inhibitors. Cancer Discov. 2015 Sep 14; doi: 10.1158/2159-8290.CD-14-0971. [DOI] [PMC free article] [PubMed] [Google Scholar]
- 21.Laugier F, Finet-Benyair A, Andre J, Rachakonda PS, Kumar R, Bensussan A, Dumaz N. RICTOR involvement in the PI3K/AKT pathway regulation in melanocytes and melanoma. Oncotarget. 2015 Sep 29;6(29):28120–31. doi: 10.18632/oncotarget.4866. [DOI] [PMC free article] [PubMed] [Google Scholar]
- 22.Masri J, Bernath A, Martin J, Jo OD, Vartanian R, Funk A, Gera J. mTORC2 activity is elevated in gliomas and promotes growth and cell motility via overexpression of rictor. Cancer research. 2007 Dec 15;67(24):11712–20. doi: 10.1158/0008-5472.CAN-07-2223. [DOI] [PubMed] [Google Scholar]
- 23.Tanaka K, Babic I, Nathanson D, Akhavan D, Guo D, Gini B, Dang J, Zhu S, Yang H, De Jesus J, Amzajerdi AN, Zhang Y, Dibble CC, Dan H, Rinkenbaugh A, Yong WH, Vinters HV, Gera JF, Cavenee WK, Cloughesy TF, Manning BD, Baldwin AS, Mischel PS. Oncogenic EGFR signaling activates an mTORC2-NF-kappaB pathway that promotes chemotherapy resistance. Cancer Discov. 2011 Nov;1(6):524–38. doi: 10.1158/2159-8290.CD-11-0124. [DOI] [PMC free article] [PubMed] [Google Scholar]
- 24.Bian Y, Wang Z, Xu J, Zhao W, Cao H, Zhang Z. Elevated Rictor expression is associated with tumor progression and poor prognosis in patients with gastric cancer. Biochem Biophys Res Commun. 2015 Aug 21;464(2):534–40. doi: 10.1016/j.bbrc.2015.07.001. [DOI] [PubMed] [Google Scholar]
- 25.Kaibori M, Shikata N, Sakaguchi T, Ishizaki M, Matsui K, Iida H, Tanaka Y, Miki H, Nakatake R, Okumura T, Tokuhara K, Inoue K, Wada J, Oda M, Nishizawa M, Kon M. Influence of Rictor and Raptor Expression of mTOR Signaling on Long-Term Outcomes of Patients with Hepatocellular Carcinoma. Dig Dis Sci. 2015 Apr;60(4):919–28. doi: 10.1007/s10620-014-3417-7. [DOI] [PubMed] [Google Scholar]
Associated Data
This section collects any data citations, data availability statements, or supplementary materials included in this article.