

Summary
Innate lymphocyte populations, such as innate lymphoid cells (ILCs), γδ T cells, invariant natural killer T (iNK T) cells and mucosal‐associated invariant T (MAIT) cells are emerging as important effectors of innate immunity and are involved in various inflammatory and autoimmune diseases. The aim of this study was to assess the frequencies and absolute numbers of innate lymphocytes as well as conventional lymphocytes and monocytes in peripheral blood from a cohort of anti‐neutrophil cytoplasm autoantibody (ANCA)‐associated vasculitis (AAV) patients. Thirty‐eight AAV patients and 24 healthy and disease controls were included in the study. Patients with AAV were sampled both with and without immunosuppressive treatment, and in the setting of both active disease and remission. The frequencies of MAIT and ILC2 cells were significantly lower in patients with AAV and in the disease control group compared to healthy controls. These reductions in the AAV patients remained during remission. B cell count and frequencies were significantly lower in AAV in remission compared to patients with active disease and disease controls. Despite the strong T helper type 2 (Th) preponderance of eosinophilic granulomatosis with polyangiitis, we did not observe increased ILC2 frequency in this cohort of patients. The frequencies of other cell types were similar in all groups studied. Reductions in circulating ILC2 and MAIT cells reported previously in patients with AAV are not specific for AAV, but are more likely to be due to non‐specific manifestations of renal impairment and chronic illness. Reduction in B cell numbers in AAV patients experiencing remission is probably therapy‐related.
Keywords: ANCA‐associated vasculitis, innate lymphoid cells, mucosal‐associated invariant T cells
Introduction
Anti‐neutrophil cytoplasm antibody (ANCA)‐associated vasculitis (AAV) refers to a group of severe multi‐system autoimmune diseases affecting the microvasculature. This encompasses microscopic polyangiitis (MPA), granulomatosis with polyangiitis (GPA, formally known as Wegener's granulomatosis) and eosinophilic granulomatosis with polyangiitis (EGPA, formerly known as Churg–Strauss syndrome) 1, 2. AAV is characterized by relapsing necrotizing vasculitis of small blood vessels, frequently involving the kidneys and lungs with pauci‐immune glomerulonephritis and alveolar capillaritis, respectively 3. In most cases of GPA and MPA and in approximately 35% of EGPA cases, autoantibodies directed against myeloperoxidase (MPO) or proteinase‐3 (PR3) are present 4. Substantial clinical and experimental evidence indicates that these autoantibodies drive disease pathogenesis 5.
Innate lymphocyte populations, such as mucosal associated invariant T (MAIT) cells, invariant natural killer T (iNK T), γδ T cells and innate lymphoid cells (ILCs), are emerging as important effectors of autoinflammatory and autoimmune diseases 6, 7, 8, 9, 10, 11, 12, 13. ILCs are divided into three groups (ILC1, ILC2, ILC3 and lymphoid tissue inducer or LTi cells) based on their dependence upon transcription factors for development and function, and on cytokines they produce 6, 14, 15, 16, 17. ILCs are usually identified by the absence of markers specific for T cells, B cells and other haematopoietic cells. Human γδ T cells comprise three major subsets based on their T cell receptor (TCR) δ‐chain usage, with Vδ2 T cells being the predominant subset in blood and Vδ1 and Vδ3 T cells found most frequently at epithelial surfaces 11, 15. MAIT cells and iNK T cells express semi‐invariant TCRs and display limited heterogeneity 8, 9, 12, 13, 15. ILCs, γδ T cells, iNK T cells and MAIT cells are important in the innate response against pathogenic microorganisms, containment of commensals, tissue homeostasis and regulation of metabolism 16, 17. However, they might also have detrimental effects when dysregulated, leading to chronic inflammation and autoimmune diseases such as AAV 18. A recent study by Braudeau et al. 7 reported that MAIT and ILC2 cells are depressed persistently in AAV, leading to a conclusion that may be involved in disease pathogenesis.
In this study we assessed the frequencies of ILCs, γδ T cells, iNK T and MAIT cells, and of the major lymphocyte and monocyte subsets in peripheral blood mononuclear cells (PBMC) by flow cytometry from patients with AAV, healthy controls and, importantly, disease controls.
Materials and methods
Patients
Patients with GPA (n = 15), MPA (n = 14) and EGPA (n = 9) in active phase (AP) and remission phase (RP) were included, and compared with 10 healthy (HC) and 14 disease controls (DC) (Table 1). All AAV patients fulfilled the Chapel Hill Consensus Conference (CHCC) classification criteria 2. The AP of AAV was defined by a Birmingham Vasculitis Activity Score (BVAS) ≥ 2 (first diagnosis, n = 6; relapsing diagnosis, n = 7) and remission by BVAS = 0. Nine (50%) and 12 (57%) of the AP and RP AAV patients had biopsy‐proven renal vasculitis at some point since diagnosis. We wished to ascertain whether observed changes in immune cells were specific to the AAV autoimmune process or as a non‐specific consequence of AAV‐induced organ injury. The key organ injured in AAV is the kidney, and renal dysfunction is well described to alter immune function 19. Therefore, the DC group comprised patients with non‐autoimmune disease matched for age and excretory kidney function (type 2 diabetic nephropathy n = 4, ischaemic nephropathy n = 7, other n = 3). The ‘other’ category comprised patients with diverticulitis, aortic dissection and proton‐pump inhibitor‐induced renal tubular dysfunction.
Table 1.
Summary data for patient cohort
| Characteristics | HC | DC | AAV‐AP | AAV‐RP | ||
|---|---|---|---|---|---|---|
| No. | 10 | 14 | 17 | 21 | ||
| Age, median (range), years | 57 (45–68) | 65 (45–75) | 61 (27–81) | 60 (30–79) | ||
| Male/female | 5/5 | 9/5 | 9/8 | 13/8 | ||
| ANCA positivity, n (%) | Anti‐MPO | 0 | 0 | 8 (47·1) | 7 (47·6) | |
| Anti‐PR3 | 0 | 0 | 7 (41·2) | 8 (38·1) | ||
| Negative | 0 | 0 | 1 (5·9) | 2 (9·5) | ||
| Unknown | 0 | 0 | 1 (5·9) | 1 (4·8) | ||
| Diagnosis, n (median duration of follow‐up, month) | GPA | n.a. | n.a. | 8 (0) | 7 (86) | |
| MPA | n.a. | n.a. | 6 (0) | 8 (17) | ||
| EGPA | n.a. | n.a. | 3 (120) | 6 (62) | ||
| BVAS, median (range) | n.a. | n.a. | 14 (2–32) | 0 | ||
| CRP (mg/dl), median (IQR) | n.a. | 5 (3–23) | 18 (12·3–125) | 2 (1–5) | ||
| Creatinine (mmol/l), mean (s.e.m.) | n.a. | 179·5 (42·18) | 248·4 (71·3) | 177·2 (45·3) | ||
| eGFR (ml/min), mean (s.e.m.) | n.a. | 54·5 (9·5) | 60·2 (11·4) | 62·8 (8·3) | ||
| Immunosuppression treatment, n (%) | Treatment‐naive | Yes | Yes | 3 (18) | 0 | |
| Rituximab | 1–6 months | 0 | 0 | 1 (6) | 1 (5) | |
| > 6 months | 0 | 0 | 0 | 3 (14) | ||
| CYC | 1–6 months | 0 | 0 | 0 | 0 | |
| 6–12 months | 0 | 0 | 0 | 3 (14) | ||
| > 12 months | 0 | 0 | 2 (12) | 12 (57) | ||
| Aza | Current | 0 | 0 | 1 (6) | 8 (38) | |
| MMF | Current | 0 | 0 | 2 (12) | 2 (10) | |
| MTX | Current | n.a. | n.a. | 0 | 2 (10) | |
| Steroids | Current | n.a. | n.a. | 11 (65) | 11 (52) | |
Anti‐neutrophil cytoplasm autoantibody (ANCA)‐associated vasculitis (AAV)‐AP = AAV in active phase; AAV‐RP = AAV in remission phase; Aza = azathioprine; CRP = median C‐reactive protein; CYC = cyclophosphamide; DC = disease control; eGFR = estimated glomerular filtration rate; HC = healthy control; IQR = interquartile range; MMF = mycophenolate mofetil; MTX = methotrexate; MPA = microscopic polyangiitis; n.a. = not applicable; s.e.m.= standard error of the mean; MPO = myeloperoxidase; PR3 = proteinase‐3; BVAS = Birmingham Vasculitis Activity Score; GPA = granulomatosis with polyangiitis; EGPA = eosinophilic granulomatosis with polyangiitis.
Patients were recruited to the Rare Kidney Disease Registry and Biobank (http://www.tcd.ie/medicine/thkc/research/RKD-Registry-Biobank.php). The study was approved by the local ethical committee and all patients and controls provided written informed consent.
Biological samples
Venous blood samples were collected in ethylenediamine tetraacetic acid (EDTA) vacutainers. PBMC were isolated by a standard gradient centrifugation procedure on LymphoprepTM, frozen in complete RPMI medium [25 mM HEPES, 2 mM L‐glutamine, 50 ug/ml streptomycin, 50 U/ml penicillin and 10% heat‐inactivated fetal bovine serum (FBS)] containing a further 40% FBS and 10% dimethylsulphoxide (DMSO) and conserved in liquid nitrogen until use. For comparison of fresh and frozen samples, an aliquot of PBMCs was taken prior to freezing. These cells were stained for 20 min in the dark with anti‐CD3 allophycocyanin (APC) (REA613; Miltenyi Biotec, Woking, UK) for the identification of T cells, anti‐CD14 Pacific Blue (RM052; Beckman Coulter, Brea, CA, USA) for the identification of monocytes and anti‐CD19 APC‐cyanin 7 (Cy7) (H1B19; BioLegend, San Diego, CA, USA) for the identification of B cells. Flow cytometry was performed on a CyAn ADP analyser (Beckman Coulter). Single‐stain OneComp beads (eBioscience, San Diego, CA, USA) and fluorescence minus one (FMO) controls were used to correct for spectral overlap and non‐specific staining, respectively. Fluorescence activated cell sorter (FACS) analysis was performed using Kaluza version 1.2 flow analysis software (Beckman Coulter). Frozen samples were thawed 1 week later and flow cytometry was performed as for fresh samples.
Phenotypical analysis of PBMC
After thawing, PBMC samples were stained immediately with combinations of monoclonal antibodies as detailed in Supporting information, Table S1. The samples were analysed in eight batches, each batch containing a balanced number from each experimental group. Two million cells were stained and analysed in tube 1 and 250 000 cells were analysed in the other tubes. A dead cell stain (Fixable Viability Dye; eBioscience) was included in each tube. Cells were analysed on a FACSCanto II flow cytometer (BD, Dublin, Ireland) and data were analysed separately using FlowJo (FlowJo, Inc., Ashland, OR, USA) and Kaluza software (Beckman Coulter) by two independent investigators (A.M.O. and B.F.). Cell frequencies were expressed as percentages of total lymphocytes or total T cells. Absolute cell numbers (per litre of blood) were calculated from clinical full blood counts taken at the time of sampling to derive the absolute lymphocyte count, from which the individual cell counts were calculated.
The gating strategy used to identify single live lymphocytes is shown in Fig. 1a. ILC populations were identified and gated using FMO controls. The distinct populations of ILCs were defined as: total ILCs (Lin1–CD127+); ILC1 (Lin1–CD127+CRTH2–c‐Kit‐); ILC2 (Lin1–CD127+CRTH2+CD161+); ILC3 (Lin1–CD127+CRTH2–c‐Kit+NKp44+) and LTi (Lin1–CD127+CRTH2–c‐Kit+NKp44‐) 7. γδ T cells were identified as Vδ1+/CD3+, Vδ2+/CD3+ and Vδ3+CD3+ for Vδ1, Vδ2 and Vδ3 cells, respectively. iNK T cells were identified as Vα24Jα18+CD3+ cells. MAIT cells were defined as Vα7·2+CD161+CD8+ cells. CD4+, CD8+ and double‐negative (DN) T cells were identified as CD3+CD4+CD8–, CD3+CD4–CD8+ and CD3+CD4–CD8–, respectively. Natural killer (NK) cells were identified as CD3–CD56+CD16+/– cells and B cells as CD3–CD19+ 20. Monocytes were defined as CD14+CD16+/–cells not contained in the lymphocyte gate (Supporting information, Table S2).
Figure 1.
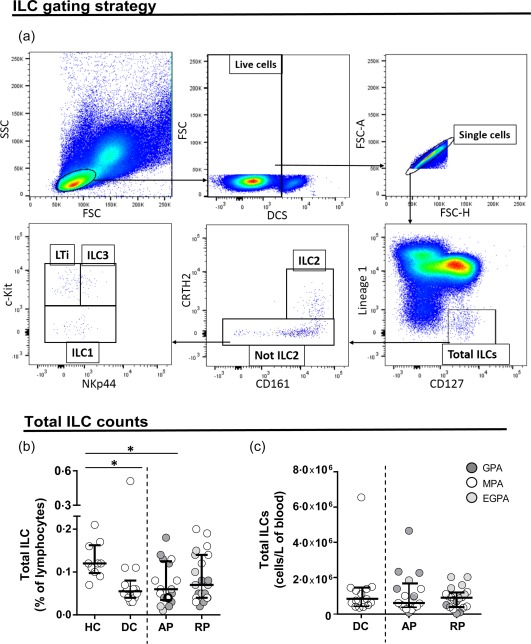
Total innate lymphoid cell (ILC) frequencies and absolute numbers are similar in anti‐neutrophil cytoplasm autoantibody (ANCA)‐associated vasculitis (AAV) patients and control subjects. (a) Flow cytometry gating strategy used for ILC detection. After gating on lymphocytes and live cells, the distinct ILC populations were defined as: total ILCs (Lin1–CD127+); ILC1 (Lin1–/CD127+/CRTH2–/c‐Kit–); ILC2 (Lin1–/CD127+/CRTH2+/CD161+); ILC3 (Lin1–/CD127+/CRTH2–/c‐Kit+/NKp44+) and LTi (Lin1–/CD127+/CRTH2–/c‐Kit+/NKp44–). (b) Frequencies of ILC subsets in healthy controls (HC), disease controls (DC) and AAV patients in active (AP) and remission phase (RP). AAV subtypes are denoted by circle colour as GPA ( ) MPA (○) and EGPA (
 ). (c) Absolute cell counts of ILC subsets in DC and AAV patients in active (AP) and remission phase (RP). Data represent median and interquartile range. One‐way analysis of variance (anova) was carried out using the non‐parametric Kruskal–Wallis test and Dunn's multiple comparison post‐test, **P < 0·01; *P < 0·05. [Colour figure can be viewed at wileyonlinelibrary.com]
Statistical analysis
All statistical analysis was performed using GraphPad Prism version 6.0 software (GraphPad Software, San Diego, CA, USA). One‐way analysis of variance (anova) was carried out using a non‐parametric Kruskal–Wallis test and Dunn's multiple‐comparison post‐hoc test. The correlation analysis was calculated using the non‐parametric Spearman's test. Differences were defined as statistically significant with a P‐value of <0·05.
Results
We assessed the frequencies and absolute cell counts of total ILCs, ILC1, ILC2, ILC3 and LTi, the Vδ1, Vδ2, Vδ3 subsets of γδ T cells, iNK T cells, MAIT cells and major lymphocyte and monocyte subsets by flow cytometry on PBMC from patients with GPA (n = 15), MPA (n = 14) and EGPA (n = 9), both with and without immunosuppressive treatment, in active phase and remission phase and compared them with healthy and disease controls. To ensure that the freeze–thaw cycle did not affect specific lymphocyte populations differentially we tested paired samples before and after freezing. We observed no significant difference in any population tested (Supporting information, Fig. S1).
Phenotypical analysis of ILC subsets
The total ILC frequencies were significantly lower in AAV patients with active disease as well as in the disease controls compared to healthy donors (Fig. 1b). The total ILC absolute cell counts were not significantly different between the experimental groups (Fig. 1c). The frequencies of ILC2 cells were decreased in AAV (both AP, P < 0·001 and RP, P < 0·05) compared to HC (Fig. 2b), but again there was no significant difference from disease controls. We observed a weak positive correlation between eGFR and ILC2 (r = 0·29, P < 0·05) and MAIT cell frequency (r = 0·37, P < 0·005). There was no obvious difference between the subtypes of AAV (illustrative graphs in Supporting information, Fig. S2). Of note, ILC2 cell frequencies or absolute numbers were not increased in EGPA. We did not observe any differences in frequencies or absolute cell numbers of the other ILC subsets in the groups studied (Fig. 2a,c–h). Approximately 50% of the AAV cohort had been exposed to cyclophosphamide; this had no clear effect on ILC or MAIT cell frequencies (Supporting information, Fig. S3).
Figure 2.
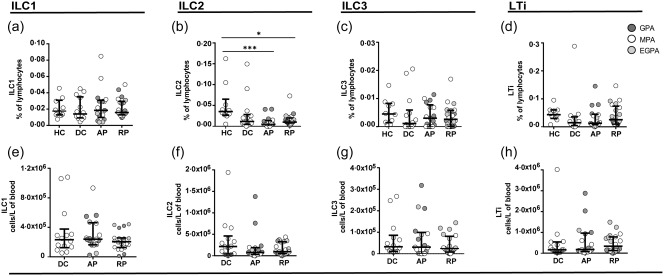
Innate lymphoid cell (ILC) cells are persistently depleted in anti‐neutrophil cytoplasm autoantibody (ANCA)‐associated vasculitis (AAV) patients and disease controls. (a–d) Frequencies of ILC subsets in healthy controls (HC), disease controls (DC) and AAV patients in active (AP) and remission phase (RP). AAV subtypes are denoted by circle colour as granulomatosis with polyangiitis (GPA) (), microscopic polyangiitis (MPA) (○) and eosinophilic granulomatosis with polyangiitis (EGPA) (). (e–h) Absolute cell numbers of ILC subsets in DC and AAV patients in active (AP) and remission phase (RP). Data represent median and interquartile range. One‐way analysis of variance (anova) was carried out using the non‐parametric Kruskal–Wallis test and Dunn's multiple comparison post‐test. ***P < 0·001; **P < 0·01; *P < 0·05.
Phenotypical analysis of innate T cells
The gating strategy used to identify Vδ1, Vδ2 and Vδ3 T cells, iNK T and MAIT cells was similar to that shown in Fig. 1a and representative flow cytometry dot‐plots are shown in Fig. 3a. The frequencies of MAIT cells were significantly lower in AAV (both AP, P < 0·01 and RP, P < 0·05) compared to HC (Fig. 3f). MAIT cells were reduced preferentially in MPA and GPA (Supporting information, Fig. S2c). However, MAIT cell frequencies were also reduced in DC and there was no significant difference between this and the AAV groups. We did not observe any significant difference in other innate T cell populations (Fig. 3b–e,g–k).
Figure 3.
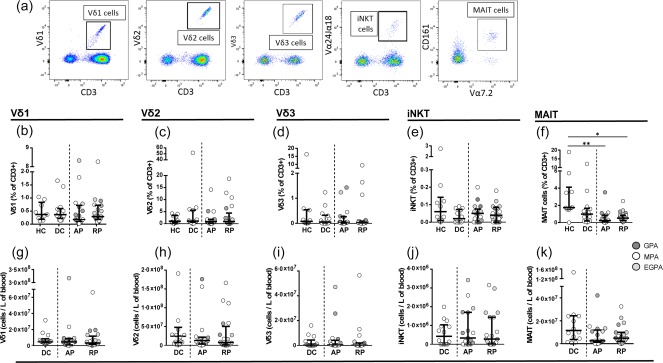
Mucosal‐associated invariant T (MAIT) cells are persistently depleted in anti‐neutrophil cytoplasm autoantibody (ANCA)‐associated vasculitis (AAV) patients and disease controls. (a) Representative flow cytometric dot plots showing Vδ1, Vδ2 and Vδ3 T cells, invariant natural killer T (iNK T) cells and MAIT cells. (b–f) Frequencies of Vδ1, Vδ2, Vδ3 T cells, iNK T cells and MAIT cells in healthy controls (HC), disease controls (DC) and AAV patients in active (AP) and remission phase (RP). AAV subtypes are denoted by circle colour as granulomatosis with polyangiitis (GPA) (), microscopic polyangiitis (MPA) (○) and eosinophilic granulomatosis with polyangiitis (EGPA) (). (g–k) Absolute cell counts of Vδ1, Vδ2, Vδ3 T cells, iNK T cells and MAIT cells in DC and AAV patients in active and remission phase. Data represent median and interquartile range. One‐way analysis of variance (anova) was carried out using the non‐parametric Kruskal–Wallis test and Dunn's multiple comparison post‐test. **P < 0·01; *P < 0·05. [Colour figure can be viewed at wileyonlinelibrary.com]
Phenotypical analysis of conventional lymphocytes and monocytes
The frequencies and absolute numbers of CD4+, CD8+ and DN T cells, NK cells and monocytes were similar in AAV patients with active disease and in remission and in the healthy and disease control groups (Fig. 4 and Supporting information, Fig. S4a). However, both the frequencies and absolute numbers of B cells were significantly lower in patients with AAV in remission compared to AAV patients with active disease (P < 0·01 and P < 0·001) and disease control (P < 0·05 and P < 0·01) or healthy control subjects (P < 0·05) (Fig. 4e,j).
Figure 4.
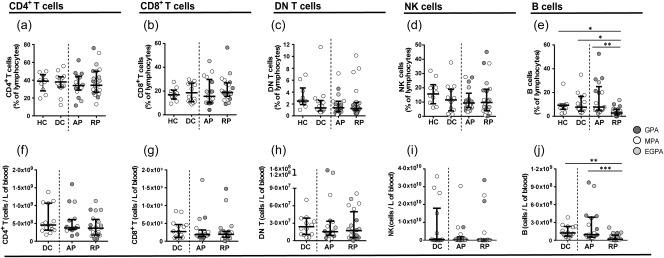
B cell frequencies and numbers are lower in anti‐neutrophil cytoplasm autoantibody (ANCA)‐associated vasculitis (AAV) patients in remission compared to patients with active disease. Phenotypical analysis of conventional lymphocytes. (a–e) Scatter‐plots showing the frequencies of CD4, CD8 T cells and double‐negative (DN) T cells, natural killer (NK) cells and B cells in healthy controls, disease controls and AAV patients in active and remission phase. (f–j) Scatter‐plots showing the absolute numbers of CD4, CD8 T cells and DN T cells, NK cells and B cells in disease controls (DC) and AAV patients in active (AP) and remission phase (RP). AAV subtypes are denoted by circle colour as granulomatosis with polyangiitis (GPA) (), microscopic polyangiitis (MPA) (○) and eosinophilic granulomatosis with polyangiitis (EGPA) (). Data represent median and interquartile range. One‐way analysis of variance (anova) was carried out using the non‐parametric Kruskal–Wallis test and Dunn's multiple comparison post‐test. ***P < 0·.001; **P < 0·01; *P < 0·05. [Colour figure can be viewed at wileyonlinelibrary.com]
Validation of flow cytometry analysis using two software programs
The frequencies of ILC populations are extremely low in blood 6, making it important to distinguish them accurately from background fluorescence using flow cytometry. To provide additional validation of the cell number quantification, data were analysed in parallel by independent investigators using two different flow cytometer software programs. The numbers obtained were correlated highly in all cases (Supporting information, Fig. S5).
Discussion
In the present study, we determined the frequencies and absolute cell counts of circulating total ILCs, ILC1, ILC2, ILC3 and LTi cells, the Vδ1, Vδ2, Vδ3 subsets of γδ T cells, iNK T cells and MAIT cells as well as CD4+, CD8+, CD4–CD8‐ T cells, B cells, NK cells and monocytes by flow cytometry. Braudeau et al. 7 reported recently that circulating MAIT cell frequencies were significantly lower in patients with GPA and MPA compared to healthy donors, both in AP and RP, whereas γδ T cells and iNK T cells were found at normal levels. The authors also found that ILC1 cells were expanded and ILC2 and ILC3 cells were depleted in GPA and MPA patients in AP. In agreement with this study, we show that AAV is associated with decreased frequencies of circulating ILC2 and MAIT cells compared to healthy subjects, particularly in active disease. However, similar findings were observed in disease control subjects with similar degrees of renal impairment. This suggests that the decreased frequencies of MAIT cells and ILC2s are not specific for AAV and that the alterations in these lymphoid populations in AAV patients are more likely to be due to non‐specific manifestations of impaired kidney function. Our data emphasize the importance of including a disease control group in the study design, to properly interpret the specificity to AAV, which is often associated with severe end‐organ injury that may have non‐specific effects on the immune system.
The pathogenesis of AAV involves the interplay of many cell types of the immune system, including neutrophils, monocytes and B cells, all of which contribute to T cell differentiation and activation and controlled by cytokines released by T cells 2, 3, 4, 21, 22, 23. CD4+ T cells produce Th1 and Th17 cytokines, such as interferon (IFN)‐γ and interleukin (IL)‐17, respectively, are expanded in the circulation of patients with GPA and MPA 24, 25, whereas Th2 cells, producing IL‐4, IL‐5 and IL‐13, are more frequent in patients with EGPA 24, 26, 27, 28, 29. Recent studies have also shown that regulatory T cells (Tregs) 25, 30, 31 and regulatory B cells (Bregs) 32, which produce IL‐10 and inhibit Th1, Th2 and Th17 cell differentiation, are depleted in AAV patients with active disease but normalized during remission. The balance of Th cells subsets is controlled in part by lymphocytes of the innate immune system, such as ILCs, γδ T cells, MAIT cells and iNK T cells, which undergo rapid activation in response to conserved non‐peptide antigens, cytokines and stress‐inducible proteins expressed on other cells 6, 8, 9, 11, 12, 13, 14, 15, 16, 17, 33. A key function of these cells is their ability to promptly release Th1, Th2, Th17 and/or Treg cytokines, providing early triggers for the polarisation of adaptive immune responses.
Innate T cells subsets, such as iNK T cells and Vδ2 T cells, can provide direct help to B cells for the production of antibody 34, 35, 36 and can activate neutrophils, through direct cell–cell contact or indirectly via the production of IL‐17 37, 38, making them likely candidates as cells involved in the pathogenesis of AAV. However, our results also confirm those of Braudeau and co‐workers 7 in showing that the numbers and frequencies of these cells are not perturbed in patients with AAV, whether in AP or RP. Furthermore, our data do not support roles for the individual Vδ1, Vδ2 and Vδ3 subsets of γδ T cells in the pathogenesis of AAV. Although a slight depletion of NK cells has been reported in patients with MPA in AP 7, this was not confirmed in our study.
We also performed the phenotypical analysis of conventional lymphocytes and monocytes and found similar frequencies and absolute numbers of CD4+, CD8+ and DN T cells, NK cells and monocytes in AAV patients with active disease and in remission and in both healthy and disease controls. However, we found that both the frequencies and absolute numbers of B cells were significantly lower in patients with AAV in remission compared to AAV patients with active disease or disease control subjects. This finding is almost certainly related to prior exposure to B cell depleting agents such as rituximab and cyclophosphamide, and emphasizes the importance of accounting for the long‐term effects of immunotherapeutic agents in cross‐sectional studies of autoimmune disease. Similarly, the frequencies of MAIT cells in peripheral blood may correlate inversely with the dose of corticosteroid received 33.
Previous studies have shown a strong Th2 preponderance of EGPA 24, 26, 27, 28, 29, with elevated levels of cytokines such as IL‐4, IL‐5 and IL‐13, and activated Th2 cells in the circulation of EGPA patients. ILC2s, Vδ2 and iNK T cells are notable producers of these cytokines 6, 8, 9, 14, 16, 17, 36, leading us to hypothesize that ILC2s are key drivers of this eosinophilic vasculitic syndrome. However, we did not observe expansions of any of these Th2‐promoting innate lymphocyte populations in patients with EGPA. In contrast, we found that the frequencies of ILC2s were, if anything, lower in patients with EGPA compared to healthy control subjects.
Conclusion
In this study we provide an extended characterization of circulating lymphoid cell populations in AAV patients. We show that the previously reported reduction in ILC2 and MAIT cells is not specific to AAV and probably represents a non‐specific response to renal involvement and chronic illness, highlighting the importance of including disease control groups in phenotyping studies. We observe no expansions of Th2‐promoting lymphocyte subsets, such as ILC2, iNK T or Vδ2 T cells, in patients with EGPA.
Disclosure
The authors declare that there are no financial or commercial conflicts of interest associated with the publication of this work.
Supporting information
Additional Supporting information may be found in the online version of this article at the publisher's web‐site:
Table S1. Antibodies used in fluorescence activated cell sorter (FACS) staining
Table S2. Phenotypical characteristics of cells identified
Fig. S1. Percentages of T cells, B cells and monocytes in peripheral blood mononuclear cells (PBMC) of healthy subjects after freezing. Scatter‐plots showing the frequencies of cells in fresh and frozen PBMC of healthy controls. Data represent median and interquartile range. One‐way analysis of variance (anova) was carried out using the non‐parametric Wilcoxon matched‐pairs signed‐rank test. *P < 0·05.
Fig. S2. Frequencies and absolute numbers of innate lymphoid cell 2 (ILC2) and mucosal‐associated invariant T (MAIT) cells broken down by disease in anti‐neutrophil cytoplasm autoantibody (ANCA)‐associated vasculitis (AAV) patients. Scatter‐plots showing the frequencies (a,c) and the number (b, d) of cells in healthy controls (HC), disease controls (DC) and granulomatosis with polyangiitis (GPA), microscopic polyangiitis (MPA) and eosinophilic granulomatosis with polyangiitis (EGPA) AAV patients. Data represent median and interquartile range. Disease states are denoted by active phase () and remission phase (○).
Fig. S3. Percentages of innate lymphoid cell (ILC), ILC subpopulations and mucosal‐associated invariant T (MAIT) cells in anti‐neutrophil cytoplasm autoantibody (ANCA)‐associated vasculitis (AAV) populations exposed versus not exposed to cyclophosphamide. Scatter plots showing the frequencies of cells in AAV patients. Data represent median and interquartile range. Treatment states are denoted by prior CYC () and no prior cyclophosphamide (CYC) (○).
Fig. S4. Phenotypical analysis of monocytes in patients and control groups. Scatter‐plots showing the frequencies of monocytes in healthy controls, disease controls and anti‐neutrophil cytoplasm autoantibody (ANCA)‐associated vasculitis (AAV) patients in active and remission phase. AAV subtypes are denoted by circle colour as granulomatosis with polyangiitis (GPA) (), microscopic polyangiitis (MPA) (○) and eosinophilic granulomatosis with polyangiitis (EGPA) (). Data represent median and interquartile range. One‐way analysis of variance (anova) was carried out using the non‐parametric Kruskal–Wallis test and Dunn's multiple comparison post‐test. *P < 0·05.
Fig. S5. Correlation between frequencies of innate lymphoid cells, innate T cells and conventional lymphocyte and monocyte subsets analysed by Kaluza and FlowJo flow cytometry analysis software programs. (a‐p) Correlation analysis was carried out by using linear regression. The correlation has been calculated by the non‐parametric Spearman's test.
Acknowledgements
D. G. D. and M. L. designed the study. Y. K., P. O.'H., S. M., A. K. and N. C. enrolled the patients. E. O.'B. processed PBMC samples. A. M. O. and B. F. performed the experiments and analysed the results statistically. S. M. and J. S. performed clinical analysis. F. H. performed the freeze–thaw analysis and processed PBMC samples. A. M. M. contributed to the flow cytometric analysis. D. D. prepared the figures. B. F. prepared the draft of the manuscript. This work was supported by the Rare Kidney Disease Registry and Biobank; the Meath Foundation grant (203170) and the Science Foundation Ireland grant (11/Y/B2093).
Barbara Fazekas and Ana Moreno‐Olivera contributed equally to this study.
References
- 1. Cornec D, Cornec‐Le Gall E, Specks U. Clinical trials in antineutrophil cytoplasmic antibody‐associated vasculitis: what we have learnt so far, and what we still have to learn. Nephrol Dial Transplant 2017; 32:i37–47. [DOI] [PubMed] [Google Scholar]
- 2. Jennette JC, Falk RJ, Bacon PA et al 2012 revised International Chapel Hill Consensus Conference nomenclature of vasculitides. Arthritis Rheum 2013; 65:1–11. [DOI] [PubMed] [Google Scholar]
- 3. Yates M, Watts R. ANCA‐associated vasculitis. Clin Med (Lond) 2017; 17:60–4. [DOI] [PMC free article] [PubMed] [Google Scholar]
- 4. Cornec D, Cornec‐Le Gall E, Fervenza FC, Specks U. ANCA‐associated vasculitis – clinical utility of using ANCA specificity to classify patients. Nat Rev Rheumatol 2016; 12:570–9. [DOI] [PubMed] [Google Scholar]
- 5. Xiao H, Hu P, Falk RJ, Jennette JC. Overview of the pathogenesis of ANCA‐associated vasculitis. Kidney Dis (Basel) 2016; 1:205–15. [DOI] [PMC free article] [PubMed] [Google Scholar]
- 6. Klose CS, Artis D. Innate lymphoid cells as regulators of immunity, inflammation and tissue homeostasis. Nat Immunol 2016; 17:765–74. [DOI] [PubMed] [Google Scholar]
- 7. Braudeau C, Amouriaux K, Neel A et al Persistent deficiency of circulating mucosal‐associated invariant T (MAIT) cells in ANCA‐associated vasculitis. J Autoimmun 2016; 70:73–9. [DOI] [PubMed] [Google Scholar]
- 8. Bendelac A, Savage PB, Teyton L. The biology of NKT cells. Annu Rev Immunol 2007; 25:297–336. [DOI] [PubMed] [Google Scholar]
- 9. Salio M, Silk JD, Jones EY, Cerundolo V. Biology of CD1‐ and MR1‐restricted T cells. Annu Rev Immunol 2014; 32:323–66. [DOI] [PubMed] [Google Scholar]
- 10. Vantourout P, Hayday A. Six‐of‐the‐best: unique contributions of gammadelta T cells to immunology. Nat Rev Immunol 2013; 13:88–100. [DOI] [PMC free article] [PubMed] [Google Scholar]
- 11. Tyler CJ, Doherty DG, Moser B, Eberl M. Human Vgamma9/Vdelta2 T cells: innate adaptors of the immune system. Cell Immunol 2015; 296:10–21. [DOI] [PubMed] [Google Scholar]
- 12. Le Bourhis L, Mburu YK, Lantz O. MAIT cells, surveyors of a new class of antigen: development and functions. Curr Opin Immunol 2013; 25:174–80. [DOI] [PubMed] [Google Scholar]
- 13. Ussher JE, Klenerman P, Willberg CB. Mucosal‐associated invariant T‐cells: new players in anti‐bacterial immunity. Front Immunol 2014; 5:450. [DOI] [PMC free article] [PubMed] [Google Scholar]
- 14. Spits H, Artis D, Colonna M et al Innate lymphoid cells – a proposal for uniform nomenclature. Nat Rev Immunol 2013; 13:145–9. [DOI] [PubMed] [Google Scholar]
- 15. Doherty DG. Immunity, tolerance and autoimmunity in the liver: a comprehensive review. J Autoimmun 2016; 66:60–75. [DOI] [PubMed] [Google Scholar]
- 16. Artis D, Spits H. The biology of innate lymphoid cells. Nature 2015; 517:293–301. [DOI] [PubMed] [Google Scholar]
- 17. Eberl G, Colonna M, Di Santo JP, McKenzie AN. Innate lymphoid cells. Innate lymphoid cells: a new paradigm in immunology. Science 2015; 348:aaa6566. [DOI] [PMC free article] [PubMed] [Google Scholar]
- 18. Shikhagaie MM, Germar K, Bal SM, Ros XR, Spits H. Innate lymphoid cells in autoimmunity: emerging regulators in rheumatic diseases. Nat Rev Rheumatol 2017; 13:164–73. [DOI] [PubMed] [Google Scholar]
- 19. Betjes MG. Immune cell dysfunction and inflammation in end‐stage renal disease. Nat Rev Nephrol 2013; 9:255–65. [DOI] [PubMed] [Google Scholar]
- 20. Arduini S, Dunne J, Conlon N, Feighery C, Doherty DG. Mucosal‐associated invariant T cells are depleted and functionally altered in patients with common variable immunodeficiency. Clin Immunol 2017; 176:23–30. [DOI] [PubMed] [Google Scholar]
- 21. Sable‐Fourtassou R, Cohen P, Mahr A et al Antineutrophil cytoplasmic antibodies and the Churg–Strauss syndrome. Ann Intern Med 2005; 143:632–8. [DOI] [PubMed] [Google Scholar]
- 22. Sinico RA, Di Toma L, Maggiore U et al Prevalence and clinical significance of antineutrophil cytoplasmic antibodies in Churg–Strauss syndrome. Arthritis Rheum 2005; 52:2926–35. [DOI] [PubMed] [Google Scholar]
- 23. Jennette JC, Falk RJ. Pathogenesis of antineutrophil cytoplasmic autoantibody‐mediated disease. Nat Rev Rheumatol 2014; 10:463–73. [DOI] [PubMed] [Google Scholar]
- 24. Kerstein A, Muller A, Kabelitz D, Lamprecht P. Effector memory T cells in the pathogenesis of ANCA‐associated vasculitides. Z Rheumatol 2016; 75:183–6. [DOI] [PubMed] [Google Scholar]
- 25. Szczeklik W, Jakiela B, Wawrzycka‐Adamczyk K et al Skewing toward Treg and Th2 responses is a characteristic feature of sustained remission in ANCA‐positive granulomatosis with polyangiitis. Eur J Immunol 2017; 47:724–33. [DOI] [PubMed] [Google Scholar]
- 26. Kiene M, Csernok E, Muller A, Metzler C, Trabandt A, Gross WL. Elevated interleukin‐4 and interleukin‐13 production by T cell lines from patients with Churg–Strauss syndrome. Arthritis Rheum 2001; 44:469–73. [DOI] [PubMed] [Google Scholar]
- 27. Jakiela B, Szczeklik W, Plutecka H et al Increased production of IL‐5 and dominant Th2‐type response in airways of Churg–Strauss syndrome patients. Rheumatology (Oxford) 2012; 51:1887–93. [DOI] [PubMed] [Google Scholar]
- 28. Khoury P, Grayson PC, Klion AD. Eosinophils in vasculitis: characteristics and roles in pathogenesis. Nat Rev Rheumatol 2014; 10:474–83. [DOI] [PMC free article] [PubMed] [Google Scholar]
- 29. Jakiela B, Sanak M, Szczeklik W et al Both Th2 and Th17 responses are involved in the pathogenesis of Churg–Strauss syndrome. Clin Exp Rheumatol 2011; 29:S23–34. [PubMed] [Google Scholar]
- 30. Rimbert M, Hamidou M, Braudeau C et al Decreased numbers of blood dendritic cells and defective function of regulatory T cells in antineutrophil cytoplasmic antibody‐associated vasculitis. PLOS ONE 2011; 6:e18734. [DOI] [PMC free article] [PubMed] [Google Scholar]
- 31. Free ME, Bunch DO, McGregor JA et al Patients with antineutrophil cytoplasmic antibody‐associated vasculitis have defective Treg cell function exacerbated by the presence of a suppression‐resistant effector cell population. Arthritis Rheum 2013; 65:1922–33. [DOI] [PMC free article] [PubMed] [Google Scholar]
- 32. Aybar LT, McGregor JG, Hogan SL et al Reduced CD5(+) CD24(hi) CD38(hi) and interleukin‐10(+) regulatory B cells in active anti‐neutrophil cytoplasmic autoantibody‐associated vasculitis permit increased circulating autoantibodies. Clin Exp Immunol 2015; 180:178–88. [DOI] [PMC free article] [PubMed] [Google Scholar]
- 33. Hinks TS. Mucosal‐associated invariant T cells in autoimmunity, immune‐mediated diseases and airways disease. Immunology 2016; 148:1–12. [DOI] [PMC free article] [PubMed] [Google Scholar]
- 34. Galli G, Nuti S, Tavarini S et al CD1d‐restricted help to B cells by human invariant natural killer T lymphocytes. J Exp Med 2003; 197:1051–7. [DOI] [PMC free article] [PubMed] [Google Scholar]
- 35. Zeng SG, Ghnewa YG, O'Reilly VP et al Human invariant NKT cell subsets differentially promote differentiation, antibody production, and T cell stimulation by B cells in vitro . J Immunol 2013; 191:1666–76. [DOI] [PMC free article] [PubMed] [Google Scholar]
- 36. Petrasca A, Doherty DG. Human Vdelta2(+) gammadelta T cells differentially induce maturation, cytokine production, and alloreactive T cell stimulation by dendritic cells and B cells. Front Immunol 2014; 5:650. [DOI] [PMC free article] [PubMed] [Google Scholar]
- 37. Davey MS, Morgan MP, Liuzzi AR et al Microbe‐specific unconventional T cells induce human neutrophil differentiation into antigen cross‐presenting cells. J Immunol 2014; 193:3704–16. [DOI] [PMC free article] [PubMed] [Google Scholar]
- 38. Huang E, Liu R, Lu Z et al NKT cells mediate the recruitment of neutrophils by stimulating epithelial chemokine secretion during colitis. Biochem Biophys Res Commun 2016; 474:252–8. [DOI] [PubMed] [Google Scholar]
Associated Data
This section collects any data citations, data availability statements, or supplementary materials included in this article.
Supplementary Materials
Additional Supporting information may be found in the online version of this article at the publisher's web‐site:
Table S1. Antibodies used in fluorescence activated cell sorter (FACS) staining
Table S2. Phenotypical characteristics of cells identified
Fig. S1. Percentages of T cells, B cells and monocytes in peripheral blood mononuclear cells (PBMC) of healthy subjects after freezing. Scatter‐plots showing the frequencies of cells in fresh and frozen PBMC of healthy controls. Data represent median and interquartile range. One‐way analysis of variance (anova) was carried out using the non‐parametric Wilcoxon matched‐pairs signed‐rank test. *P < 0·05.
Fig. S2. Frequencies and absolute numbers of innate lymphoid cell 2 (ILC2) and mucosal‐associated invariant T (MAIT) cells broken down by disease in anti‐neutrophil cytoplasm autoantibody (ANCA)‐associated vasculitis (AAV) patients. Scatter‐plots showing the frequencies (a,c) and the number (b, d) of cells in healthy controls (HC), disease controls (DC) and granulomatosis with polyangiitis (GPA), microscopic polyangiitis (MPA) and eosinophilic granulomatosis with polyangiitis (EGPA) AAV patients. Data represent median and interquartile range. Disease states are denoted by active phase () and remission phase (○).
Fig. S3. Percentages of innate lymphoid cell (ILC), ILC subpopulations and mucosal‐associated invariant T (MAIT) cells in anti‐neutrophil cytoplasm autoantibody (ANCA)‐associated vasculitis (AAV) populations exposed versus not exposed to cyclophosphamide. Scatter plots showing the frequencies of cells in AAV patients. Data represent median and interquartile range. Treatment states are denoted by prior CYC () and no prior cyclophosphamide (CYC) (○).
Fig. S4. Phenotypical analysis of monocytes in patients and control groups. Scatter‐plots showing the frequencies of monocytes in healthy controls, disease controls and anti‐neutrophil cytoplasm autoantibody (ANCA)‐associated vasculitis (AAV) patients in active and remission phase. AAV subtypes are denoted by circle colour as granulomatosis with polyangiitis (GPA) (), microscopic polyangiitis (MPA) (○) and eosinophilic granulomatosis with polyangiitis (EGPA) (). Data represent median and interquartile range. One‐way analysis of variance (anova) was carried out using the non‐parametric Kruskal–Wallis test and Dunn's multiple comparison post‐test. *P < 0·05.
Fig. S5. Correlation between frequencies of innate lymphoid cells, innate T cells and conventional lymphocyte and monocyte subsets analysed by Kaluza and FlowJo flow cytometry analysis software programs. (a‐p) Correlation analysis was carried out by using linear regression. The correlation has been calculated by the non‐parametric Spearman's test.