

Abstract
Background and Purpose
We hypothesized that an in vitro, stretch‐based model of neural injury may be useful to identify compounds that decrease the cellular damage in neurotrauma.
Experimental Approach
We screened three neural cell lines (B35, RN33B and SH‐SY5Y) subjected to two differentiation methods and selected all‐trans‐retinoic acid‐differentiated B35 rat neuroblastoma cells subjected to rapid stretch injury, coupled with a subthreshold concentration of H2O2, for the screen. The model induced marked alterations in gene expression and proteomic signature of the cells and culminated in delayed cell death (LDH release) and mitochondrial dysfunction [reduced 3‐(4,5‐dimethyl‐2‐thiazolyl)‐2,5‐diphenyl‐2H‐tetrazolium bromide (MTT) conversion]. Follow‐up studies utilized human stem cell‐derived neurons subjected to rapid stretch injury.
Key Results
From screening of a composite library of 3500 drugs, five drugs (when applied in a post‐treatment regimen relative to stretch injury) improved both LDH and MTT responses. The effects of rifampicin were investigated in further detail. Rifampicin reduced cell necrosis and apoptosis and improved cellular bioenergetics. In a second model (stretch injury in human stem cell‐derived neurons), rifampicin pretreatment attenuated LDH release, protected against the loss of neurite length and maintained neuron‐specific class III β‐tubulin immunoreactivity.
Conclusions and Implications
We conclude that the current model is suitable for medium‐throughput screening to identify compounds with neuroprotective potential. Rifampicin, when applied either in pre‐ or post‐treatment, improves the viability of neurons subjected to stretch injury and protects against neurite loss. Rifampicin may be a candidate for repurposing for the therapy of traumatic brain injury.
Linked Articles
This article is part of a themed section on Inventing New Therapies Without Reinventing the Wheel: The Power of Drug Repurposing. To view the other articles in this section visit http://onlinelibrary.wiley.com/doi/10.1111/bph.v175.2/issuetoc
Abbreviations
- ATRA
all‐trans retinoic acid
- MTT
3‐(4,5‐dimethyl‐2‐thiazolyl)‐2,5‐diphenyl‐2H‐tetrazolium bromide
- OCR
oxygen consumption rate
- RSI
rapid stretch injury
- TBI
traumatic brain injury
Table of Links
| LIGANDS |
|---|
| Rifampicin |
This Table lists key ligands in this article that are hyperlinked to corresponding entries in http://www.guidetopharmacology.org, the common portal for data from the IUPHAR/BPS Guide to PHARMACOLOGY (Southan et al., 2016).
Introduction
Traumatic brain injury (TBI) is a serious public health problem with 2.5 million cases anually, causing permanent disability and death (Peeters et al., 2015; Dewan et al., 2016; Laskowitz and Grant, 2016). After the initial mechanical insult that causes the primary injury, secondary injury develops, which involves a range of cellular processes including oxidative stress. Secondary injury includes vascular/haemodynamic processes (including ischaemia, cerebral hypoxia, hypotension, cerebral oedema and vascular dysfunction including loss of the blood‐brain barrier and elevated intracranial pressure) as well as a variety of other processes including excitatory neurotransmitter release and associated neurotoxicity. Even more delayed processes include various forms of neurodegeneration. These delayed processes are responsible for a significant part for the TBI‐induced neural damage (DeWitt et al., 1995; Bramlett and Dietrich, 2007; DeWitt and Prough, 2009; Abdul‐Muneer et al., 2015; Kochanek et al., 2015; Laskowitz and Grant, 2016; Pearn et al., 2016).
The first goal of the current study was to develop an in vitro, stretch‐based model of neural injury that could be applied to cell‐based screening to search for drugs or lead compounds that may decrease the cellular damage in neurotrauma and/or improve recovery. During model development, we evaluated three cell lines that were previously used in neural injury models: the B35 cells were used in ROS‐mediated (Chong et al., 2012) and oxygen glucose deprivation/re‐oxygenation injury models (Croslan et al., 2008); the RN33B cells were used in T‐cell mediated cell lysis (White et al., 1994) and a succinate dehydrogenase inhibitor (3‐nitropropionic acid)‐induced injury model (Rodrigues et al., 2000); and the SH‐SY5Y cells were used in a stretch‐injury model (Skotak et al., 2012). After selecting B35 cells for medium‐throughput screening, and after identifying the conditions for cell injury that involved a combination of rapid stretch injury (RSI) and oxidative stress, we have conducted a medium‐throughput screen. The screen has identified several neuroprotective molecules; we have characterized the mode of cytoprotective action for one selected drug (rifampicin), in further detail.
Methods
Cell culture
B35 rat neuroblastoma cells, RN33B rat medullary neural cells and SH‐SY5Y human neuroblastoma cells were obtained from the American Type Culture Collection (ATCC, Manassas, VA). B35 cells were derived from N‐nitrosoethylurea‐induced CNS tumours, and retain GABAergic and cholinergic characteristics: they show glutamic acid decarboxylase and choline acetyltransferase activities and express GABA (Tyndale et al., 1994). B35 cells were maintained in DMEM (Invitrogen, Carlsbad, CA) containing 4.5 g·L−1 glucose supplemented with 10% FBS (Hyclone, Logan, UT), 2 mM glutamine, 100 IU·mL−1 penicillin and 100 μg·mL−1 streptomycin (Invitrogen, Carlsbad, CA) at 37°C in 5% CO2 atmosphere. The RN33B cell line was derived from cells of medullary raphe nuclei by infection with a retrovirus encoding the temperature‐sensitive mutant of SV40 large T antigen (Whittemore and White, 1993). The cells were maintained in 1:1 mixture of DMEM and Ham's Nutrient mixture F12 (F12, Invitrogen, Carlsbad, CA) supplemented with 2.5 mM glutamine, 15 mM HEPES, 0.5 mM sodium pyruvate, 10% FBS, 100 IU·mL−1 penicillin and 100 μg·mL−1 streptomycin at 33°C in 5% CO2 atmosphere. The cells divide at the permissive temperature (33°C) and express vimentin, nestin, diffuse neuron‐specific enolase and neurofilaments. At the non‐permissive temperature (37 to 39°C) SV40 T antigen expression is decreased, the cells cease mitotic activity and differentiate to neuronal cells. Differentiated RN33B cells if returned to 33°C do not de‐differentiate or begin dividing, although they re‐express the T antigen. SH‐SY5Y human neuroblastoma cells (Skotak et al., 2012) originate from a metastatic bone tumour and were maintained in 1:1 mixture of Eagle's Minimum Essential Medium (MEM, Invitrogen, Carlsbad, CA) and F12 medium supplemented with 10% FBS, 1 mM pyruvate, 100 IU·mL−1 penicillin and 100 μg·mL−1 streptomycin at 37°C in 5% CO2 atmosphere. All three cell lines were maintained in collagen‐coated tissue culture vessels (BioCoat™ Collagen I culture flasks, Becton Dickinson BioSciences/Falcon, Bedford, MA).
Prior to stretch injury, cells were plated to 24‐well high throughput Bioflex culture plates (Flexcell International Corporation, Hillsborough, NC) pre‐coated with collagen type I, 0.01% poly‐D‐Lysine (PDL, Sigma‐Aldrich, Saint Louis, MO) and 1 μg·mL−1 mouse laminin (Invitrogen, Carlsbad, CA) (Wang et al., 2012) and grown until they reached 80% confluency. The three cell lines obtained for design and optimization of the model were subjected to two differentiation protocols each: B35 and SHY5Y cells were exposed to either 10 μM all‐trans retinoic acid (ATRA) or butyrate for chemical induction, whereas the temperature‐sensitive RN33B cells were exposed to either DMEM/F12 or B16 media at an elevated temperature (39°C). The degree of differentiation was assessed through observation of morphological attributes as well as quantification of differentiation markers at the mRNA and protein levels.
RNA isolation and gene expression arrays
NTotal RNA was isolated from differentiated cells and non‐differentiated controls (n = 4 per group) using a commercial RNA purification kit (SV total RNA isolation kit, Promega, Madison, WI). Approximately 0.5 μg RNA was reverse transcribed using the High Capacity cDNA Archive kit (Applied Biosystems, Foster City, CA) as described (Gero et al., 2013); 0.5 μg RNA was used according to the manufacturer's protocol for gene expression measurements using the rat and human neurogenesis real‐time PCR arrays (PARN‐404ZD and PAHS‐404ZD, SA Biosciences, Frederick, MD) on CFX96 thermocycler (Biorad, Hercules, CA) and analysed with the tool provided by SA Biosciences. Expression values relative to the non‐differentiated control cells were calculated.
Proteomic analysis
B35 cells that were either undifferentiated, differentiated to 5 days under the ATRA and serum deprivation protocol with either no injury or undergone the in vitro stretch injury were collected and submitted for MS analysis of proteomic profiles. The procedures used for proteomics analysis of protein analysis were adapted from our laboratory and other previously published protocols (Olsen et al., 2004; Wang et al., 2010; Nicholas et al., 2015). Cell pellets were lysed in RIPA lysis buffer (Santa Cruz Biotechnology, CA) supplemented with 1% Nonidet P40, PMSF (0.2 mM), and protease inhibitor cocktail (Roche, one tablet 10 mL−1). The protein mixture was centrifuged and the supernatant transferred into a clean tube. The protein concentration in the supernatant was determined by bicinchoninic acid assay (Smith et al., 1985). Approximately 60 μg of each protein sample was resuspended in 25 mM triethylammonium bicarbonate buffer, pH 7.8. The protein solution was reduced by the addition of 10 mM TCEP [tris(2‐carboxyethyl)phosphine] and incubation at 50°C for 30 min, followed by carboxymethylation with 25 mM iodoacetamide in the dark for 1 h. The proteins were precipitated by the addition of 4 volumes of −20°C precooled acetone and stored at −20°C overnight. The protein was pelleted by centrifugation at 15 000 × g for 10 min, and the supernatant was discarded. The protein was washed by 0.5 mL −20°C precooled acetone and dried in chemical hood overnight after removal of acetone. The protein pellet was dissolved in 25 mM triethylammonium bicarbonate buffer and digested with trypsin at a protein/trypsin enzyme ratio of 25:1 (by mass) for 10 h at 37°C. The TMT (Tandem Mass Tag) isobaric Mass Tagging Kit (Thermo‐Fisher Scientific) was used to label the peptides by following the manufacturer's recommendations. After de‐saltation with a spin‐column with Hypercarb packing material (Thermo‐Fisher Scientific), the eluted peptides with 60% acetonitrile were SpeedVac dried, re‐dissolved in 1% formic acid, and then subjected to LC–MS/MS analysis. Quantitation was carried out on the Thermo QExactive mass spectrometer. Peptides were separated by online reverse phase liquid chromatography (RPLC) using home‐packed C18 capillary columns (15 cm long, 75 μm i.d., 3‐μm particle size) with a 250‐min gradient (solvent A, 0.1% FA in water; solvent B, 0.1% FA in ACN) from 5–30% solvent B. Approximately 2 μg of peptide sample was injected. An Orbitrap mass analyser was used to acquire data at 35 000 resolution (FWHM) for the parent full‐scan mass spectrum followed by data‐dependent high collision‐energy dissociation (HCD) MS/MS spectra for the top 15 most abundant ions acquired at 7500 resolution. Six injections were performed. Data were processed and searched using the Thermo Scientific Proteome Discoverer software suite 1.4 with MASCOT/Sequest combined search engines and the Rattus norvegicus data bases (Swiss_Prot 2014.10 for Sequest and NCBinr for MASCOT). Approximately 10 ppm precursor ion mass tolerance and 0.1 Da fragment ion tolerance was applied for searching peptides. Peptides were filtered based on a false discovery rate cut‐off of 1% (strict) and 5% (relaxed). Cysteine S‐carbamidomethylation as fixed modification, methionine oxidation as variable modification, and up to two missing cleavages were considered during searching.
Viability assays: MTT assay, LDH release assay and ATP assay
The 3‐(4,5‐dimethyl‐2‐thiazolyl)‐2,5‐diphenyl‐2H‐tetrazolium bromide (MTT) assay and LDH activity measurements were performed as previously described (Gero et al., 2013). Briefly, the cells were incubated in medium containing 0.5 mg·mL−1 MTT (Calbiochem, EMD BioSciences, San Diego, CA) for 1 h at 37°C at 5% CO2 atmosphere. The converted formazan dye was dissolved in isopropanol, and the absorbance was measured at 570 nm. Serial dilution of the cells was used to calculate the count of viable cells. Viability values are shown as percent values relative to non‐stretched, vehicle treated controls.
LDH release was measured by mixing cell culture supernatant (30 μL) with 100 μL LDH assay reagent containing 110 mM lactic acid, 1350 mM NAD+, 290 mM N‐methylphenazonium methyl sulphate, 685 mM 2‐(4‐iodophenyl)‐3‐(4‐nitrophenyl)‐5‐phenyl‐2H‐tetrazolium chloride and 200 mM Tris (pH 8.2). The changes in absorbance were read kinetically at 492 nm for 15 min (kinetic LDH assay). LDH activity values are shown as maximal velocity (mOD/min). ATP concentration was determined by the commercially available CellTiter‐Glo® Luminescent Cell Viability Assay (Promega, Madison, WI) (Gero and Szabo, 2015). The cells were lysed in 300 μL of CellTiter‐Glo reagent according to the manufacturer's recommendations and the luminescent signal was recorded for 1 s on a high sensitivity luminometer (Synergy 2, Biotek, Winooski, VT, USA), and data were expressed as relative luminescence units. The assay is based on ATP requiring luciferin‐oxyluciferin conversion mediated by a thermostable luciferase that generates a stable ‘glow‐type’ luminescent signal.
Cell culture and preparation for stretch experiments
Rat hippocampal neuroblastoma cell line (B35) was maintained in growth medium (DMEM F0415, Biochrom GmbH, Berlin, Germany) containing 15% FBS (SH30910.03, HyClone), 4.5 g·L−1 glucose, 4 mM glutamine, and the combination of 100 U·mL−1 penicillin and 100 μg·mL−1 streptomycin. Cells were cultured on 24‐well medium‐throughput plates with silicone‐based deformable membrane surfaces (1.56 cm2 per well) coated with Collagen I (HTP‐3001C, Flexcell International, Hillsborough, NC) at a cell density of 32 000 cells cm−2 (equivalent to 50 000 cells per well). Cells were kept in growth media to adhere overnight (37°C, 5% CO2), and the following day were induced by combination of serum deprivation and chemical induction afforded by a change in media containing 1% (w/v) bovine serum albumin and 10 μM ATRA instead of 15% FBS. Cell culture medium was changed on Day 3 to a modified differentiation medium that replaced 1% bovine serum albumin with 1% FBS in order to minimize cell loss during differentiation while maintaining conditions of relative serum starvation. On the fifth day of differentiation, cells were subjected to in vitro injury.
In vitro TBI screening for neuroprotective compounds
Our final in vitro TBI model consists of a two‐factor sequence of RSI and a bolus of an oxidative stressor. To induce RSI, we used the FX‐500T™ Tension System (Flexcell International Corporation) comprising a pressure pump, reservoir, Flexlink®, and baseplate connected to a computer where RSI protocols were designed and monitored. Cell culture plates were mounted onto rubber gaskets and fit onto Flexcell® vacuum baseplate with 10 mm diameter Loading Stations® that had been previously coated with silicone lubricant in order to facilitate the base membrane sliding over the loading station posts. Cells were stretched at a frequency of 30 cycles, minimum vacuum pressure − 80 kPa, over 45 s (0.67 Hz) at room temperature. After RSI, cells were returned into the 37°C cell culture incubators. After 30 min of RSI, a bolus of hydrogen peroxide (H2O2) (EMD Millipore, Billerica, MA) was added to the cells so that the final concentration was 50 μM. Cells were returned to the 37°C cell culture incubators until subsequent drug treatment. Drug (or vehicle) treatments were commenced 1 h after the onset of injury. Cells were incubated with test drugs (3 μM final concentration) for 24 h, after which cell viability and cell death were assayed.
Extracellular flux analysis
Cells (treated either with vehicle or rifampicin) were subjected to TBI for 24 h. After 24 h, cells were collected by trypsinization (0.05% trypsin, 1 min in 37°C, 5% CO2), counted by Trypan blue assay, centrifuged (220 × g, 5 min, 22°C) and resuspended in culture medium (supplemented with either rifampicin or vehicle) and re‐plated onto XF24 tissue culture treated cell culture microplates (V7‐PS, Part no. 100777‐004) previously coated with PDL (mg·cm−2) at 40 000 cells per well in a volume of 150 μL. Seahorse plates containing cells were centrifuged at 2000 × g for 1 min in both orientations to ensure cells were homogeneously adhered to the bottom surface of the plate in a single layer. Wells were supplemented with an additional 350 μL medium (again, with either rifampicin or vehicle added) to yield a total volume of 500 μL media and subjected to overnight incubation at 5% CO2, 37°C. Before the extracellular flux analysis was run, the medium was changed to Seahorse medium (10 g·L−1 DMEM low glucose powder containing 1 g·L−1 glucose supplemented with D‐glucose to reach the final concentration of 10 g·L−1 glucose, 4 mM glutamine, 1 mM Na pyruvate, and pH 7.4, adjusted with KOH). These were allowed to incubate at 37°C in a CO2‐free environment for 1 h prior to starting measurement by the Extracellular Flux Analyzer (XF24 Extracellular Flux Analyzer, Seahorse Bioscience, Billerica, MA) as previously described (Dranka et al., 2011; Módis et al., 2013). Cartridges were loaded in the following ports and respective 10× concentrations: Port A, oligomycin ([1.3 μM]); Port B, carbonyl cyanide 4‐(trifluoromethoxy)phenylhydrazone ([4 μM]); Port C, 2‐deoxyglucose ([1 M]); and Port D, antimycin ([20 μg mL‐1]) and rotenone ([20 μM]). Oxygen consumption rate and other bioenergetic parameters were calculated as described (Módis et al., 2013). Normalization of extracellular flux analysis data was achieved through a Hoechst staining protocol (Chazotte, 2011). In brief, after extracellular flux analysis, media was carefully aspirated off of cells and replaced with with 60 μL 10 μM Hoechst H33342 dye in PBS containing calcium and magnesium (HyClone). Cells were incubated for 30 min at 37°C after which staining solution was aspirated off, cells were rinsed with PBS containing calcium and magnesium, and 100 μL phenol red‐free DMEM supplemented with 1 g·L−1 glucose, 2 mM glutamine, and was added to cells immediately before reading in spectrophotometer measuring fluorescence at excitation 360 nm, emission 460 nm.
Flow cytometry analysis of cell death
Approximately 300 000 cells per treatment condition (six wells per experiment) were trypsinized (0.05% trypsin, 1 min, 37°C) and pooled from the stretch plates, washed twice in chilled PBS and centrifuged at 220 × g, for 5 min at room temperature. Next, the protocol from BD PE Annexin V apoptosis staining kit (BD Pharmingen, 559763) was applied according to the manufacturer's instructions and as previously described (Chao et al., 2016). In brief, the cell pellet was resuspended in 1× Binding Buffer. A 1/20 volume equivalent of each dye (PE Annexin V, 7 AAD) was added to 100 μL cell suspension, and these were incubated in the dark, 22°C, 15 min. The mixture was further diluted fivefold with binding buffer and two‐channel flow cytometry was used to detect early and late apoptotic as well as dead cells (PE Annexin V vs 7‐AAD) within 1 h.
RSI in human fetal neural stem cell‐derived neurons
The K048 line of human neural stem cells (hNSCs), originally derived from the cortex of an 8 week human fetus, was propagated in vitro as described previously (Wu et al., 2002). Briefly, cells were grown as neurospheres in DMEM/F12 basic media supplemented with 20 ng·mL−1 epidermal growth factor, 20 ng·mL−1 fibroblast growth factor 2, 10 ng·mL−1 leukaemia inhibitor factor and N2; and passaged every 10 days. Neural differentiation of hNSCs was done based on our previous description with minor modification (Wang et al., 2012). Briefly, small spheres of hNSCs (passage number 20) were seeded at a density of 5.2 × 104 cm‐2 in BIOFLEX® culture plates (Flexcell International Co., Hillsborough, NC) precoated with 0.01% poly‐D‐lysine and 1 μg·cm−2 laminin (Invitrogen). Cells were incubated with ELL media containing 20 ng·mL−1 EGF, 10 ng·mL−1 leukaemia inhibitor factor, and 1 μg·mL−1 laminin for 4 days, and then switched to DMEM/F12 medium with WW1 for 10 days with two thirds of the medium replaced every 3–4 days. Differentiated hNSCs were subjected to RSI (peak pressure of 62 kPa) using a Cell Injury Controller II (Custom Design & Fabrication Inc., Sandston, VA) as described (Wang et al., 2012). Thirty minutes before RSI, rifampicin or vehicle was added into each well at various concentrations (10, 30 and 100 μM), followed by two thirds of the medium replaced with fresh differentiation media containing vehicle or rifampicin daily for additional 4 days. One day after stretch injury on differentiated hNSCs, medium aliquots from each treatment were collected for assessment of LDH release as described above. In addition, 1 day after SI, a subset of differentiated hNSCs was subjected to staining with Fluoro‐Jade C (Histo‐Chem Inc., Jefferson, AR). Briefly, cells were incubated with 0.06% potassium permanganate (Fisher Scientific, Fair Lawn, NJ) in tap water for 1 min, rinsed with tap water for 2 min, and then followed by an incubation with 0.0001% Fluoro‐Jade C and 0.1% acetic acid in tap water for 10 min. Stained cells were briefly washed in tap water three times and mounted with acidic mounting media. Four days after stretch injury, differentiated hNSCs were fixed with 4% paraformaldehyde and subjected to immunofluorescent staining as described before (Wang et al., 2012). Neurons were labelled by mouse monoclonal anti‐neuronal class III β‐tubulin (TuJ1, 1:2500, Covance), and visualized by goat anti‐mouse IgG conjugated with Alexa Fluor® 568 (Invitrogen/Molecular Probes, 1:400). Nuclei were counterstained with DAPI (Sigma). Images were acquired by a Nikon 80i epifluorescent microscope using the NIS‐Elements imaging software.
Data and statistical analysis
The data and statistical analysis in this study comply with the recommendations on experimental design and analysis in pharmacology (Curtis et al., 2015). Statistical analyses were carried out with the GraphPad Prism Version 4 software (GraphPad Software, San Diego, CA). ANOVA with Tukey's or Fisher's post test was used for comparing multiple groups. In the studies using stem cell‐derived neurons, the number of TuJ1‐labelled neurons was blindly counted and aided by NIS‐Elements imaging software. The length of each neurite was measured from the edge of soma to the longest traceable terminal. Approximately 800 neurons labelled with TuJ1 from 14 randomly selected fields from three independent experiments were included for quantitative assessments.
Materials
All chemicals and reagents, unless otherwise noted, were purchased from Sigma‐Aldrich. For medium‐throughput screening, a collection of 3570 clinically used drugs and pharmacologically well‐characterized compounds was compiled comprising the NIH Clinical Collection (450 phase I‐III trial compounds, from NIH, Bethesda, MD), the BioFocus compound collection (Biofocus, South San Franciso, CA), the FDA Approved Library (640 FDA approved bioactive compounds), Enzo Life Sciences library (Enzo, Farmingdale, NY), the Prestwick Chemical Library (1200 marketed drugs in Europe) (Prestwick Chemicals, Washington, DC), and the International and U.S. Drug Collections (240 compounds marketed in only Europe or Asia and 1040 compounds marketed in the US respectively) (MicroSource Discovery Systems, Gaylordsville, CT) (Table 1). Compounds were dissolved at 10 mM in DMSO and dilutions were made either in DMSO or in PBS (pH 7.4) to obtain 0.5% final DMSO concentration used in the screening plates.
Table 1.
Summary of the clinical libraries included in the composite library used for the screening: The sources of drugs included the IDC, NIH, FDA, USD and Prestwick chemical libraries: a total of 3670 compounds
| Compound collection | Number of compounds | Description | Source and link |
|---|---|---|---|
| NIH Clinical Collection | 450 | Compounds that have already been in clinical use or in clinical trials | National Institutes of Health www.nihclinicalcollection.com |
| US Drug Collection | 1140 | Compounds that have reached the stage of clinical trials in the USA | Microsource Discovery Systems www.msdiscovery.com |
| International Drug collection | 240 | Compounds that have reached the stage of clinical trials in other countries | Microsource Discovery Systems www.msdiscovery.com |
| New Prestwick Chemical Library | 1200 | Drugs that are in clinical use | Prestwick www.prestwickchemical.com |
| FDA Approved Drug Library | 640 | Compounds selected from another library of clinically used compounds | Enzo Life Sciences www.enzolifesciences.com/BML‐2841/fda‐approved‐drug‐library/ |
Results
An in vitro TBI model consisting of RSI and oxidative stress induces delayed cell death in differentiated B35 neural cells
To develop the experimental model used for the current medium‐throughput drug screening project, we initially evaluated three neural cell lines in an in vitro stretch‐injury model, combined with oxidative stress. We differentiated the cells on flexible bottomed Bioflex culture plates coated with collagen I, poly‐D‐lysine and laminin that were previously found optimal for the human stem cell derived neural cells (Wang et al., 2012). Differentiation was initiated with retinoic acid (ATRA) or butyrate in the B35 and SH‐SY5Y cells and by serum deprivation in the RN33B cells either in B16 medium or in DMEM. Differentiation also induced robust changes in gene expression (Figure 1, Supporting Information Table S1). The three cell types showed different gene expression profiles during differentiation, but the expression patterns showed similarity in each cell type irrespective of the differentiation agents used. Neurogenins, the basic helix‐loop‐helix (bHLH) transcription factors that regulate neural development (Yuan and Hassan, 2014), were up‐regulated in all cell types, but while in the B35 cells neurogenin‐1 up‐regulation was the dominant process, neurogenin‐2 was induced in SH‐SY5Y cells and both neurogenins were up‐regulated in RN33B cells (Figure 1). Neurogenins promote neural differentiation in collaboration with bone morphogenetic proteins (Bmp2, Bmp4 and Bmp8a), which are also up‐regulated in all three cell types, and inhibit gliogenesis via blocking the LIF‐STAT3 (leukaemia inhibitory factor, Signal transducer and activator of transcription 3) pathway (Morrison, 2011). The neural fate marker Sox2 (sex determining region Y‐box 2) (Dailey and Basilico, 2001) and Pou3f3 (POU class 3 homeobox 3) (Tang et al., 2015) transcription factors were also expressed in selected lines. While the expression of the above neural progenitor markers was retained, all lineages expressed immature neuron markers (e.g. doublecortin and DCX) as well as differentiated neuronal cell markers). All lineages showed an overlapping neuronal phenotype: they expressed cholinergic (acetylcholinesterase, Ache; choline acetyltransferase, Chat and muscarinic M2 receptor, Chrm2), dopaminergic (tyrosine hydroxylase, Th; and D2 dopamine receptor, Drd2) and glutamatergic markers (N‐methyl‐D‐aspartate receptor, Grin1) at various levels. All cell lines stopped dividing during differentiation: the proliferation marker ID‐1 (DNA‐binding protein inhibitor ID‐1) was markedly reduced in the differentiated cells (Figure 2A). Cell differentiation was also associated with changes in the cellular morphology: the cells grew long neurites with multiple branches (Figure 2B) that predicted increased vulnerability to mechanical trauma.
Figure 1.
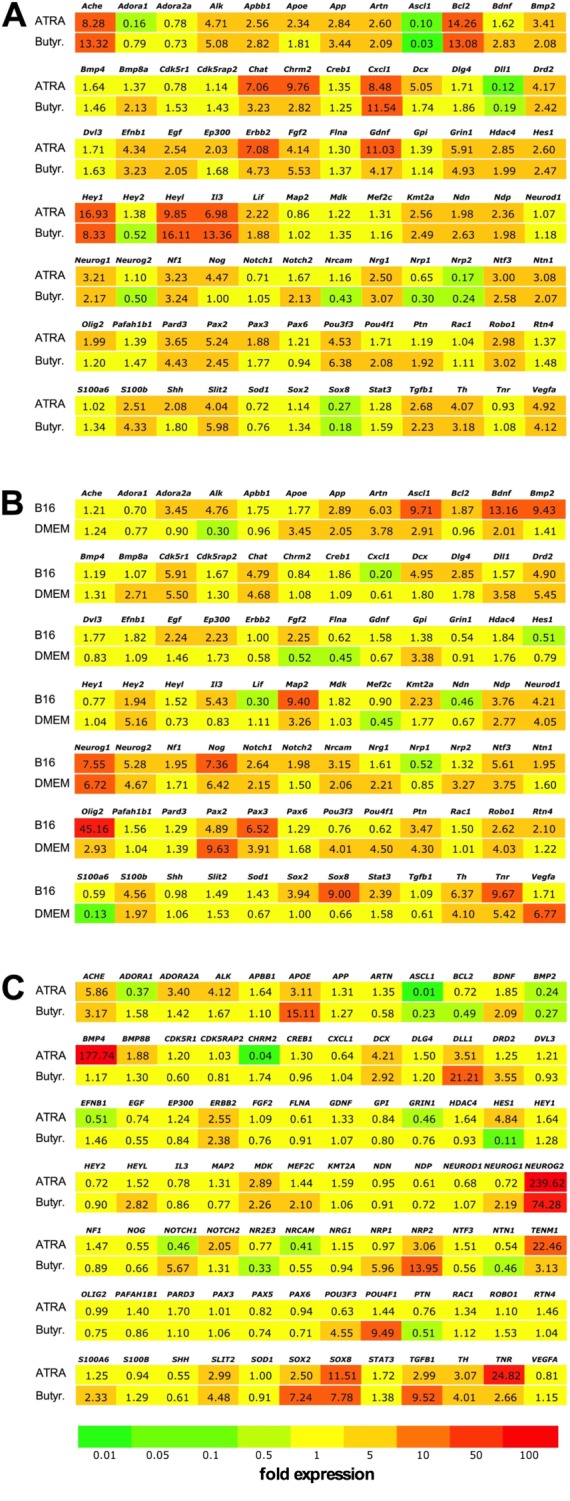
Differentiation‐associated gene expression changes in neural cells. Expression levels of genes associated with neural differentiation were evaluated using neurogenesis PCR arrays. Gene symbols and average fold changes are shown compared with non‐differentiated control cells on a coloured background that highlights the changes in expression levels. (A) B35 neuroblastoma cells, differentiated by exposure to ATRA (10 μM) or sodium butyrate (Butyr., 300 μM). (B) RN33B neural cells, differentiated by exposure to 39°C in serum‐free B16 or DMEM/F12 medium. (C) SH‐SY5Y neuroblastoma cells, differentiated by exposure to ATRA (10 μM) or sodium butyrate (300 μM).
Figure 2.
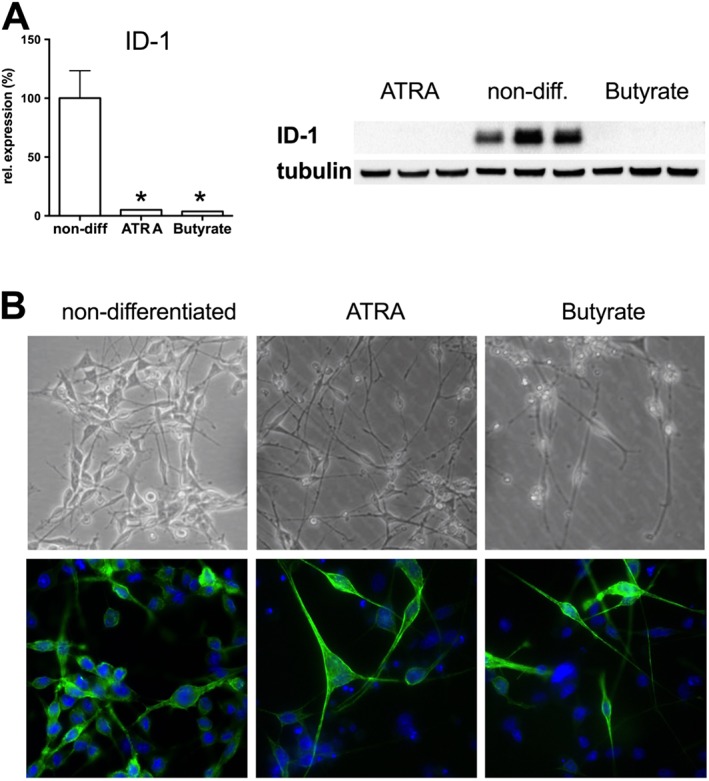
Differentiation of B35 neural cells on the morphological and protein expression level. B35 neuroblastoma cells were grown on collagen‐treated culture surface, and differentiation was induced by exposure to ATRA (10 μM) or sodium butyrate (Butyrate, 300 μM). (A) The level of the cell proliferation marker ID‐1 was measured by Western blotting. In differentiated B35 cultures, ID‐1 was almost undetectable. Representative blot image and densitometric analysis of ID‐1 values normalized to tubulin expression are shown. Data are shown as mean ± SEM, n = 5; *P < 0.05, significant change in ID‐1 expression in differentiated cells compared to non‐differentiated cells. Western blot shows representative of blots conducted on n = 3 experimental days. (B) Phase contrast images of non‐differentiated, ATRA‐ and butyrate‐differentiated B35 cells are shown. (C) Non‐differentiated and differentiated B35 cells were stained with actin stain (Alexa Fluor 488 phalloidin) and nuclear stain Hoechst 33342 to highlight the neurite outgrowths.
Stretch injury was carried out using the Flexcell Tension System that can induce controlled equibiaxial strain to monolayers on the silicone elastomer culture surface of Bioflex plates. The Flexcell Tension System uses vacuum to control the expansion of the silicone membrane and is capable to induce 2–14% elongation of the HT Bioflex plates (Figure 3A). We subjected ATRA‐differentiated B35 cells to various elongation procedures to determine the cellular damage induced by them. LDH release was measured in the cell culture supernatant 2 and 24 h after the stretch injury and the cellular viability was measured after 24 h by the MTT assay. No detectable change in the LDH level of the cell culture supernatant was seen after 2 h (Figure 3B), confirming that the stretch injury did not induce immediate cellular damage. No significant changes were detectable after 24 h either when the elongation was less than 10%, but the cellular viability was significantly reduced and increased LDH activity was seen in the supernatant after 10–14% elongation (Figure 3C,D). In line with the findings reported in a model of RSI of human stem cell derived neural cells (Wang et al., 2012), the cell damage occurs after a prolonged interval following the stretch in B35 cells and the late‐onset damage is proportional to the elongation.
Figure 3.
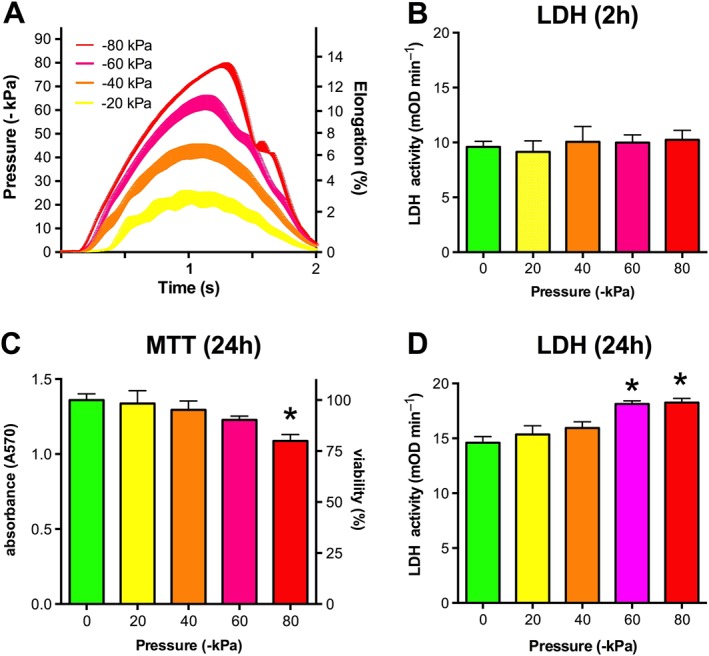
RSI on the Flexcell Tension System. B35 cells were differentiated by exposure to ATRA (10 μM) on flexible silicon‐rubber HT Bioflex culture plates. The cells were subjected to RSI (circumferential elongation) by applying vacuum pulse (−20 to −80 kPa) controlled by the Flexcell Tension System using sine wave regimens. (A) The registered pressure changes and respective elongation values are shown. (B) LDH release, measured in the supernatant 2 h post‐injury. (C, D) Cell viability (C) and LDH release (D), measured 24 h after the stretch injury. Significantly reduced viability and increased LDH release was measured in cells subjected to the most intense strain (−80 kPa pressure, 14% elongation). Data are shown as mean ± SEM, n = 5. *P < 0.05, significant differences in LDH release 24 h after RSI compared to control cells not subjected to stretch injury.
Next, we tested the effect of stretch injury in the SH‐SY5Y cells and both neurogenins were up‐regulated in RN33B cells, using the most intense elongation setting (−80 kPa pressure, 14% elongation) and monitored cell viability 48 and 72 h following the stretch. No change was detectable in the LDH release compared with non‐stretched controls in any of the lineages 2 h following the injury (Figure 4). The ATRA‐differentiated B35 cells showed reduced viability and increased LDH release at the later time points (48–72 h), but cell death was not detectable in the other cell lines. Cellular ATP level was diminished in response to RSI in the ATRA‐differentiated B35 cells, but not in the other cells (Figure 4).
Figure 4.
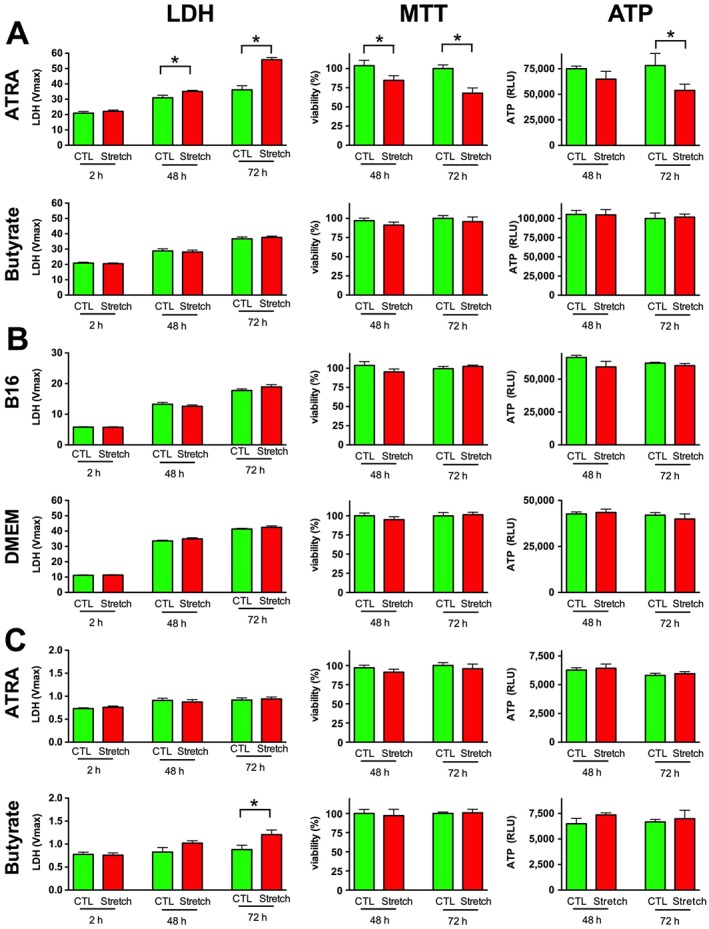
RSI induces delayed cell death in ATRA‐differentiated B35 cells. Neural cells were grown on HT Bioflex culture plates and B35 (A) and SH‐SY5Y (C) cells were differentiated by exposure to ATRA or butyrate, RN33B cells (B) by exposure to 39°C in serum‐free B16 or DMEM/F12 medium. The cells were exposed to stretch injury (−80 kPa, 2 s) on the Flexcell Tension System and the cell death was also confirmed by measuring the LDH release in the cell culture supernatant 2, 48 and 72 h after the injury. Cell viability was measured by the MTT viability assay and by quantification of the ATP content of the cells 48 and 72 h following the initial injury. Data are shown as mean ± SEM, n = 5. *P < 0.05, significant injury (increased LDH release, decreased MTT conversion or decreased ATP content) compared with the respective control cells not subjected to stretch injury.
As the degree of cell injury in response to RSI alone was absent in the SH‐SY5Y cells and in the RN33B cells, and was relatively modest (less than 30%) in the B35 cells, we combined the stretch injury with mild oxidative stress: hydrogen peroxide (H2O2) was added following the injury at a concentration that did not induce cell death by itself in non‐stretched neural cells (Figure 5A). The combination of the stretch injury with subsequent H2O2 treatment augmented cell death in B35 cells 24 h after the injury and also reduced the intra‐ and inter‐assay variability that improved the assay conditions for the planned subsequent medium‐throughput screening. Cells subjected to the combined stretch + oxidative challenge also showed increased α smooth muscle actin expression following the injury (Figure 5B), which is a sensitive marker of traumatic axonal injury both in vivo and in vitro (Wang et al., 2012), consistently with the notion that this model shares mechanistic features with previously established models.
Figure 5.
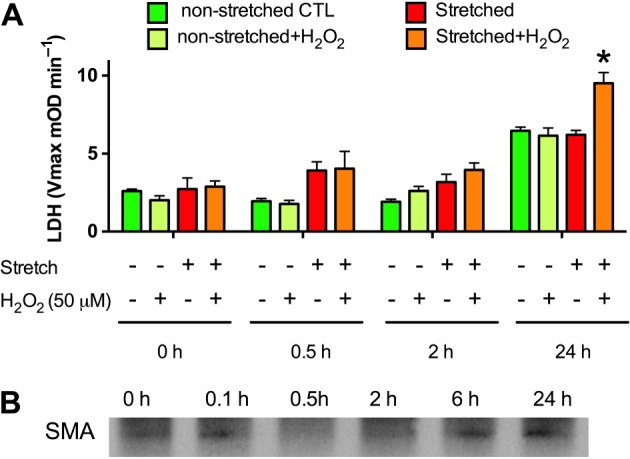
Oxidative stress augments the RSI‐induced cell death in ATRA‐differentiated B35 cells. ATRA‐differentiated B35 cells were subjected to stretch injury (−80 kPa, 2 s) and subsequently treated with H2O2 (50 μM). (A) Cell injury was detected by measuring the LDH release into the supernatant from samples collected prior to and following the stretch injury (0.5, 2 and 24 h). H2O2 significantly potentiates the cytotoxic action of the stretch. The combination of RSI (30 cycles, 0.67 Hz, −80 kPa) and oxidative stress (50 μM H2O2) is henceforth referred to as an ‘in vitro TBI injury model’. Data are shown as mean ± SEM, n = 5. *P < 0.05, significant injury by the combination of RSI and oxidative stress. B: Expression level of α‐smooth muscle actin (SMA), detected by Western blotting, at various time points after stretch injury. Western blot shows representative of blots conducted on n = 3 experimental days.
The cellular responses to our in vitro TBI model (which is what the above combination of RSI and oxidative stress is designated for the current report) were further characterized by proteomic analysis. MS of undifferentiated and differentiated B35 cells that were either non injured or undergone TBI revealed that 3.9% (159) of the 4093 identified proteins were up‐regulated, and 3.2% (131 proteins) were down‐regulated in TBI relative to other other conditions (Figure 6A, Supporting Information Table S2). Of the 159 proteins up‐regulated in TBI, four were partially up‐regulated in the differentiation only condition relative to undifferentiated cells, 46 did not have expression level changes attributable to differentiation alone, and 109 were down‐regulated in response to differentiation alone though up‐regulated in TBI (Figure 6B). Of the 131 proteins down‐regulated in TBI, three were partially down‐regulated due to differentiation alone, 38 underwent no expression change due to differentiation, and 90 were up‐regulated in differentiation though down‐regulated upon TBI (Figure 6C). The proteins affected belonged to several classes, including structural, catalytic, binding and enzyme regulators (Figure 6D).
Figure 6.
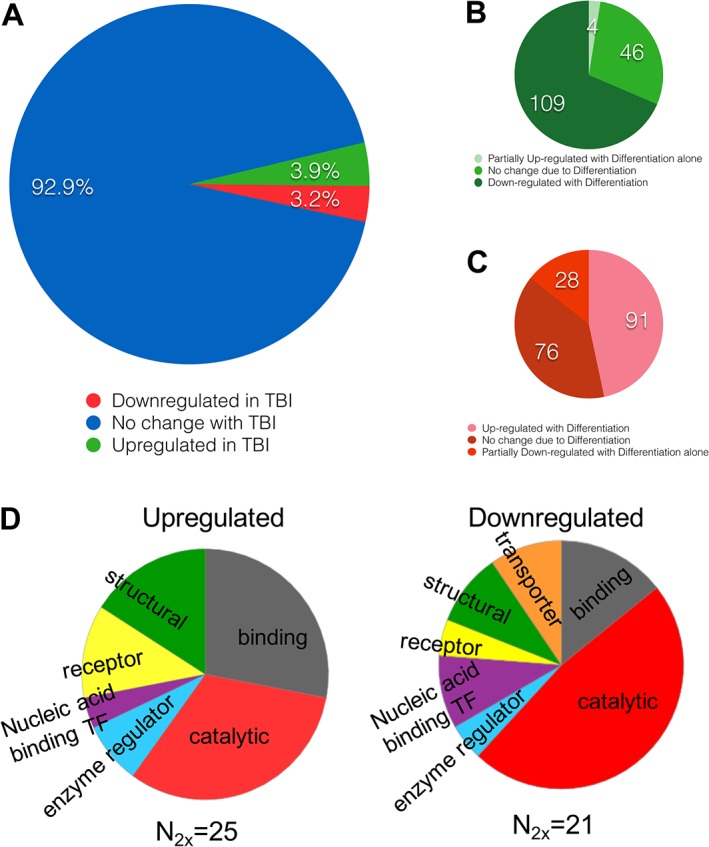
Protein up‐ and down‐regulation in response to the in vitro TBI model in B35 cells. (A) Of 4093 proteins identified in all B35 samples, 3.9% (159) were up‐regulated and 3.2% (131) were down‐regulated in TBI conditions – a combination of RSI (30 cycles, 0.67 Hz, −80 kPa) and oxidative stress (50 μM H2O2) – relative to either differentiated alone or undifferentiated cells. (B) Of the TBI up‐regulated proteins, partial up‐regulation was attributable to differentiation in four cases, and differentiation alone induced down‐regulation of 109 proteins, while the last 46 proteins were unaffected by the process of differentiation and up‐regulated solely due to TBI. (C) Of the TBI down‐regulated proteins, partial down‐regulation was attributable to differentiation in 28 cases, and differentiation alone induced up‐regulation of 91 proteins, whereas the last 76 were unaffected by the process of differentiation and were down‐regulated solely due to TBI. (D) Functional classification of the proteins that were up‐ or down‐regulated by the in vitro TBI model.
Screening of a composite library of clinical drugs and well‐characterized compounds in the in vitro TBI model
The experimental design of the screen is shown in Figure 7A. The sources of the compound libraries are shown in Table 1. After differentiation, RSI and H2O2 challenge (as above) a 1‐h incubation occurred, after which test compounds were added to the stretch plates. Delayed administration of the test compounds was applied, in order to mimic the clinical condition (TBI), in which pretreatment with drugs or experimental compounds are normally not feasible. LDH and MTT assays were conducted 24 h later. A scatter plot was compiled from the experimental data set in which every data point was expressed as coordinate Z scores calculated from both LDH release and MTT conversions measures. The corresponding control‐derived cut‐offs were equivalent to ZMTT = +1.011 and ZLDH = −0.995. The LDH and MTT Z scores are depicted on the vertical, and horizontal axes, in the scatterplot shown in Figure 7B. Vehicle‐treated cells subjected to TBI were pooled into a single control data set from which cut‐off values were calculated for the experimental data set. When selecting compounds that showed three control‐defined standard deviations below the average control LDH release as well as three control‐defined standard deviations above the average control MTT release, 223 compounds satisfied the MTT filter, 54 satisfied the LDH filter, and six compounds satisfied both. Thus, six drugs (indapamide, captopril, rifampicin, cephradine, camphor and etoposide) were identified from the screen as potential hits. These compounds were subjected to follow‐up studies. For each of the hits, dose responses were obtained in the concentration range of 1–100 μM, which confirmed the inhibitory action of five of the identified compounds, while neuroprotective effect of cephradine could not be confirmed (Figure 8).
Figure 7.
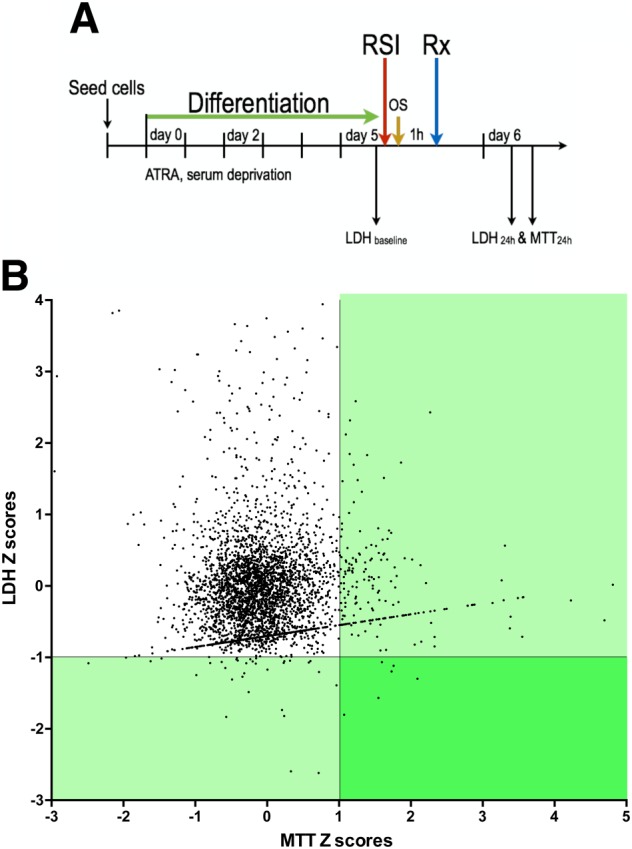
Results of the medium‐throughput screen using the in vitro TBI model. (A) B35 cells were differentiated through a combination of serum deprivation and chemical induction with 10 μM ATRA media supplement. At the fifth day of differentiation, cells were subjected to the in vitro TBI model: a combination of RSI (30 cycles, 0.67 Hz, −80 kPa) and oxidative stress (50 μM H2O2). Test compounds were applied 1 h later at a final concentration of 3 μM. Baseline and 24 h endpoint measures were used to assess the ‘neuroprotective character’ of drugs in the screen. (B) Injured and vehicle‐treated controls were assessed to provide LDH and MTT score cut‐offs of MeanCTL,LDH‐3SDCTL and MeanCTL,MTT + 3SDCTL, which corresponded to LDH score = 143.7 and MTT score = 126.5. The scatter plot above shows Z scores within the screening data set generated such that the control‐derived cut‐offs fell along Z = 1.011 for the MTT axis and Z = −0.995 for the LDH axis. This revealed 223 compounds that satisfied the MTT requirement and 54 compounds satisfying the LDH requirement. The overlap of these two regions identified six compounds (rifampicin, indapamide, captopril, etoposide, cephadrine and D‐camphor) that were designated as potential ‘hit compounds’ and were subjected to follow‐up studies.
Figure 8.
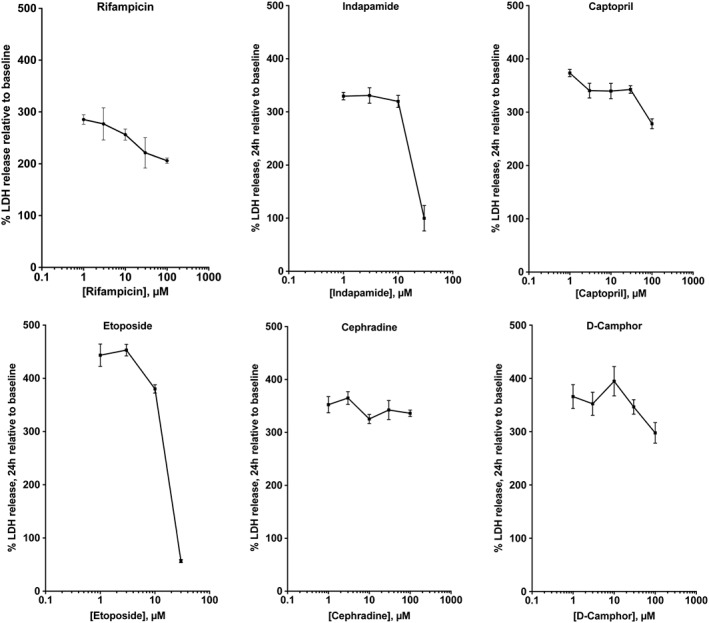
Dose‐responses: effect of the six potential compounds (rifampicin, indapamide, captopril, etoposide, cephadrine and D‐camphor) identified in the in vitro TBI model on LDH release in differentiated B35 cells. Drugs were applied at 1 h after in vitro TBI. Data are shown as mean ± SEM, n = 5.
Rifampicin‐mediated neuroprotection: mechanistic studies
From the identified hit molecules, the antibiotic rifampicin was selected for follow‐up studies. First, the effect of rifampicin on cell death was evaluated using flow cytometry. The in vitro TBI model increased the percentage of late apoptotic and necrotic cell population; rifampicin (10, 30 and 100 μM) protected against cell death (Figure 9A). Next, the effect of rifampicin on bioenergetic alterations was investigated using Extracellular Flux analysis. The in vitro TBI model decreased mitochondrial function; rifampicin (30 μM) protected against the suppression of maximal mitochondrial respiration and of the mitochondrial reserve capacity (Figure 9B). Since rifampicin has previously been identified as a protein phosphatase A2 inhibitor (Park et al., 2008), we next tested whether inhibition of protein phosphatase ‐ using the commonly used PPA2 inhibitor okadaic acid protects in the current in vitro TBI injury model. Okadaic acid was without significant protective effect, neither in pretreatment nor in a 3 h post‐treatment experiment (Supporting Information Figure S1A). Because oxidative stress is a significant component of TBI in vivo and in vitro (Hoffman et al., 2000; Li et al., 2010; Abdul‐Muneer et al., 2015; Hiebert et al., 2015; Kochanek et al., 2015), and as rifampicin has previously been shown to exert antioxidant effects (Wasil et al., 1988; Tomiyama et al., 1996), we have also tested whether rifampicin protects against a purely oxidative type injury in differentiated B35 cells. A high concentration of H2O2 (500 μM) induced a significant amount of LDH release, and pretreatment with rifampicin concentration‐dependently protected against this response (Supporting Information Figure S1B).
Figure 9.
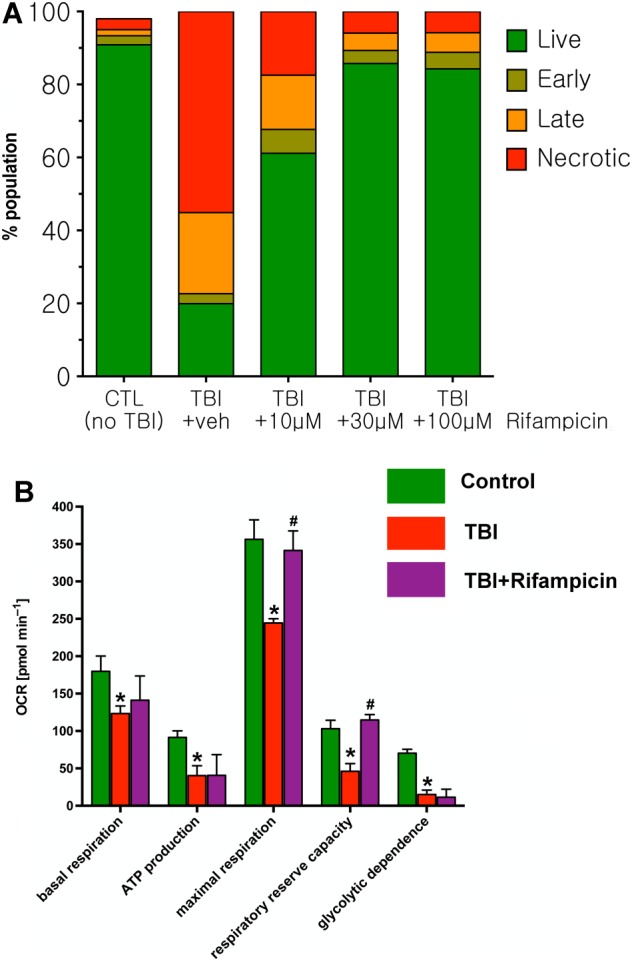
Rifampicin reduces the percentage of late apoptotic and necrotic cell population after in vitro TBI in differentiated B35 cells and improves bioenergetic parameters. (A) Treatment with increasing concentrations of rifampicin (10 to 100 μM, applied at 1 h post in vitro TBI) produced a reduction in the percentage of apoptotic cells detected by flow cytometry. Results of a representative flow cytometry experiment are shown. (B) Rifampicin protects against the in vitro TBI induced impairment in bioenergetic parameters, assessed by Extracellular Flux Analysis, in differentiated B35 cells. Data are shown as mean ± SEM, n = 5. *P < 0.05, significant deleterious effect of the in vitro TBI challenge compared to control (non‐TBI subjected) neurons; #P < 0.05, significant protective effect of rifampicin on the indicated bioenergetic parameters.
To further confirm the neuroprotective effect of rifampicin, its effect was also tested in normal hNSC derived neurons subjected to RSI. The stem cells were differentiated into neurons and astrocytes and then subjected to a RSI. As shown in Figure 10A, about 20% differentiated cells were stained with Fluoro‐Jade C (FJC), whereas stretch injury significantly increased the number of FJC + cells approximately 1.5 fold at 24 h. Treatment with rifampicin significantly reduced the percentage of cells (approximately 34%) exhibiting FJC staining. When cells were maintained for 4 days after injury, there was a 28% reduction of TuJ‐1 immuno‐labelled neurons and a 44% shortening of the mean neurite length (Figure 10B). Rifampicin (30 μM) prevented the SI‐induced neuronal loss, and significantly reduced the SI‐induced neurite length shortening response.
Figure 10.
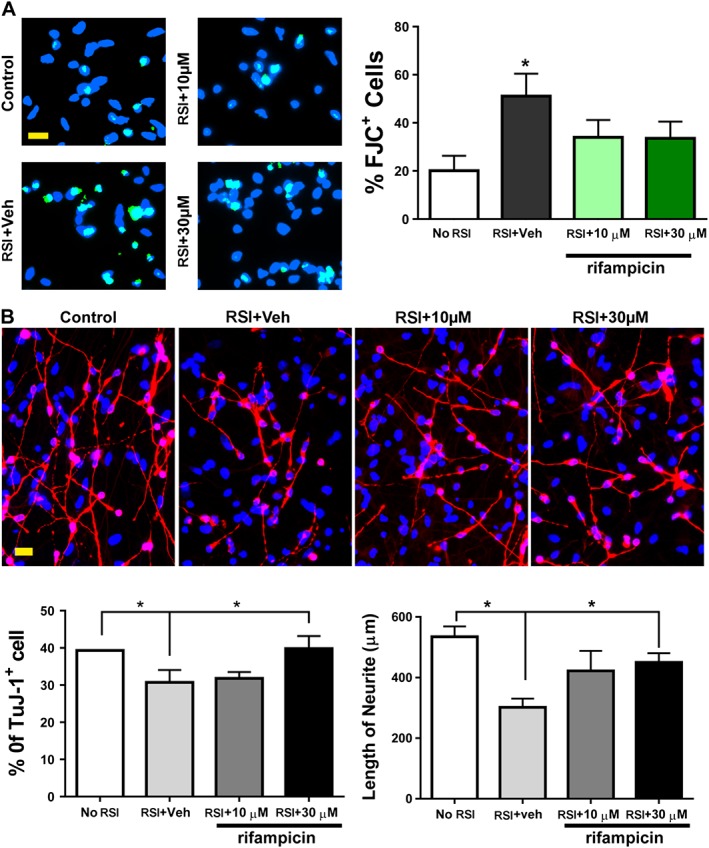
Protection of rifampicin against RSI in human neural stem cell‐derived neurons. (A) One day after a RSI with or without rifampicin pretreatment, cells were stained with Fluro‐Jade C (green). (B) Four days after injury, neurons were labelled by TuJ‐1 antibody (red). Veh: vehicle control. Scale bars, 20 μm. Blue, DAPI nuclear counterstain. Data are shown as mean ± SEM, n = 5. *P < 0.05, significant differences between the indicated groups.
Discussion
The first purpose of the current study was to establish an in vitro, stretch‐based model of neural injury. The second purpose of the study was to screen a composite library of clinically used drugs and compounds, in order to facilitate the in vitro identification of compounds that may have the potential to decrease the cellular damage in neurotrauma in vivo. From the screening of three neuronal cell lines (B35, RN33B and SH‐SY5Y) and several differentiation methods, ATRA‐differentiated B35 cells were selected for the screen; the neuroinjury was induced by the combination of RSI and a low concentration of H2O2, which, on its own, did not result in detectable loss of neuronal viability. The combination of these two sources of injury is justified by considering the pathomechanisms of clinical TBI, where the initial mechanical trauma is often followed by oxidative stress, which is the consequence of not only the initial mechanical trauma, but the subsequent circulatory and vascular disturbances and inflammatory processes, which generate a variety of oxygen‐ and nitrogen‐derived oxidants and free radicals, including superoxide, hydrogen peroxide and peroxynitrite (DeWitt et al., 1995; Bramlett and Dietrich, 2007; DeWitt and Prough, 2009; Abdul‐Muneer et al., 2015; Kochanek et al., 2015; Laskowitz and Grant, 2016; Pearn et al., 2016). Many in vitro models of TBI have previously been developed; as reviewed by Morrison et al. (2011)ll of these approaches attempt to incorporate various pathophysiological aspects of the in vivo disease condition into the in vitro model, reproducing in these in vitro models some (but obviously not all) of the pathophysiological events of the in vivo TBI (Lamprecht et al., 2016). Combination approaches for establishing in vitro models of TBI have previously been developed; for instance, the combination of stretch and ischaemic injury has been employed in cultured mouse cortical cells (Glass et al., 2004; Engel et al., 2005), the combination of stretch and NDMA receptor activation has also been employed by several groups (Arundine et al., 2004; Bell et al., 2009). However, to our knowledge the current study is the first systematic survey of a comprehensive collection of clinically used drugs and drug‐like compounds in an in vitro model of TBI, with the declared goal of identifying compounds with neuroprotective potential. In order to mimic the clinical conditions (where the onset of TBI is not predictable, and treatments are typically administered with a time delay following TBI onset), special attention was paid to ensure that the administration of the test compounds in the screen was delayed relative to the RSI/H2O2 challenge.
As expected, our in vitro TBI model induced marked alterations in the cells; not only net outcome variables of cell injury (flow cytometric identification of late apoptotic and necrotic cell populations; the latter population likely contributing to the LDH release into the medium), as well as a wide array of pathophysiological and adaptive alterations (e.g. marked changes in gene expression and proteomic signature), as well as a significant dysfunction of mitochondrial parameters (measured, in detail, by Extracellular Flux Analysis, also indicated by the decreased ability of MTT conversion and reduced intracellular ATP levels) was noted.
The screen identified six compounds that improved both parameters of our medium‐throughput in vitro TBI screen (i.e. attenuated LDH release and increased MTT conversion), five of which (rifampicin, indapamide, captopril, etoposide and, to a lesser extent, D‐camphor) were reproduced in subsequent dose–response studies. The well‐known antibiotic rifampicin, which protected the neurons in the concentration range of 3–30 μM, was subjected to further characterization, and its neuroprotective effect was also confirmed in a second model (in human stem cell derived neurons). In this model, higher levels of stretch induce rapid cell death (necrosis/apoptosis), whereas at the pressure settings applied in the current study, a more delayed mode of injury (characterized by loss of neurites, as well as some cell necrosis, as shown by LDH release) occurs (Wang et al., 2012). In this model (where stretch was the only stimulus applied, and no additional exogenous oxidants were administered), rifampicin attenuated LDH release, protected against the loss of neurite length and maintained neuron‐specific class III β‐tubulin immunoreactivity. The other four compounds remain to be further investigated in the context of TBI; it should be noted, nevertheless, that earlier studies in various models have demonstrated both neuroprotective effect of captopril as well as exacerbation of neuronal injury (Werner et al., 1991; Fukuda et al., 2010; Harford‐Wright et al., 2010; Smeda and Daneshtalab, 2011); indapamide has also been demonstrated to exert neuroprotective effects in stroke‐prone spontaneously hypertensive rats (Biagini et al., 1997). In contrast, etoposide has previously been reported to exert deleterious, rather than neuroprotective effects in various models (Muramoto et al., 2003; Di Giovanni et al., 2005).
In the next part of the current study, we have examined the mode of rifampicin's action. First of all, rifampicin reduced cell necrosis and apoptosis and improved cellular bioenergetics, consistently with the results of the screening parameters (LDH release is typically considered a consequence of cell necrosis, while reduced MTT conversion a consequence of reduced mitochondrial activity) (reviewed in: Szabo, 2005; Dranka et al., 2011). The mode of action in the current model does not appear to involve protein phosphatase 2A (a previously identified secondary target of rifampicin) (Park et al., 2008), but it may, at least in part, include an antioxidant action, because rifampicin was found to also inhibit neuroinjury elicited by high‐dose hydrogen peroxide. However, it is also possible that rifampicin acts at a further common downstream point from either the in vitro TBI stimulus applied (i.e. RSI and oxidative stress) or the higher concentration of H2O2 applied. It should also be mentioned that rifampicin was protective in the human stem cell‐derived neuronal model, where exogenous oxidants were not used, only RSI alone. Although the precise mechanism of its neuroprotective actions remain to be further elucidated, our findings are consistent with prior observations reporting both the antioxidant effect of this antibiotic (Wasil et al., 1988; Tomiyama et al., 1996) as well as its neuroprotective effects in vitro and in vivo (Tomiyama et al., 1996; Kilic et al., 2004; Loeb et al., 2004; Yulug et al., 2004; Yulug et al., 2014), although the exact mode of its action (independent of its antibiotic effect) has not yet been clarified; it has been proposed that antioxidant effects, inhibition of β‐amyloid aggregation, modulation of pro‐ and anti‐apoptotic factors and modulation of glucocorticoid receptors may contribute (reviewed in Yulug et al., 2014). Most relevant to the subject of the current paper are the prior studies with rifampicin in rodent stroke models (Yulug et al., 2004). In anaesthetized male C57BL/6j mice, rifampicin was tested in a model of 24 h permanent occlusion, where the drug was applied intraperitoneally prior to occlusion. The dose of 20 mg·kg−1 was effective, while the lower dose of 5 mg·kg−1 was not. Rifampicin (20 mg·kg−1) was also found effective in a model of 30 min of transient ischaemia followed by 24 h of reperfusion; in this model, the drug was administered intraperitoneally immediately prior to reperfusion (Yulug et al., 2004). Delayed administration of rifampicin has not yet been tested in stroke models. The study by Yulug and colleagues did not explore the mechanism of neuroprotection in detail; the administration of rifampicin was not associated with changes in cerebral blood flow. The rifampicin‐induced increase in the number of surviving neurons has been suggested to be related either to its antioxidant effects of rifampicin or perhaps related to its previously reported (Yerramasetti et al., 2002) effects on glucocorticoid receptors and consequent antiapoptotic actions (Gollapudi et al., 2003).
Although rifampicin is typically used as an oral drug, it has also been previously administered intracerebroventricularly in special cases (e.g. bacterial meningitis), where it produces micromolar concentrations of the drug in the CSF (Brouwer and van de Beek, 2013; Te Brake et al., 2015). When considering repurposing of rifampicin for TBI, one may consider the intracerebroventricular route, in order to maximize its CNS concentration.
As TBI is a complex in vivo process, in vitro approaches, including the current screening assay, have a number of obvious limitations. First of all, it only considers one particular cell (neuron), while. in the in vivo TBI process. a multitude of interacting cell types play pathogenetic roles. Second, it only utilizes one particular combination of stimuli (RSI and low‐level oxidative stress); obviously in the in vivo TBI, multiple stimuli are involved. Third, the model only captures early events (cell necrosis/apoptosis/mitochondrial dysfunction); the processes that are involved in later events (e.g. subchronic and chronic neurodegeneration) are clearly different, and remain to be studied in other assays. Fourth, the timing of the drug administration in the screen only involved one time point; it is possible that screening with drugs administered at different (earlier or later) time points may have produced different sets of ‘hit’ compounds.
We conclude that the current model is suitable for medium‐throughput screening to identify compounds with neuroprotective potential. The screen identified rifampicin as a neuroprotective agent, which exerts its effects by attenuating neuronal apoptosis and necrosis and preventing mitochondrial dysfunction. Because neuroprotective concentrations of rifampicin may be achievable in vivo, and it has adequate safety profile and CNS uptake, this drug may be a candidate for repurposing for the therapy of TBI.
Author contributions
C.S. and D.S.P. designed the experiments. All other authors performed the experiments and analysed data. C.S. wrote the paper.
Conflict of interest
The authors declare no conflicts of interest.
Declaration of transparency and scientific rigour
This Declaration acknowledges that this paper adheres to the principles for transparent reporting and scientific rigour of preclinical research recommended by funding agencies, publishers and other organizations engaged with supporting research.
Supporting information
Figure S1 Mechanism of rifampicin‐conferred neuroprotection may involve a partial anti‐oxidant action, but is unlikely to be related to inhibition of PP2A activity. A: Cell death (assessed by LDH release) in differentiated B35 cells subjected to the in vitro TBI model after pretreatment with various concentrations of okadaic acid, a commonly used PP2A inhibitor. Okadaic acid (0.3–30 nM) did not affect LDH release, either in a 30min pre‐treatment or in a 3 h post‐treatment. B: LDH release due to severe oxidative stress (500 μM H2O2, 24 h) was significantly reduced by rifampicin pretreatment, suggesting an anti‐oxidant mode of action. Data are shown as mean ± SEM, n = 5.
Supporting info item
Supporting info item
Supporting info item
Acknowledgements
This work was supported by a grant from the Moody Endowment (Galveston, TX, USA).
López‐García, I. , Gerő, D. , Szczesny, B. , Szoleczky, P. , Olah, G. , Módis, K. , Zhang, K. , Gao, J. , Wu, P. , Sowers, L. C. , DeWitt, D. , Prough, D. S. , and Szabo, C. (2018) Development of a stretch‐induced neurotrauma model for medium‐throughput screening in vitro: identification of rifampicin as a neuroprotectant. British Journal of Pharmacology, 175: 284–300. doi: 10.1111/bph.13642.
References
- Abdul‐Muneer PM, Chandra N, Haorah J (2015). Interactions of oxidative stress and neurovascular inflammation in the pathogenesis of traumatic brain injury. Mol Neurobiol 51: 966–979. [DOI] [PMC free article] [PubMed] [Google Scholar]
- Arundine M, Aarts M, Lau A, Tymianski M (2004). Vulnerability of central neurons to secondary insults after in vitro mechanical stretch. J Neurosci 24: 8106–8123. [DOI] [PMC free article] [PubMed] [Google Scholar]
- Bell JD, Park E, Ai J, Baker AJ (2009). PICK1‐mediated GluR2 endocytosis contributes to cellular injury after neuronal trauma. Cell Death Differ 16: 1665–1680. [DOI] [PubMed] [Google Scholar]
- Biagini G, Zoli M, Torri C, Boschi S, Vantaggiato G, Ballestri M et al. (1997). Protective effects of delapril, indapamide and their combination chronically administered to stroke‐prone spontaneously hypertensive rats fed a high‐sodium diet. Clin Sci (Lond) 93: 401–411. [DOI] [PubMed] [Google Scholar]
- Bramlett HM, Dietrich WD (2007). Progressive damage after brain and spinal cord injury: pathomechanisms and treatment strategies. Prog Brain Res 161: 125–124. [DOI] [PubMed] [Google Scholar]
- Brouwer MC, van de Beek D (2013). Intensified intravenous rifampicin in tuberculous meningitis. Lancet Infect Dis 13: 2–3. [DOI] [PubMed] [Google Scholar]
- Chazotte B (2011). Labeling Nuclear DNA with Hoechst 33342. CSHL. 1: pdf.prot5557. [DOI] [PubMed]
- Chao C, Zatarain JR, Ding Y, Coletta C, Mrazek AA, Druzhyna N et al. (2016). Cystathionine‐beta‐synthase inhibition for colon cancer: enhancement of the efficacy of aminooxyacetic acid via the prodrug approach. Mol Med . doi:10.2119/molmed.2016.00102 . [Epub ahead of print] [DOI] [PMC free article] [PubMed] [Google Scholar]
- Chong WS, Hyun CL, Park MK, Park JM, Song HO, Park T et al. (2012). Midazolam protects B35 neuroblastoma cells through Akt‐phosphorylation in reactive oxygen species derived cellular injury. Korean J Anesthesiol 62: 166–171. [DOI] [PMC free article] [PubMed] [Google Scholar]
- Croslan DR, Schoell MC, Ford GD, Pulliam JV, Gates A, Clement CM et al. (2008). Neuroprotective effects of neuregulin‐1 on B35 neuronal cells following ischemia. Brain Res 1210: 39–47. [DOI] [PMC free article] [PubMed] [Google Scholar]
- Curtis MJ, Bond RA, Spina D, Ahluwalia A, Alexander SP, Giembycz MA et al. (2015). Experimental design and analysis and their reporting: new guidance for publication in BJP. Br J Pharmacol 172: 3461–3471. [DOI] [PMC free article] [PubMed] [Google Scholar]
- Dailey L, Basilico C (2001). Coevolution of HMG domains and homeodomains and the generation of transcriptional regulation by Sox/POU complexes. J Cell Physiol 186: 315–328. [DOI] [PubMed] [Google Scholar]
- Dewan MC, Mummareddy N, Wellons JC 3rd, Bonfield CM (2016). (2016). Epidemiology of global pediatric traumatic brain injury: qualitative review. World Neurosurg 91: 497–509. [DOI] [PubMed] [Google Scholar]
- DeWitt DS, Jenkins LW, Prough DS (1995). Enhanced vulnerability to secondary ischemic insults after experimental traumatic brain injury. New Horiz 3: 376–383. [PubMed] [Google Scholar]
- DeWitt DS, Prough DS (2009). Blast‐induced brain injury and posttraumatic hypotension and hypoxemia. J Neurotrauma 26: 877–887. [DOI] [PubMed] [Google Scholar]
- Di Giovanni S, Movsesyan V, Ahmed F, Cernak I, Schinelli S, Stoica B et al. (2005). Cell cycle inhibition provides neuroprotection and reduces glial proliferation and scar formation after traumatic brain injury. Proc Natl Acad Sci U S A 102: 8333–8338. [DOI] [PMC free article] [PubMed] [Google Scholar]
- Dranka BP, Benavides GA, Diers AR, Giordano S, Zelickson BR, Reily C et al. (2011). Assessing bioenergetic function in response to oxidative stress by metabolic profiling. Free Radic Biol Med 51: 1621–1635. [DOI] [PMC free article] [PubMed] [Google Scholar]
- Engel DC, Slemmer JE, Vlug AS, Maas AI, Weber JT (2005).Combined effects of mechanical and ischemic injury to cortical cells: secondary ischemia increases damage and decreases effects of neuroprotective agents. Neuropharmacology 49: 985–995. [DOI] [PubMed] [Google Scholar]
- Fukuda K, Hirooka K, Mizote M, Nakamura T, Itano T, Shiraga F (2010). Neuroprotection against retinal ischemia–reperfusion injury by blocking the angiotensin II type 1 receptor. Invest Ophthalmol Vis Sci 51: 3629–3638. [DOI] [PubMed] [Google Scholar]
- Gero D, Szabo C (2015). Salvage of nicotinamide adenine dinucleotide plays a critical role in the bioenergetic recovery of post‐hypoxic cardiomyocytes. Br J Pharmacol 172: 4817–4832. [DOI] [PMC free article] [PubMed] [Google Scholar]
- Gero D, Szoleczky P, Suzuki K, Modis K, Olah G, Coletta C et al. (2013). Cell‐based screening identifies paroxetine as an inhibitor of diabetic endothelial dysfunction. Diabetes 62: 953–964. [DOI] [PMC free article] [PubMed] [Google Scholar]
- Glass TF, Reeves B, Sharp FR (2004). The impact of excitotoxic blockade on the evolution of injury following combined mechanical and hypoxic insults in primary rat neuronal culture. Neurobiol Dis 17: 378–384. [DOI] [PubMed] [Google Scholar]
- Gollapudi S, Jaidka S, Gupta S (2003). Molecular basis of rifampicin‐induced inhibition of anti‐CD95‐induced apoptosis of peripheral blood T lymphocytes: the role of CD95 ligand and FLIPs. J Clin Immunol 23: 11–22. [DOI] [PubMed] [Google Scholar]
- Harford‐Wright E, Thornton E, Vink R (2010). Angiotensin‐converting enzyme (ACE) inhibitors exacerbate histological damage and motor deficits after experimental traumatic brain injury. Neurosci Lett 481: 26–29. [DOI] [PubMed] [Google Scholar]
- Hiebert JB, Shen Q, Thimmesch AR, Pierce JD (2015). Traumatic brain injury and mitochondrial dysfunction. Am J Med Sci 350: 132–138. [DOI] [PubMed] [Google Scholar]
- Hoffman SW, Rzigalinski BA, Willoughby KA, Ellis EF (2000). Astrocytes generate isoprostanes in response to trauma or oxygen radicals. J Neurotrauma 17: 415–420. [DOI] [PubMed] [Google Scholar]
- Kilic U, Kilic E, Lingor P, Yulug B, Bähr M (2004). Rifampicin inhibits neurodegeneration in the optic nerve transection model in vivo and after 1‐methyl‐4‐phenylpyridinium intoxication in vitro . Acta Neuropathol 108: 65–68. [DOI] [PubMed] [Google Scholar]
- Kochanek PM, Jackson TC, Ferguson NM, Carlson SW, Simon DW, Brockman EC et al. (2015). Emerging therapies in traumatic brain injury. Semin Neurol 35: 83–100. [DOI] [PMC free article] [PubMed] [Google Scholar]
- Lamprecht MR, Elkin BS, Kesavabhotla K, Crary JF, Hammers JL, Huh JW et al. (2016). Strong correlation of genome‐wide expression after traumatic brain injury in vitro and in vivo implicates a role for SORLA. J Neurotrauma [Epub ahead of print]. [DOI] [PMC free article] [PubMed] [Google Scholar]
- Laskowitz D, Grant G. (eds) (2016). Translational Research in Traumatic Brain Injury. CRC Press/Taylor and Francis Group: Boca Raton (FL). [PubMed] [Google Scholar]
- Li Y, Hawkins BE, DeWitt DS, Prough DS, Maret W (2010). The relationship between transient zinc ion fluctuations and redox signaling in the pathways of secondary cellular injury: relevance to traumatic brain injury. Brain Res 1330: 131–141. [DOI] [PMC free article] [PubMed] [Google Scholar]
- Loeb MB, Molloy DW, Smieja M, Standish T, Goldsmith CH, Mahony J et al. (2004). Randomized, controlled trial of doxycycline and rifampin for patients with Alzheimer's disease. J Am Geriatr Soc 52: 381–387. [DOI] [PubMed] [Google Scholar]
- Módis K, Coletta C, Erdélyi K, Papapetropoulos A, Szabo C (2013). Intramitochondrial hydrogen sulfide production by 3‐mercaptopyruvate sulfurtransferase maintains mitochondrial electron flow and supports cellular bioenergetics. FASEB J 27: 601–611. [DOI] [PubMed] [Google Scholar]
- Morrison B 3rd, Elkin BS, Dollé JP, Yarmush ML (2011). In vitro models of traumatic brain injury. Annu Rev Biomed Eng 13: 91–126. [DOI] [PubMed] [Google Scholar]
- Morrison SJ (2011). Neuronal differentiation: proneural genes inhibit gliogenesis. Curr Biol 11: R349–R351. [DOI] [PubMed] [Google Scholar]
- Muramoto M, Yamazaki T, Nishimura S, Kita Y (2003). Detailed in vitro pharmacological analysis of FK506‐induced neuroprotection. Neuropharmacology 45: 394–403. [DOI] [PubMed] [Google Scholar]
- Nicholas D, Tang H, Zhang Q, Rudra J, Xu F, Langridge W et al. (2015). Quantitative proteomics reveals a role for epigenetic reprogramming during human monocyte differentiation. Mol Cell Proteomics 14: 15–29. [DOI] [PMC free article] [PubMed] [Google Scholar]
- Olsen JV, Schwartz JC, Griep‐Raming J, Nielsen ML, Damoc E, Denisov E et al. (2004). Dual pressure linear ion trap Orbitrap instrument with very high sequencing speed. Mol Cell Proteomics 8: 2759–2769. [DOI] [PMC free article] [PubMed] [Google Scholar]
- Park IH, Yeum CE, Chae GT, Lee SB (2008). Effect of rifampicin to inhibit rapamycin‐induced autophagy via the suppression of protein phosphatase 2 A activity. Immunopharmacol Immunotoxicol 30: 837–849. [DOI] [PubMed] [Google Scholar]
- Pearn ML, Niesman IR, Egawa J, Sawada A, Almenar‐Queralt A, Shah SB et al. (2016). Pathophysiology associated with traumatic brain injury: current treatments and potential novel therapeutics. Cell Mol Neurobiol [Epub ahead of print]. [DOI] [PMC free article] [PubMed] [Google Scholar]
- Peeters W, van den Brande R, Polinder S, Brazinova A, Steyerberg EW, Lingsma HF et al. (2015). Epidemiology of traumatic brain injury in Europe. Acta Neurochir 157: 1683–1696. [DOI] [PMC free article] [PubMed] [Google Scholar]
- Rodrigues CM, Stieers CL, Keene CD, Ma X, Kren BT, Low WC et al. (2000). Tauroursodeoxycholic acid partially prevents apoptosis induced by 3‐nitropropionic acid: evidence for a mitochondrial pathway independent of the permeability transition. J Neurochem 75: 2368–2379. [DOI] [PubMed] [Google Scholar]
- Skotak M, Wang F, Chandra N (2012). An in vitro injury model for SH‐SY5Y neuroblastoma cells: effect of strain and strain rate. J Neurosci Meth 205: 159–168. [DOI] [PubMed] [Google Scholar]
- Smeda JS, Daneshtalab N (2011). The effects of poststroke captopril and losartan treatment on cerebral blood flow autoregulation in SHRsp with hemorrhagic stroke. J Cereb Blood Flow Metab 31: 476–485. [DOI] [PMC free article] [PubMed] [Google Scholar]
- Smith PK, Krohn RI, Hermanson GT, Mallia AK, Gartner FH, Provenzano MD et al. (1985). Measurement of protein using bicinchoninic acid. Anal Biochem 150: 76–85. [DOI] [PubMed] [Google Scholar]
- Southan C, Sharman JL, Benson HE, Faccenda E, Pawson AJ, Alexander SPH et al. (2016). The IUPHAR/BPS Guide to PHARMACOLOGY in 2016: towards curated quantitative interactions between 1300 protein targets and 6000 ligands. Nucl Acids Res 44 (Database Issue): D1054–D1068. [DOI] [PMC free article] [PubMed] [Google Scholar]
- Szabo C (2005). Mechanisms of cell necrosis. Crit Care Med 33 (12 Suppl): S530–S534. [DOI] [PubMed] [Google Scholar]
- Tang K, Peng G, Qiao Y, Song L, Jing N (2015). Intrinsic regulations in neural fate commitment. Dev Growth Differ 57: 109–120. [DOI] [PubMed] [Google Scholar]
- Te Brake L, Dian S, Ganiem AR, Ruesen C, Burger D, Donders R et al. (2015). Pharmacokinetic/pharmacodynamic analysis of an intensified regimen containing rifampicin and moxifloxacin for tuberculous meningitis. Int J Antimicrob Agents 45: 496–503. [DOI] [PubMed] [Google Scholar]
- Tomiyama T, Shoji A, Kataoka K, Suwa Y, Asano S, Kaneko H et al. (1996). Inhibition of amyloid beta protein aggregation and neurotoxicity by rifampicin. Its possible function as a hydroxyl radical scavenger. J Biol Chem 271: 6839–6844. [DOI] [PubMed] [Google Scholar]
- Tyndale RF, Hales TG, Olsen RW, Tobin AJ (1994). Distinctive patterns of GABAA receptor subunit mRNAs in 13 cell lines. J Neurosci 14: 5417–5428. [DOI] [PMC free article] [PubMed] [Google Scholar]
- Wang E, Gao J, Yang Q, Parsley MO, Dunn TJ, Zhang L et al. (2012). Molecular mechanisms underlying effects of neural stem cells against traumatic axonal injury. J Neurotrauma 29: 295–312. [DOI] [PubMed] [Google Scholar]
- Wang N, Xu M, Wang P, Li L (2010). Development of mass spectrometry‐based shotgun method for proteome analysis of 500 to 5000 cancer cells. Anal Chem 82: 2262–2271. [DOI] [PubMed] [Google Scholar]
- Wasil M, Halliwell B, Moorhouse CP (1988). Scavenging of hypochlorous acid by tetracycline, rifampicin and some other antibiotics: a possible antioxidant action of rifampicin and tetracycline? Biochem Pharmacol 37: 775–778. [DOI] [PubMed] [Google Scholar]
- Werner C, Hoffman WE, Kochs E, Rabito SF, Miletich DJ (1991). Captopril improves neurologic outcome from incomplete cerebral ischemia in rats. Stroke 22: 910–914. [DOI] [PubMed] [Google Scholar]
- White LA, Keane RW, Whittemore SR (1994). Differentiation of an immortalized CNS neuronal cell line decreases their susceptibility to cytotoxic T cell lysis in vitro . J Neuroimmunol 49: 135–143. [DOI] [PubMed] [Google Scholar]
- Whittemore SR, White LA (1993). Target regulation of neuronal differentiation in a temperature‐sensitive cell line derived from medullary raphe. Brain Res 615: 27–40. [DOI] [PubMed] [Google Scholar]
- Wu P, Tarasenko YI, Gu Y, Huang LY, Coggeshall RE, Yu Y (2002). Region‐specific generation of cholinergic neurons from fetal human neural stem cells grafted in adult rat. Nat Neurosci 5: 1271–1278. [DOI] [PubMed] [Google Scholar]
- Yerramasetti R, Gollapudi S, Gupta S (2002). Rifampicin inhibits CD95‐mediated apoptosis of Jurkat T cells via glucocorticoid receptors by modifying the expression of molecules regulating apoptosis. J Clin Immunol 22: 37–47. [DOI] [PubMed] [Google Scholar]
- Yuan L, Hassan BA (2014). Neurogenins in brain development and disease: an overview. Arch Biochem Biophys 558: 10–13. [DOI] [PubMed] [Google Scholar]
- Yulug B, Hanoglu L, Kilic E, Schabitz WR (2014). Rifampicin: an antibiotic with brain protective function. Brain Res Bull 107: 37–42. [DOI] [PubMed] [Google Scholar]
- Yulug B, Kilic U, Kilic E, Bähr M (2004). Rifampicin attenuates brain damage in focal ischemia. Brain Res 996: 76–80. [DOI] [PubMed] [Google Scholar]
Associated Data
This section collects any data citations, data availability statements, or supplementary materials included in this article.
Supplementary Materials
Figure S1 Mechanism of rifampicin‐conferred neuroprotection may involve a partial anti‐oxidant action, but is unlikely to be related to inhibition of PP2A activity. A: Cell death (assessed by LDH release) in differentiated B35 cells subjected to the in vitro TBI model after pretreatment with various concentrations of okadaic acid, a commonly used PP2A inhibitor. Okadaic acid (0.3–30 nM) did not affect LDH release, either in a 30min pre‐treatment or in a 3 h post‐treatment. B: LDH release due to severe oxidative stress (500 μM H2O2, 24 h) was significantly reduced by rifampicin pretreatment, suggesting an anti‐oxidant mode of action. Data are shown as mean ± SEM, n = 5.
Supporting info item
Supporting info item
Supporting info item