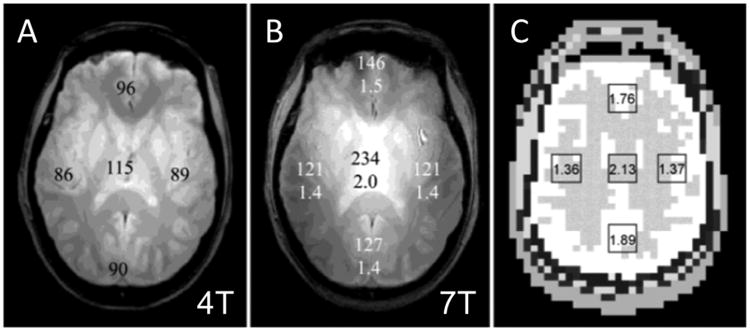
Fig. 5.

SNR measurements from fully relaxed gradient echo images acquired using the same acquisition parameters and homogeneous TEM volume coils of identical dimensions at 4 T (A), and at 7 T (B). Averaged, regional SNR values are shown on the images. Average 7 T/4 T SNR ratios are listed beneath the SNR data on the 7 T image. (C) shows a figure from Maxwell model with calculated 7 T/4 T SNR ratios, which are consistent with experimental data.
