Abstract
Ganoderma lingzhi (G. lingzhi), G. sinense, G. applanatum, etc. belongs to the Ganoderma genus of polypore mushrooms which contain rich polysaccharides valuable for nutrition and positive medicinal effects. In order to evaluate polysaccharide content in Ganoderma mycelia obtained in the fermentation process quickly and accurately, in this work we employed infrared spectroscopy to examine different Ganoderma stains of samples from diversified sources. Through mid-infrared (mid-IR) spectroscopy, we could identify the most relevant spectral bands required for polysaccharide evaluation, and through near-infrared (NIR) spectroscopy, we could establish the quantification model for making satisfactory prediction of polysaccharide ingredient content. As such, we have achieved an effective and convenient approach to quantitative assessment of the total polysaccharides in Ganoderma mycelia but also demonstrated that infrared spectroscopy can be a powerful tool for quality control of Ganoderma polysaccharides obtained from industrial production.
Introduction
G. lingzhi, G. sinense, G. applanatum, etc. belongs to the genus Ganoderma which has been adopted as traditional Chinese herbal medicine in China since ancient times1,2. Nowadays, researchers have proved that G. lingzhi and other Ganoderma species such as G. sinense, G. applanatum, etc. possess encouraging medical curing effects on hepatopathy, chronic hepatitis, nephritis, hypertension, arthritis, neurasthenia, insomnia, bronchitis, asthma, and gastric ulcers3,4.
The major pharmacological ingredients of mushrooms in the Ganoderma genus include Ganoderma polysaccharides and ganoderic acids, and in particular, it has been reported that Ganoderma polysaccharides have some special functions such as therapeutic effects on cancer5–7, obesity8,9, diabetes10,11, and pancreatitis12; as well as pharmaceutical activity on immune modulation13–17, liver protection4,18,19, and vascular endothelial cell growth inhibition20,21. Especially, it has been reported that β-glucans in Ganoderma are closely related to health, for they can stimulate the immune response through cytotoxic or immunomodulatory mechanisms to enhance cellular immunity, and stimulate a variety of immune cells including macrophages22–24, neutrophils25,26, natural killer cells27,28 and dendritic cells29,30. In fact, Ganoderma polysaccharides extracted from mycelia and spores are used as prescription drugs in China by many pharmaceutical factories and companies.
Conventionally, polysaccharides can be examined through biochemical approaches such as the phenol–sulphuric acid method or anthrone–sulphuric acid method31. However, these methods normally require deleterious substances such as phenol, anthrone, and sulfuric acid32. In order to achieve a more convenient approach to quantitative assessment of polysaccharides in Ganoderma mycelia, non-destructive spectroscopic approaches including infrared spectroscopy thus become especially attractive for their outstanding advantages in cost, efficiency, sample preparation and instrument operation. In fact, infrared spectroscopy (including both mid-infrared and near-infrared spectroscopy) is widely used today in the agriculture33,34 and pharmaceutical industry35,36, and shows great potential for the application in food processing industry as well37,38.
In this context, therefore, we intended to employ infrared spectroscopy to assess polysaccharides in mycelia of different Ganoderma strains produced in the fermentation process. Although some previous studies have reported the application of both mid-IR- and NIR- spectroscopy in analysis of Ganoderma polysaccharides31,39, there are still some problems yet to be solved for practical applications. For example, in the industrial production of Ganoderma polysaccharides, it is standard to produce Ganoderma mycelia through liquid fermentation, but there is neither a report for analysis of Ganoderma mycelia through mid-infrared (mid-IR) spectroscopy, nor a report of suitable near-infrared (NIR) quantification, that is valid for the assessment of polysaccharides in Ganoderma mycelia produced during the fermentation process. Therefore, in this work, we intended to combine both mid-IR and NIR techniques so that we could not only qualitatively analyze the samples based on mid-IR spectral data, but also quantitatively evaluate the polysaccharides in Ganoderma mycelia based on the optimized NIR quantification model.
Results
Analysis of Ganoderma mycelia via mid-IR spectroscopy
Mid-IR and NIR are both forms of electromagnetic radiation with wavelengths longer than visible light. The wavelength of mid-IR is between 4000–400 cm−1 (2.5–25 μm), while the wavelength of NIR with is between 14,000–4000 cm−1 (0.8–2.5 μm)40. The absorption of mid-IR involves transitions between vibrational energy states and rotational sub-states of the molecule which can thus be employed for the elucidation molecular structure40,41. A typical mid-IR spectrum of G. lingzhi mycelia is showed in Fig. 1, where the characteristic bands are shown with their assignments given in Table 1. The bands assigned to carbohydrates include the following: the bands at 1425 cm−1 42, 1316 cm−1 43, 1152 cm−1 44, 1078 cm−1 45, 1025 cm−1 46,47, and 951 cm−1 47,48.
Figure 1.
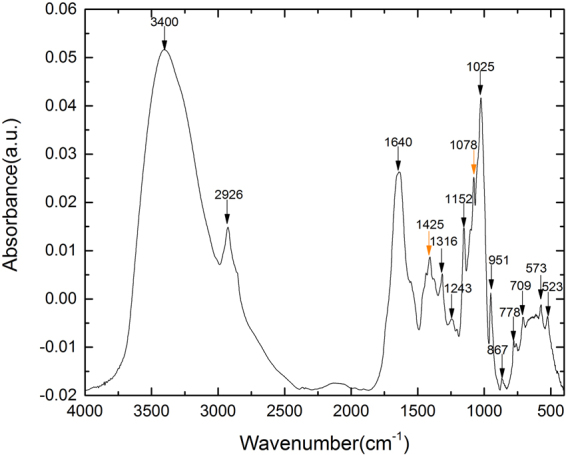
The mid-IR spectra of G. lingzhi mycelium dried powder.
Table 1.
Assignments of the characteristic mid-IR bands in the mid-IR spectrum of G. lingzhi mycelium.
| Wavenumber(cm−1) | Functional Group Assignments |
|---|---|
| 3400 | -OH stretching55 |
| 2926 | CH2 asymmetric stretching56 |
| 1640 | Amide I56 |
| 1457 | CH2 in polysaccharides57 |
| 1425 | C-H deformation in lignin and carbohydrates15 |
| 1372 | C-H in-plane bending vibration58,59 |
| 1314–1316 | symmetric CH2 bending of cellulose43 |
| 1243 | COH in-plane bending/CH in-plane bending58 |
| 1152–1156 | C-O-C asymmetric stretching of glycosidic linkage44 |
| 1078 | C-O stretching of β-glucans45,46,51 |
| 1044 | stretching vibration of C-O-C group60 |
| 1025 | stretching vibration of C-O α-glycosidic bond47 |
| 951 | β-glycosidic bond47; C-O and C-C stretching48 |
| 867 | γ (C-H)61; furanose ring62 |
| 778 | COO− deformation63 |
| 709 | CH out-of plane bending64 |
| 573 | bending vibration of a polysaccharide ring39 |
| 523 | pyranose ring62; C=O asymmetric deformation65 |
In addition, we also measured and analyzed different Ganoderma samples obtained in different stages during polysaccharide extraction process, with their mid-IR spectra shown in Fig. 2. From the spectrum, we can identify the characteristic bands attributed to carbohydrates, and we notice especially that the relative intensities of the bands at 1425 cm−1 and 1078 cm−1 are stronger for the samples with high content of polysaccharide after the extraction procedure.
Figure 2.
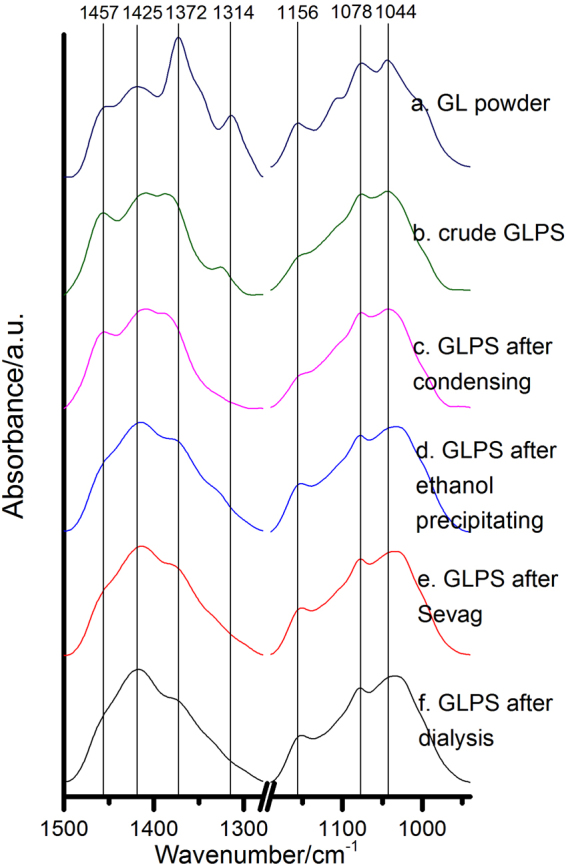
The mid-IR spectra of different samples obtained from the G. lingzhi polysaccharide extraction process. (a) GL powder refers to the drying powder from wet G. lingzhi culture mycelia; (b) crude GLPS refers to the extracted crude polysaccharide sample from the dried powder in 70 °C of hot water; (c) GLPS after condensing refers to the condensing supernatant sample using rotary vacuum approach; (d) GLPS after ethanol precipitating refers to the condensed remnant sample after ethanol precipitating process; (e) GLPS after Sevag refers to the sample with proteins removed with the by Sevag method; and (f)GLPS after dialysis refers to the sample which removed small molecular impurity substances after dialyzing process.
Assessment of polysaccharide in Ganoderma mycelia by NIR spectroscopy
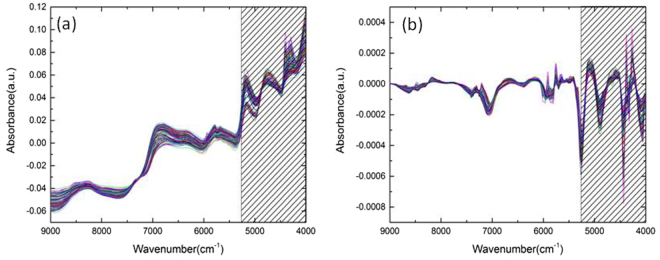
In addition, we employed the NIR spectroscopy for the quantification of the polysaccharide content in Ganoderma mycelia. Generally, NIR spectroscopy measures the broad overtone and combination bands of some of the fundamental vibrations and can be an excellent technique for rapid and quantitative evaluation of many chemicals40. Figure 3a shows the NIR spectra in the 9000–4000 cm−1 region, and the corresponding first derivative spectra are shown in Fig. 3b. The absorption peaks at 8403 cm−1, 6896 cm−1, 5155 cm−1 are attributed to water49, while the bands at 4307 cm−1, 4405 cm−1, 5787 cm−1, and 5935 cm−1 are ascribed to carbohydrate. The NIR spectral band assignments are listed in Table 2.
Figure 3.
NIR spectra of Ganoderma mycelia with showing the selection of spectral range of 5268.8–4000 cm−1 for the optimal quantification assessment. (a) The conventional NIR spectra of Ganoderma mycelia; (b) The first derivative spectra of the corresponding NIR spectra.
Table 2.
Assignments of the NIR absorption bands.
| Wavenumber (cm−1) | Type | Feature(s) |
|---|---|---|
| 8403 | combination of the first overtone of the O–H stretching and the OH-bending band (2ν1,3 + ν2) | Water66 |
| 6896 | first overtone of the OH-stretching band (2ν1,3) | Water66 |
| 6674 | first overtone of the OH-stretching band | alcohol or water66 |
| 6307 | first overtone of the OH-stretching band | alcohol or water66 |
| 5935 | C–H stretching first overtone | Lignin67, hemicelluloses67,68 |
| 5787 | C–H stretching (1st overtone) of –CH2 | Carbohydrates69 |
| 5155 | combination of stretching and deformation of the O-H group in water | Water70 |
| 4719 | O-H and C-O stretching combination | Polysaccharide71 |
| 4405 | O-H stretching and C-O stretching combination | Polysaccharides72 |
| 4307 | C-H stretching and C-H2 deformation combination | Polysaccharides66 |
| 4021 | C-H stretching and C-C stretching combination | Cellulose66 |
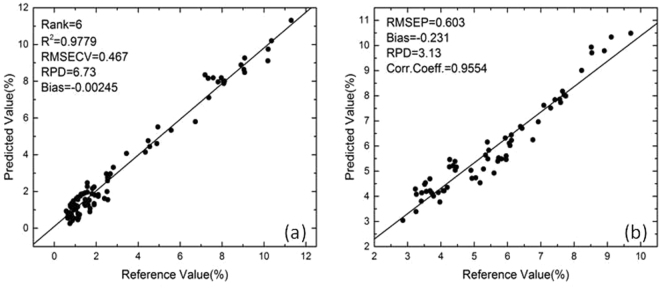
To establish an optimal quantification model for polysaccharide assessment, we employed the methods of moving window partial least-squares (mwPLS) and interval PLS (iPLS) to find the appropriate spectral range for NIR quantification model. The mwPLS analysis (Figure S1a) shows that in the range of (5268.8–4000 cm−1) the relative low root mean square error of cross validation (RMSECV) values are relatively low, and the iPLS analysis (Figure S1b) gives rise to the same consistent result. Accordingly, we took this range (5268.8–4000 cm−1) and applied the constant offset elimination pre-treatment method for construction of the optimal quantification model. Our result shows that the optimal spectral range for Ganoderma mycelia is between 5268.8–4000 cm−1, and the pre-treatment method is constant offset elimination (the comparisons using other different pre-treatment methods are given in the supplementary part Table S1). For the calibration set, we achieved determination coefficient (R2) = 0.9779, RMSECV = 0.467, RPD = 6.73 at rank = 6, and for the prediction set we obtained root mean square error of prediction (RMSEP) = 0.603, relative percent deviation (RPD) = 3.13, correlation coefficient (corr. coeff.) = 0.9554. The calibration and prediction results are showed in Fig. 4. To check the model efficiency, the plot of RMSECV vs. Rank is also depicted and exhibits a smooth descent line (Figure S2).
Figure 4.
The NIR-based quantitative model for the polysaccharides on the range of (5268.8–4000 cm−1) of calibration set (a) and prediction set (b).
Discussion
Qualitative analysis of Ganoderma mycelia based on mid-IR and NIR spectroscopy
In the foregoing sections, we have observed and identified the bands at 1425 cm−1 and 1078 cm−1 which are assigned to Ganoderma polysaccharides. These two bands are actually the most distinctive polysaccharide bands for our Ganoderma mycelia specimens. To confirm this, we measured the samples of high-content-polysaccharide (HCP) and low-content-polysaccharide (LCP) G. lingzhi strains, respectively, with the comparison of their mid-IR and NIR spectra as shown in Figs 5 and 6, respectively. We can see the prominent difference in intensity for the peaks at 1425 cm−1 and 1078 cm−1, and correspondingly, we can also identify the most relevant polysaccharide bands in NIR spectra at 4307 cm−1, 4405 cm−1. These mid-IR and NIR bands are actually most useful for polysaccharide detection and quantification.
Figure 5.
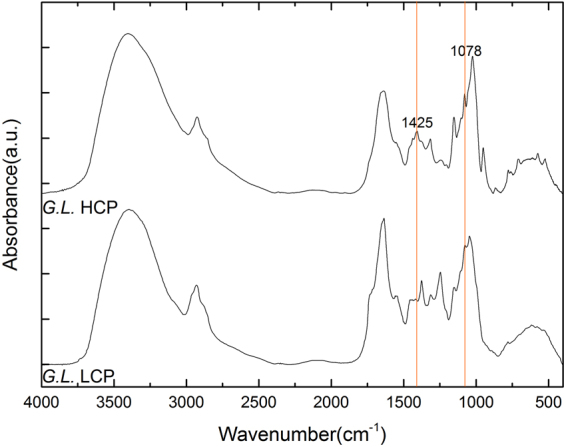
The mid-IR spectra of HCP and LCP G. lingzhi mycelia. HCP: high content of polysaccharide; LCP: low content of polysaccharide.
Figure 6.
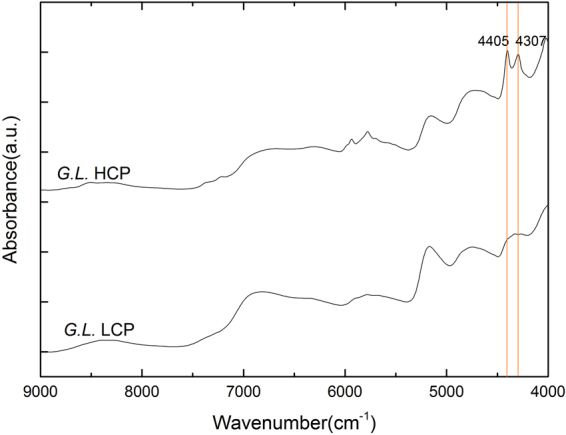
The NIR spectra of both HCP and LCP G. lingzhi mycelia, showing the most critical characteristic bands for assessment of polysaccharides.
Furthermore, for the NIR analysis, we obtained the correlation coefficient curves based on the NIR spectra, and confirmed that the larger correlation coefficients also occur at these NIR spectral peak positions (Fig. 7).
Figure 7.
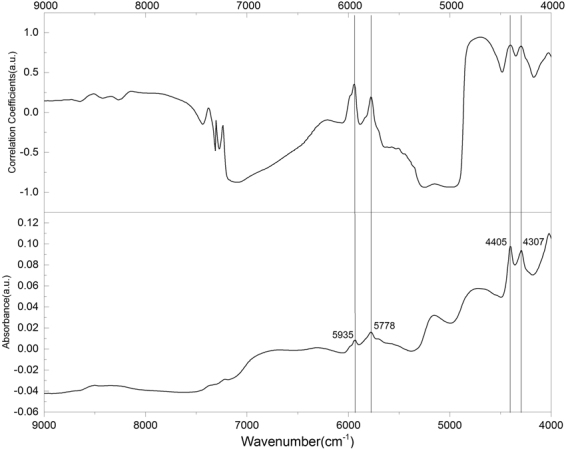
Correlation coefficients of the chemical measurements with the comparison with NIR spectra.
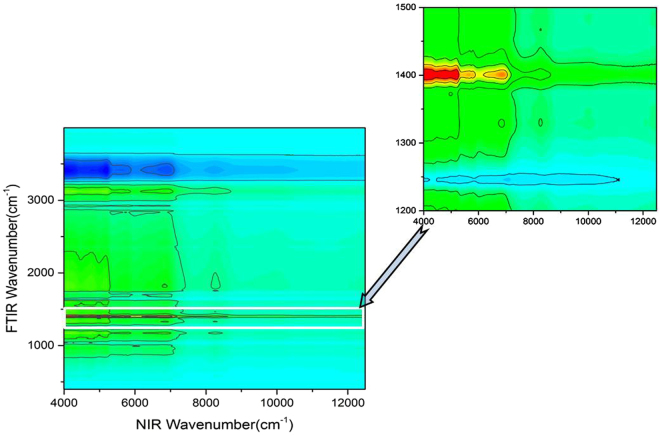
These peaks are just assigned to polysaccharides (see the NIR band assignments listed in Table 1), and for this reason, our quantification model therefore covers the spectral range of 5268.8–4000 cm−1 including the prominent bands at 4307 and 4405 cm−1, which are closely related to their mid-IR counterparts, namely, the bands at 1425 cm−1 and 1078 cm−1. These two mid-IR bands are actually corresponding to the C-H bending and C-O-H bending from pyranose ring of glucan, respectively, which exist widely in different kinds of mushrooms50. More specifically, the characteristic mid-IR peak 1078 cm−1 is assigned to the C-O stretching in β-glucans of lignin and carbohydrates51, which is related with 4405 cm−1 in NIR spectra for it stems from O-H stretching and C-O stretching combination. The 1425 cm−1 peak corresponds to C-H deformation in lignin and carbohydrates42 and it is related with the 4307 cm−1 band in the NIR spectrum for it stems from C-H stretching and C-H2 deformation combination. To further verify this, we also checked the relationship between the NIR spectra and the mid-IR spectra of Ganoderma mycelia based on a two-dimensional correlation spectroscopy of mid-IR and NIR spectra, as shown in Fig. 8. The result unambiguously confirms that the NIR range (5268.8–4000 cm−1) is most related to the mid-IR (1422–1376 cm−1) range which is mainly ascribed to polysaccharide in different Ganoderma stains.
Figure 8.
Correlation spectroscopy of NIR and mid-IR spectra of Ganoderma mycelia, showing that the NIR spectral range (5268–4000 cm−1) is most related to the mid-IR spectral range (1422–1376 cm−1).
To be noted, however, although quantification of total polysaccharide content is important for quality control of batch consistency, the total polysaccharide content is not necessarily correlated to health effect directly. As mentioned above, the medicinal value of Ganoderma mycelium is closely related to its β-glucans. Fortunately, one of the two selected peaks concerned in this work, namely the peak at 1078 cm−1 in FTIR (corresponding to NIR signal at 4405 cm−1) is just the characteristic for β-glycosides. Therefore, while our NIR quantification model assisted by FTIR spectral analysis is valid for the assessment of total polysaccharide content, it may also be useful for a rough evaluation of β-glucans.
Comparison of our model with other quantification models
Considering the difference between mycelium and fruiting body of Ganoderma genus, it is understandable that our NIR quantification model is different from other previous models which contain broader spectral range. Although our NIR quantification model requires smaller spectral range, it actually gives rise to better prediction performance for providing larger range of polysaccharide values in the assessment.
It seems that it might be better to include bands such as 5787 and 5935 cm−1 bands in the quantification model as they also show relatively large correlation coefficients in Fig. 7. To check this, we chose the spectral range 6048–4000 cm−1 for comparison. The analysis of quantitative models for polysaccharides based on the NIR spectral range of (6048–4000 cm−1) for calibration set and prediction set are shown in Figures S2 and S3. We noticed that it requires higher rank for the assessment (results listed in Table S2). Actually, when we just took the two bands at 4307 and 4405 cm−1 in the construction of the quantification model, we obtained R2 = 0.8505 and RPR = 2.59 for rank = 6 (Table S2). But if we took the other two bands at 5935 and 5787 cm−1 into account, R2 became smaller (R2 = 0.8227) for rank = 6 (Table S2), with smaller RPD 2.37. So the efficiency or accuracy of the quantification model became worse. The reason may be understood with the following: First, we noticed that for the NIR spectra of Ganoderma fruiting body sample with high content of starch and cellulose, although the 4307 and 4405 cm−1 bands are prominent in all the three spectra, the 5787 and 5935 cm−1 bands are diminished in the spectra of cellulose and starch (Figure S4). Second, if we compare the spectrum of Ganoderma mycelium with that of Ganoderma fruiting body, we will find their NIR spectra are also really quite different (Figure S5). In Ganoderma fruiting body, the NIR signals are so weak for the 4307, 4405, 5787 and 5935 cm−1 bands that they are almost invisible in the NIR spectra. Moreover, the spectral shapes are also very different. We explain that such a big difference in spectral features may be due to two factors. First, the compositional structure of mycelium and fruiting body is different. Ganoderma fruiting body has a very thick and hard crust consisting of high content of cellulose and lignin, whereas Ganoderma mycelium has neither cellulose nor lignin (or the contents of cellulose and lignin are almost negligible in Ganoderma mycelium). Second, the polysaccharide content between mycelia and fruiting bodies is also significantly different. As reported by Chen et al.31, the highest content of polysaccharides is about 8.07%. But in our mycelium samples, the content of polysaccharide is normally higher (up to 11.31%).
In summary, we have established an effective approach to polysaccharide content evaluation for Ganoderma mycelium samples, in which we utilized mid-infrared spectroscopy for qualitative analysis and NIR spectroscopy for quantitative assessment. The optimized model contains the region of (5268.8–4000 cm−1) and with proper pre-treatment it can give rise to satisfactory prediction performance with the Rank = 6, R2 = 0.9779, RMSECV = 0.467, RPD = 6.73 in the calibration set, and RMSEP = 0.603, RPD = 3.13, corr. coeff. = 0.9554 for the prediction set. This work therefore not only achieved an effective approach for establishment of a satisfactory quantification model for polysaccharide assessment in Ganoderma mycelia, but also set a good example of practical application of NIR spectroscopy in the assessment of Ganoderma polysaccharides in industrial production.
Methods
Materials
The G. lingzhi strain 5.0026 was purchased from China General Microbiological Culture Collection Center (CGMCC), while some other Ganoderma strains were collected in 10 different provinces in China including Anhui, Shandong and Sichuan, etc.
In order to make the range of the experimental samples with polysaccharide contents wide enough, 51 in vitro axenic preservation Ganoderma strains were purchased, exchanged or isolated from wild fruiting bodies. Among them, 38 stains were G. lingzhi, 7 stains were G.applanatum, 3 stains were G.sinense, 2 stains were G.resinaceum, and 1 stain was G.leucocontextum. Taking into account of the changes in polysaccharide content of mycelia at different fermentation stages, each strain was cultured for 7 days, 14 days and 21 days, respectively. On the 7th day, most mycelia were in the logarithmic growth phase, and they grew very fast; on the 14th day, most culture flasks were filled with mycelia; on the 21st day, all flasks were full of mycelia, and a few strains started to form its fruiting body. All the 153 mycelium samples were washed with ddH2O for three times, placed into petri dishes at −60 °C for 48 hours to freeze for drying (FD-1D-50, Bilon, China). All these strains were randomly selected into calibration (90 samples) and validation sets (63 samples).
All the Ganoderma strains were activated in PDA solid medium and then transferred into Potato Dextrose Broth for 7 days, 14 days and 21 days, respectively. For the mid-IR measurements, the mycelia were lyophilized and pulverized into powders for future testing.
Sample grouping and polysaccharide contents (reference and predicated value) were shown in the Table S3. Many of the mycelia were morphologically different in terms of size, color, and viscous degree of the culture solution with some samples demonstrated in Figure S6.
Extraction and purification of Ganoderma polysaccharides
140 g fermented Ganoderma mycelia dried powder, with adding 7 L ddH2O, was placed into 70 °C hot water bath for 2 hours for the polysaccharide extraction. The extract liquid was then taken into centrifuge tubes, centrifuged at 4400 rcf/g for 10 min (3K15, Sigma Laborzentrifugen, Germany), kept at 20 °C for 15 min, and then the mycelia precipitate was separated from the crude water-soluble polysaccharide supernatant. The supernatant was then concentrated in a rotary evaporator under reduced pressure at 60 °C to get 850 ml of vacuum-concentrated liquid. The concentrated extract solution was precipitated with 3.4 L ethanol and kept at 4 °C overnight. The precipitate was obtained by centrifugation at 4400 rcf/g for 15 min, and then dried at 45 °C for 2 hours, giving the crude polysaccharides. The crude polysaccharide was then re-dissolved with 800 ml ddH2O. 500 ml of the re-dissolved polysaccharide was treated with Sevag reagent (1:4 n-butanol: chloroform, v/v, 120 ml) to remove the proteins inside the solution39. The mixture was violently oscillated for 30 min and centrifugated to remove the denatured proteins at the interface between water layer and Sevag reagent layer. The above operation was repeated until no denatured proteins appeared. In order to decolor the solution, 1.5%(v/v) activated charcoal was added to the Sevag-treated crude polysaccharide, with thermostatic water bathing for 40 minutes, then the polysaccharide solution was poured into a dialysis bag, with both ends tightened up, and placed into ddH2O. The water was changed every 4 hours, until the color of the dialysate did not change.
Preparation of freeze-dried polysaccharide samples from Ganoderma genus
Each liquid sample obtained from the steps mentioned above was pipetted and placed into petri dishes at −60 °C for 48 hours to freeze for drying (FD-1D-50, Bilon, China). So we obtained the following samples: a. The GL powder means the drying powder from wet Ganoderma culture mycelia. b. The crude GLPS means the extracted crude polysaccharide from the dried powder in 70 °C of hot water. c. The GLPS after condensing is the condensing supernatant using rotary vacuum approach. d. The GLPS after ethanol precipitating means the condensed remnant after ethanol precipitating process. e. The GLPS after Sevag means the polysaccharides removing proteins with the by Sevag method. f. The GLPS after dialysis means the polysaccharide samples which remove small molecular impurity substances after dialyzing operation. These samples were then examined by infrared spectroscopy.
Measurement of polysaccharides in dried mycelia of different Ganoderma stains
2 ml of 0.012, 0.024, 0.036, 0.048, 0.06, 0.072, and 0.084 mg/ml glucose solutions were prepared, respectively. Then, 6 ml of anthrone reagent was added to each glucose solution and the solution was first kept at room temperature for 15 minutes, and then stored on ice for 15 minutes. When the test tubes were cooled and 3 ml of each sample was read at 625 nm wavelength using UV–vis spectrophotometer (Shimadzu UV-2550, Japan). The spectrum value at 625 nm was recorded for analysis. A standard curve for total carbohydrate assay was generated. The determination coefficient (R2) of glucose standard curve is 0.9903, with the standard error less than 0.00152.
0.1 g of the lyophilisated sample was mixed with 10 ml ddH2O, and placed steady for 1 h. After that, the mixture was placed in 70 °C hot water bath for 2 hours, centrifugated after cooling, and the precipitate was discarded. The supernatant was diluted 20 times and 2 ml sample solution was pipette into a test tube for measurement. 6 ml sulfuric acid solution was added into the test tube and mixed with the sample together. The mixed sample was measured at 625 nm using the UV–Vis spectrophotometer. The content of polysaccharide was then calculated referring to standard curve above (g glucose/100 g sample). And the Ganoderma polysaccharide content was used as reference value for the quantification model52.
Measurements of mid-IR spectra
The samples for mid-IR measurement were prepared by mixing 2 mg of freeze-dried Ganoderma mycelia samples with 200 mg of dried potassium bromide followed by pressing under pressure 15 MPa for 3 minutes to make a disk pellet. The samples were then subjected to mid-IR measurements, and the spectral range (4000–400 cm−1) was recorded using a Bruker ALPHA-T instrument (Bruker Optics GmbH, Ettlingen, Germany) with a resolution of 4 cm−1 and 64 scans per sample. The results were then analyzed using OPUS 7.0 data processing software.
Measurement of NIR spectra
A FT-NIR spectrometer (NIR MPA, Bruker Optik GmbH, Germany) was used to collect the diffuse reflection spectra, with a resolution of 16 cm−1 and 32 scans per sample ranged from 12500–4000 cm−1. Each sample was tested several times for the average. These results were then analyzed by OPUS 7.0 data processing software.
Data analysis
Both NIR and mid-IR spectral data were analyzed using OPUS software (Bruker Optik GmbH, Ettlingen, Germany). Before the spectral data analysis, all the spectra were pre-treated using the procedures of vector normalization and baseline correction. After the spectra were collected, the spectra were exported from OPUS software and imported directly into program IBM SPSS Statistics 19 (SPSS) for cluster analysis, and OriginPro 2016 software (OriginLab Corporation, Northampton, Massachusetts, USA.) for figure graphing.
The data analysis methods including moving window partial least squares (mwPLS), interval partial least squares (iPLS) and correlation coefficient were conducted using iToolbox (programmed by Prof. L. Nørgaard,KVL, Denmark, published on http://www.models.kvl.dk/iToolbox)) on Matlab2012b® 53,54. Both mwPLS and iPLS are the efficient algorithms used to optimize the spectral range for a quantification model: mwPLS builds a series of PLS models in a window that moves over the whole spectral region and then locates useful spectral intervals in terms of the least complexity of PLS models reaching a desired error level53,54, while iPLS is an interactive extension to PLS which develops local PLS models on equidistant subintervals of the full-spectrum region and focuses on important spectral regions and removing interferences from other regions50.
Electronic supplementary material
Acknowledgements
This work was supported by the National Natural Science Foundation of China (No. 11475217, No. 11775272 and No. 11635013) and the Strategic Priority Research Program of the Chinese Academy of Sciences (No. XDA08040107). We would like to thank Prof. YJ Wu group and NSRL at USTC for providing the facilities for a part of spectral measurements. We also thank Bessie Huang for proofreading the manuscript.
Author Contributions
Q.H. conceived the project and supervised the research. Y.H.M. conducted most of the experiments with assistance of H.Q.H. in preparing the samples. Q.H. and Y.H.M. analyzed the spectral data, with other co-authors J.Z.W., H.Q.H., C.Y.W. and K.C. participating in the discussion of the results. Y.H.M. and Q.H. wrote the manuscript.
Competing Interests
The authors declare that they have no competing interests.
Footnotes
Electronic supplementary material
Supplementary information accompanies this paper at 10.1038/s41598-017-18422-7.
Publisher's note: Springer Nature remains neutral with regard to jurisdictional claims in published maps and institutional affiliations.
References
- 1.Paterson RRM, Lima N. Editorial for the special issue on Ganoderma. Phytochemistry. 2015;114:5–6. doi: 10.1016/j.phytochem.2015.04.008. [DOI] [PubMed] [Google Scholar]
- 2.Zhou LW, et al. Global diversity of the Ganoderma lucidum complex (Ganodermataceae, Polyporales) inferred from morphology and multilocus phylogeny. Phytochemistry. 2015;114:7–15. doi: 10.1016/j.phytochem.2014.09.023. [DOI] [PubMed] [Google Scholar]
- 3.Paterson RR. Ganoderma - a therapeutic fungal biofactory. Phytochemistry. 2006;67:1985–2001. doi: 10.1016/j.phytochem.2006.07.004. [DOI] [PubMed] [Google Scholar]
- 4.Zhu KX, et al. A Polysaccharide from Ganoderma atrum Improves Liver Function in Type 2 Diabetic Rats via Antioxidant Action and Short-Chain Fatty Acids Excretion. J Agric Food Chem. 2016;64:1938–1944. doi: 10.1021/acs.jafc.5b06103. [DOI] [PubMed] [Google Scholar]
- 5.Jiang D, et al. Restoration of the tumor-suppressor function to mutant p53 by Ganoderma lucidum polysaccharides in colorectal cancer cells. Oncology Reports. 2017;37:594–600. doi: 10.3892/or.2016.5246. [DOI] [PubMed] [Google Scholar]
- 6.Chan KM, et al. Screening and analysis of potential anti-tumor components from the stipe of Ganoderma sinense using high-performance liquid chromatography/time-of-flight mass spectrometry with multivariate statistical tool. Journal of Chromatography A. 2017;1487:162–167. doi: 10.1016/j.chroma.2017.01.044. [DOI] [PubMed] [Google Scholar]
- 7.Li WJ, et al. Enhancement of Cyclophosphamide-Induced Antitumor Effect by a Novel Polysaccharide from Ganoderma atrum in Sarcoma 180-Bearing Mice. Journal of Agricultural and Food Chemistry. 2011;59:3707–3716. doi: 10.1021/jf1049497. [DOI] [PubMed] [Google Scholar]
- 8.Chang, C. J. et al. Ganoderma lucidum reduces obesity in mice by modulating the composition of the gut microbiota. Nature Communications6, 10.1038/ncomms8489 (2015). [DOI] [PMC free article] [PubMed]
- 9.Delzenne NM, Bindels LB. GUT MICROBIOTA Ganoderma lucidum, a new prebiotic agent to treat obesity? Nature Reviews Gastroenterology & Hepatology. 2015;12:553–554. doi: 10.1038/nrgastro.2015.137. [DOI] [PubMed] [Google Scholar]
- 10.Xiao C, et al. Antidiabetic activity of Ganoderma lucidum polysaccharides F31 down-regulated hepatic glucose regulatory enzymes in diabetic mice. Journal of Ethnopharmacology. 2017;196:47–57. doi: 10.1016/j.jep.2016.11.044. [DOI] [PubMed] [Google Scholar]
- 11.Jung SH, et al. Inhibitory effects of Ganoderma applanatum on rat lens aldose reductase and sorbitol accumulation in streptozotocin-induced diabetic rat tissues. Phytotherapy Research. 2005;19:477–480. doi: 10.1002/ptr.1638. [DOI] [PubMed] [Google Scholar]
- 12.Li KK, et al. Three kinds of Ganoderma lucidum polysaccharides attenuate DDC-induced chronic pancreatitis in mice. Chemico-Biological Interactions. 2016;247:30–38. doi: 10.1016/j.cbi.2016.01.013. [DOI] [PubMed] [Google Scholar]
- 13.Zhang JJ, Gao X, Pan YG, Xu N, Jia L. Toxicology and immunology of Ganoderma lucidum polysaccharides in Kunming mice and Wistar rats. International Journal of Biological Macromolecules. 2016;85:302–310. doi: 10.1016/j.ijbiomac.2015.12.090. [DOI] [PubMed] [Google Scholar]
- 14.Zhao HY, et al. Enteric Mucosal Immune Response might Trigger the Immunomodulation Activity of Ganoderma lucidum Polysaccharide in Mice. Planta Medica. 2010;76:223–227. doi: 10.1055/s-0029-1186055. [DOI] [PubMed] [Google Scholar]
- 15.Zhu XL, Chen AF, Lin ZB. Ganoderma lucidum polysaccharides enhance the function of immunological effector cells in immunosuppressed mice. Journal of Ethnopharmacology. 2007;111:219–226. doi: 10.1016/j.jep.2006.11.013. [DOI] [PubMed] [Google Scholar]
- 16.Yue GGL, et al. Immunomodulatory Activities of Ganoderma sinense Polysaccharides in Human Immune Cells. Nutrition and Cancer-an International Journal. 2013;65:765–774. doi: 10.1080/01635581.2013.788725. [DOI] [PubMed] [Google Scholar]
- 17.Manayi A, Vazirian M, Zade FH, Tehranifard A. Immunomodulation Effect of Aqueous Extract of the Artist’s Conk Medicinal Mushroom, Ganoderma applanatum (Agaricomycetes), on the Rainbow Trout (Oncorhynchus mykiss) International Journal of Medicinal Mushrooms. 2016;18:927–933. doi: 10.1615/IntJMedMushrooms.v18.i10.80. [DOI] [PubMed] [Google Scholar]
- 18.Wang X, et al. Effects of Ganoderma lucidum polysaccharide on CYP2E1, CYP1A2 and CYP3A activities in BCG-immune hepatic injury in rats. Biological & Pharmaceutical Bulletin. 2007;30:1702–1706. doi: 10.1248/bpb.30.1702. [DOI] [PubMed] [Google Scholar]
- 19.Liu YJ, et al. Anti-inflammatory and hepatoprotective effects of Ganoderma lucidum polysaccharides on carbon tetrachloride-induced hepatocyte damage in common carp (Cyprinus carpio L.) International Immunopharmacology. 2015;25:112–120. doi: 10.1016/j.intimp.2015.01.023. [DOI] [PubMed] [Google Scholar]
- 20.Wang SH, et al. Ganoderma lucidum polysaccharides prevent platelet-derived growth factor-stimulated smooth muscle cell proliferation in vitro and neointimal hyperplasia in the endothelial-denuded artery in vivo. Journal of Cellular Physiology. 2012;227:3063–3071. doi: 10.1002/jcp.23053. [DOI] [PubMed] [Google Scholar]
- 21.Cao QZ, Lin ZB. Ganoderma lucidum polysaccharides peptide inhibits the growth of vascular endothelial cell and the induction of VEGF in human lung cancer cell. Life Sciences. 2006;78:1457–1463. doi: 10.1016/j.lfs.2005.07.017. [DOI] [PubMed] [Google Scholar]
- 22.Chan, G. C. F., Chan, W. K. & Sze, D. M. Y. The effects of beta-glucan on human immune and cancer cells. Journal of Hematology & Oncology 2, 10.1186/1756-8722-2-25 (2009). [DOI] [PMC free article] [PubMed]
- 23.Wang CH, et al. Concentration Variation and Molecular Characteristics of Soluble (1,3;1,6)-beta-D-Glucans in Submerged Cultivation Products of Ganoderma lucidum Mycelium. Journal of Agricultural and Food Chemistry. 2014;62:634–641. doi: 10.1021/jf404533b. [DOI] [PubMed] [Google Scholar]
- 24.Javed S, Payne GW, Lee CH. Ganoderma applanatum - potential target for stimulating macrophages in immunosuppressive breast cancer microenvironment. Breast Cancer Research and Treatment. 2016;159:181–181. [Google Scholar]
- 25.Hsu MJ, Lee SS, Lin WW. Polysaccharide purified from Ganoderma lucidum inhibits spontaneous and Fas-mediated apoptosis in human neutrophils through activation of the phosphatidylinositol 3 kinase/Akt signaling pathway. Journal of Leukocyte Biology. 2002;72:207–216. [PubMed] [Google Scholar]
- 26.Hsu MJ, Lee SS, Lee ST, Lin WW. Signaling mechanisms of enhanced neutrophil phagocytosis and chemotaxis by the polysaccharide purified from Ganoderma lucidum. British Journal of Pharmacology. 2003;139:289–298. doi: 10.1038/sj.bjp.0705243. [DOI] [PMC free article] [PubMed] [Google Scholar]
- 27.Wu, Y. S., Ho, S. Y., Nan, F. H. & Chen, S. N. Ganoderma lucidum beta 1,3/1,6 glucan as an immunomodulator in inflammation induced by a high-cholesterol diet. Bmc Complementary and Alternative Medicine16, 10.1186/s12906-016-1476-3 (2016). [DOI] [PMC free article] [PubMed]
- 28.Chen, S. N. et al. The Effect of Mushroom Beta-Glucans from Solid Culture of Ganoderma lucidum on Inhibition of the Primary Tumor Metastasis. Evidence-Based Complementary and Alternative Medicine, 10.1155/2014/252171 (2014). [DOI] [PMC free article] [PubMed]
- 29.Yoshida H, et al. Preferential induction of Th17 cells in vitro and in vivo by Fucogalactan from Ganoderma lucidum (Reishi) Biochemical and Biophysical Research Communications. 2012;422:174–180. doi: 10.1016/j.bbrc.2012.04.135. [DOI] [PubMed] [Google Scholar]
- 30.Han, X. Q. et al. Structure Elucidation and Immunomodulatory Activity of A Beta Glucan from the Fruiting Bodies of Ganoderma Sinense. Plos One9, 10.1371/journal.pone.0100380 (2014). [DOI] [PMC free article] [PubMed]
- 31.Chen Y, et al. Quantification of total polysaccharides and triterpenoids in Ganoderma lucidum and Ganoderma atrum by near infrared spectroscopy and chemometrics. Food Chemistry. 2012;135:268–275. doi: 10.1016/j.foodchem.2012.04.089. [DOI] [Google Scholar]
- 32.Kume S, et al. Relationships between crude protein and mineral concentrations in alfalfa and value of alfalfa silage as a mineral source for periparturient cows. Animal Feed Science and Technology. 2001;93:157–168. doi: 10.1016/S0377-8401(01)00281-4. [DOI] [Google Scholar]
- 33.Tinti, A., Tugnoli, V., Bonora, S. & Francioso, O. Recent applications of vibrational mid-Infrared (IR) spectroscopy for studying soil components: a review. Journal of Central European Agriculture16, 10.5513/jcea.v16i1.3483 (2015).
- 34.Siesler, H. W., Ozaki, Y., Kawata, S. & Heise, H. M. Near-infrared spectroscopy - Principles, instruments, applications. (Wiley-Vch, Inc, 2002).
- 35.Guo T, et al. Fourier transform mid-infrared spectroscopy (FT-MIR) combined with chemometrics for quantitative analysis of dextrin in Danshen (Salvia miltiorrhiza) granule. J Pharm Biomed Anal. 2016;123:16–23. doi: 10.1016/j.jpba.2015.11.021. [DOI] [PubMed] [Google Scholar]
- 36.Jamrogiewicz M. Application of the near-infrared spectroscopy in the pharmaceutical technology. J Pharm Biomed Anal. 2012;66:1–10. doi: 10.1016/j.jpba.2012.03.009. [DOI] [PubMed] [Google Scholar]
- 37.Teixeira dos Santos CA, Lopo M, Pascoa RNMJ, Lopes JA. A Review on the Applications of Portable Near-Infrared Spectrometers in the Agro-Food Industry. Applied Spectroscopy. 2013;67:1215–1233. doi: 10.1366/13-07228. [DOI] [PubMed] [Google Scholar]
- 38.Hell J, et al. A comparison between near-infrared (NIR) and mid-infrared (ATR-FTIR) spectroscopy for the multivariate determination of compositional properties in wheat bran samples. Food Control. 2016;60:365–369. doi: 10.1016/j.foodcont.2015.08.003. [DOI] [Google Scholar]
- 39.Choong YK, et al. Determination of storage stability of the crude extracts of Ganoderma lucidum using FTIR and 2D-IR spectroscopy. Vibrational Spectroscopy. 2011;57:87–96. [Google Scholar]
- 40.Larkin, P. Infrared and Raman spectroscopy: principles and spectral interpretation. (Elsevier, 2011).
- 41.Kacurakova M, Wilson RH. Developments in mid-infrared FT-IR spectroscopy of selected carbohydrates. Carbohydrate Polymers. 2001;44:291–303. doi: 10.1016/S0144-8617(00)00245-9. [DOI] [Google Scholar]
- 42.Naumann A, Navarro-Gonzalez M, Peddireddi S, Kues U, Polle A. Fourier transform infrared microscopy and imaging: detection of fungi in wood. Fungal Genet Biol. 2005;42:829–835. doi: 10.1016/j.fgb.2005.06.003. [DOI] [PubMed] [Google Scholar]
- 43.Ghebreselassie, H. Measuring the hydrophobicity of cellulose and the effect of humidity by inverse gas chromatography. Dissertations & Theses - Gradworks (2013).
- 44.Tangsadthakun C, et al. The influence of molecular weight of chitosan on the physical and biological properties of collagen/chitosan scaffolds. J Biomater Sci Polym Ed. 2007;18:147–163. doi: 10.1163/156856207779116694. [DOI] [PubMed] [Google Scholar]
- 45.Chen X, et al. Distinction of broken cellular wall Ganoderma lucidum spores and G. lucidum spores using FTIR microspectroscopy. Spectrochim Acta A Mol Biomol Spectrosc. 2012;97:667–672. doi: 10.1016/j.saa.2012.07.046. [DOI] [PubMed] [Google Scholar]
- 46.Carrasco H, et al. Eugenol and its synthetic analogues inhibit cell growth of human cancer cells (part I) Journal of the Brazilian Chemical Society. 2008;19:543–548. doi: 10.1590/S0103-50532008000300024. [DOI] [Google Scholar]
- 47.Liu, G. et al. In Ico20: Biomedical OpticsVol. 6026 Proceedings ofSPIE (eds G. V. Bally & Q. Luo) (2006).
- 48.Muresan AE, et al. HPLC Determination and FT-MIR Prediction of Sugars from Juices of Different Apple Cuhivars during FruitDevelopment. Notulae Botanicae Horti Agrobotanici Cluj-Napoca. 2015;43:222–228. doi: 10.15835/nbha.43.1.9879. [DOI] [Google Scholar]
- 49.Buning-Pfaue H. Analysis of water in food by near infrared spectroscopy. Food Chemistry. 2003;82:107–115. doi: 10.1016/S0308-8146(02)00583-6. [DOI] [Google Scholar]
- 50.Mohacek-Grosev V, Bozac R, Puppels GJ. Vibrational spectroscopic characterization of wild growing mushrooms and toadstools. Spectrochim Acta A Mol Biomol Spectrosc. 2001;57:2815–2829. doi: 10.1016/S1386-1425(01)00584-4. [DOI] [PubMed] [Google Scholar]
- 51.Kozarski M, et al. Antioxidative and immunomodulating activities of polysaccharide extracts of the medicinal mushrooms Agaricus bisporus, Agaricus brasiliensis, Ganoderma lucidum and Phellinus linteus. Food Chemistry. 2011;129:1667–1675. doi: 10.1016/j.foodchem.2011.06.029. [DOI] [Google Scholar]
- 52.Committee NP. Pharmacopoeia of the People’s Republic of China. Part. 2015;1:188–189. [Google Scholar]
- 53.Jiao L, Bing S, Zhang XF, Li H. Interval partial least squares and moving window partial least squares in determining the enantiomeric composition of tryptophan using UV-Vis spectroscopy. Journal of the Serbian Chemical Society. 2016;81:209–218. doi: 10.2298/JSC150227065J. [DOI] [Google Scholar]
- 54.Norgaard L, et al. Interval partial least-squares regression (iPLS): A comparative chemometric study with an example from near-infrared spectroscopy. Applied Spectroscopy. 2000;54:413–419. doi: 10.1366/0003702001949500. [DOI] [Google Scholar]
- 55.Ojamae L, Hermansson K, Probst M. The Oh Stretching Frequency in Liquid Water Simulations - the Classical Error. Chemical Physics Letters. 1992;191:500–506. doi: 10.1016/0009-2614(92)85416-8. [DOI] [Google Scholar]
- 56.Zhang F, Huang Q, Yan J, Zhang X, Li J. Assessment of the Effect of Trichostatin A on He La Cells through FT-IR Spectroscopy. Analytical Chemistry. 2015;87:2511–2517. doi: 10.1021/ac504691q. [DOI] [PubMed] [Google Scholar]
- 57.Xue Q, Peng WX, Ohkoshi M. Molecular bonding characteristics of Self-plasticized bamboo composites. Pakistan Journal of Pharmaceutical Sciences. 2014;27:975–982. [PubMed] [Google Scholar]
- 58.Goo BG, et al. Characterization of a renewable extracellular polysaccharide from defatted microalgae Dunaliella tertiolecta. Bioresource Technology. 2013;129:343–350. doi: 10.1016/j.biortech.2012.11.077. [DOI] [PubMed] [Google Scholar]
- 59.Shao L, et al. Partial characterization and immunostimulatory activity of exopolysaccharides from Lactobacillus rhamnosus KF5. Carbohydrate Polymers. 2014;107:51–56. doi: 10.1016/j.carbpol.2014.02.037. [DOI] [PubMed] [Google Scholar]
- 60.Zhao T, et al. Isolation, characterization and antioxidant activity of polysaccharide from Schisandra sphenanthera. Carbohydrate Polymers. 2014;105:26–33. doi: 10.1016/j.carbpol.2014.01.059. [DOI] [PubMed] [Google Scholar]
- 61.Gruber, J. et al. Novel soluble blue emitting PPV-like polymers: synthesis and characterization. E-Polymers (2003).
- 62.Etcheverry SB, Williams PAM, Baran EJ. Synthesis and characterization of oxovanadium(IV) complexes with saccharides. Carbohydrate Research. 1997;302:131–138. doi: 10.1016/S0008-6215(97)00132-8. [DOI] [Google Scholar]
- 63.Petrosyan AM. Vibrational spectra of L-histidine perchlorate and L-histidine tetrafluoroborate. Vibrational Spectroscopy. 2007;43:284–289. doi: 10.1016/j.vibspec.2006.03.001. [DOI] [Google Scholar]
- 64.Defrees DJ, Miller MD, Talbi D, Pauzat F, Ellinger Y. The Oretical Infrared-Spectra of Some Model Polycyclic Aromatic-Hydrocarbons - Effect of Ionization. Astrophysical Journal. 1993;408:530–538. doi: 10.1086/172610. [DOI] [PubMed] [Google Scholar]
- 65.Varetti EL, Aymonino PJ. Ir Spectra of Perfluoromethyl Perfluoroacetate and Perfluoromethyl Carbonate. Journal of Molecular Structure. 1971;7:155–&. doi: 10.1016/0022-2860(71)90016-0. [DOI] [Google Scholar]
- 66.Workman, J. & Weyer, L. Practical Guide to Interpretive Near-Infrared Spectroscopy. (CRC Press, Inc., 2007).
- 67.Ferreira DS, Poppi RJ, Pallone JAL. Evaluation of dietary fiber of Brazilian soybean (Glycine max) using near-infrared spectroscopy and chemometrics. Journal of Cereal Science. 2015;64:43–47. doi: 10.1016/j.jcs.2015.04.004. [DOI] [Google Scholar]
- 68.Fackler K, Schwanninger M, Gradinger C, Hinterstoisser B, Messner K. Qualitative and quantitative changes of beech wood degraded by wood-rotting basidiomycetes monitored by Fourier transform infrared spectroscopic methods and multivariate data analysis. FEMS Microbiol Lett. 2007;271:162–169. doi: 10.1111/j.1574-6968.2007.00712.x. [DOI] [PubMed] [Google Scholar]
- 69.He W, Hu H. Prediction of hot-water-soluble extractive, pentosan and cellulose content of various wood species using FT-NIR spectroscopy. Bioresource Technology. 2013;140:299–305. doi: 10.1016/j.biortech.2013.04.115. [DOI] [PubMed] [Google Scholar]
- 70.Chen Y, et al. Study on discrimination of white tea and albino tea based on near-infrared spectroscopy and chemometrics. J Sci Food Agric. 2014;94:1026–1033. doi: 10.1002/jsfa.6376. [DOI] [PubMed] [Google Scholar]
- 71.Chen J-B, Sun S-Q, Zhou Q. Data-driven signal-resolving approaches of infrared spectra to explore the macroscopic and microscopic spatial distribution of organic and inorganic compounds in plant. Analytical and Bioanalytical Chemistry. 2015;407:5695–5706. doi: 10.1007/s00216-015-8746-7. [DOI] [PubMed] [Google Scholar]
- 72.Chen SF, Danao MG, Singh V, Brown PJ. Determining sucrose and glucose levels in dual-purpose sorghum stalks by Fourier transform near infrared (FT-NIR) spectroscopy. J Sci Food Agric. 2014;94:2569–2576. doi: 10.1002/jsfa.6606. [DOI] [PubMed] [Google Scholar]
Associated Data
This section collects any data citations, data availability statements, or supplementary materials included in this article.


