

Abstract
Peptide binding to MHC class I molecules is the single most selective step in antigen presentation and the strongest single correlate to peptide cellular immunogenicity. The cost of experimentally characterizing the rules of peptide presentation for a given MHC-I molecule is extensive, and predictors of peptide–MHC interactions constitute an attractive alternative. Recently, an increasing amount of MHC presented peptides identified by mass spectrometry (MS ligands) has been published. Handling and interpretation of MS ligand data is, in general, challenging due to the polyspecificity nature of the data. We here outline a general pipeline for dealing with this challenge and accurately annotate ligands to the relevant MHC-I molecule they were eluted from by use of GibbsClustering and binding motif information inferred from in silico models. We illustrate the approach here in the context of MHC-I molecules (BoLA) of cattle. Next, we demonstrate how such annotated BoLA MS ligand data can readily be integrated with in vitro binding affinity data in a prediction model with very high and unprecedented performance for identification of BoLA-I restricted T-cell epitopes. The prediction model is freely available at http://www.cbs.dtu.dk/services/NetMHCpan/NetBoLApan. The approach has here been applied to the BoLA-I system, but the pipeline is readily applicable to MHC systems in other species.
Keywords: MHC, antigen presentation, BoLA, mass spectrometry, T-cell epitopes, bioinformatics, prediction, GibbsClustering, NetMHCpan
Introduction
Binding to MHC class I molecules (MHC-I) is a prerequisite for antigen presentation and induction of cytotoxic T-cell responses.1 MHC-I molecules are highly specific, binding only a very small part of the possible peptide space. This high specificity combined with its essential role of antigen presentation has placed MHC in the focal point of research related to rational T-cell epitope discovery and vaccine design.
Traditionally, the specificity of MHC molecules has been characterized using in vitro binding assays.2 Using such assays, binding affinity values for large sets of single peptides have allowed very accurate experimental characterization of the binding motifs for a large panel of MHC-I molecules including the most prevalent human and several nonhuman primate MHC-I molecules. Recent studies have further extended the approach to livestock species including pig (SLA)3 and cattle (BoLA).4 However, the cost of applying an in vitro approach to the characterization of MHC-I molecules is substantial, and using it to characterize all MHC molecules within a given species remains unfeasible.
Given this, large efforts have been dedicated to the development of accurate in silico models capable of characterizing the specificity of MHC-I molecules that not only allow the prediction of peptide binding to MHC-I molecules outside the very small set of peptides with measured binding affinity (i.e., extrapolating the peptide space) but also make predictions for MHC-I molecules with limited or even no experimental binding data (i.e., extrapolating the MHC-I space). One method capable of both of these types of extrapolations is NetMHCpan.5−7 This method is pan-specific in the sense that it allows the prediction of peptide binding to any MHC-I molecule with known protein sequence, and the method has in several benchmark studies been shown to be “state-of-the-art”.8,9
One inherent problem with most MHC-I binding prediction methods available, including NetMHCpan, is that they reflect the nature of the data used in the training of the underlying models. Because most prediction methods are trained on in vitro binding data, the predictive power of the models is restricted by any bias present in the in vitro binding data. It is clear that several biases are present in the currently available in vitro binding data, compromising their relevance as a descriptor of the biological event of antigen presentation: Binding data does not address the fact that antigen presentation is a complex integrative physiological process that combines antigen processing and transport as well as binding affinity and binding stability of the peptide to the MHC-I binding groove. Additionally, in vitro data fails to reflect any peptide length preference of different MHC-I alleles.
Recent advances in liquid chromatography tandem mass spectrometry (LC–MS2) have allowed this technique to become a powerful alternative to in vitro binding assays for the identification of MHC ligands and T-cell epitopes10,11 and characterization of MHC binding specificities.12,13 The use of LC–MS2 to identify MHC ligands has several clear advantages over in vitro binding assays. First and foremost, the data obtained suffers to a much lesser degree from the biases described above for the in vitro generated binding data. However, a limiting factor of the LC–MS2 approach for identification of MHC ligands is the sensitivity with which peptides can be reliably identified. It is inherent to the technology that the most abundant peptides in the sample are prioritized for identification using standard LC–MS2 acquisition methods. This is hallmarked by the fact that only a minor proportion of known T-cell epitopes are identified as MHC ligands in standard LC–MS2 assays. Hence, in the foreseeable future, LC–MS2 will, in line with in vitro assays, serve as a guide and not a solution for rational identification of T-cell epitopes.
Recent studies have suggested that training prediction engines on LC–MS2-determined MHC ligand data (further referred to as MS ligand data) rather than binding affinity data improves the ability to accurately identify MHC ligands.12,14,15 This observation strengthens the assumption that MS ligand data may provide a better representation of the presented peptide antigen pool compared with in vitro binding affinity data.
However, because the number of different MHC-I molecules characterized by MS ligands compared with in vitro binding data remains small, we have in a recent publication outlined an approach that permits the inclusion of both MS ligand data and binding affinity data into a framework for learning MHC-I peptide interactions.16 In this previous work, we demonstrated how this approach increased predictive performance compared with the previous “state-of-the-art” techniques with regard to the identification of naturally processed ligands, cancer neo-antigens, and T-cell epitopes.
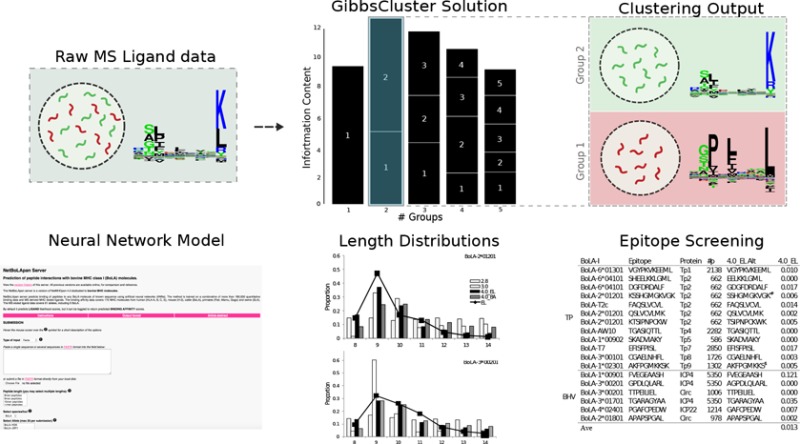
Here we extend the approach to livestock using MS ligand data obtained as part of studies to identify epitopes derived from Theileria parva, an intracellular protozoan pathogen of cattle. In addition to the pathogen-specific peptide data obtained in these studies (manuscript in preparation), the self-presented bovine-derived peptides provide a rich data set that could be utilized to enhance predictive models for BoLA-I restricted T-cell epitopes. To demonstrate this, we outline a general pipeline for analysis and interpretation of MS ligand data. The pipeline consists of three steps: (i) clustering of MS ligand data into MHC specificity groups, (ii) association of specificity groups to specific MHC molecules, and (iii) integration of MS ligand data into a framework for prediction of MHC-restricted T-cell epitopes. We describe this pipeline in the context of bovine leukocyte antigen class I (BoLA-I) ligand data and demonstrate how the approach can readily be applied to construct a predictive model with very high and unprecedented performance for identification of BoLA-I restricted T-cell epitopes.
Material and Methods
BoLA-Defined Cell Lines
Cell lines were established from animals that were derived from a series of parental backcrosses to generate MHCI-homozygous progeny. MHC haplotypes of these individuals were confirmed by a combination of serotyping and MHCI-allele-specific PCR and amplicon sequencing as previously described.17,18Theileria parva-infected lines from animals 1011 (BoLA-A10), 641 (BoLA-A18), and 2229 (BoLA-A14) were generated and maintained using well-established protocols.19 As uninfected controls, lymphoblastic T-cell lines were generated from homozygous MHC-matched animals 500004 (A10) and 104003 (A14) by stimulation of PBMC with 2.5 μg/mL of Concavalin (Con) A (Sigma-Aldrich, Dorset, U.K.) and then passage in medium supplemented with 100 U/mL recombinant human IL-2. Theileria parva-infected cell lines are denoted in the manuscript as A10-1, A14-1, and A18 and Con-A blast cell lines as A10-2 and A14-2, respectively. As defined in previous studies (e.g., ref (20)), the MHCI-allele content of the haplotypes described herein is A10 – BoLA-3*00201 and BoLA-2*01201, A18 – BoLA-6*01301, and A14 – BoLA-1*02301, BoLA-2*02501, and BoLA-4*02401.
BoLA-I-Associated Peptide Purification
Cells were washed and then lysed using 10 mL of lysis buffer (1% Igepal 630, 300 mM NaCl, 100 mM Tris pH 8.0, and protease inhibitors) per 109 cells. Lysates were cleared by centrifugation at 500g for 10 min, followed by 15 000g for 60 min. BoLA complexes were captured using a pan anti-BoLA class I antibody IL-88 that was covalently conjugated to protein A sepharose immunoresin (GE Healthcare) at a concentration of 5 mg/mL. Bound complexes were washed sequentially using buffers of 50 mM Tris buffer, pH 8.0 containing 150 mM NaCl, then 400 mM NaCl, and finally 0 mM NaCl. BoLA-associated peptides were eluted using 5 mL of 10% acetic acid and dried.
High-Performance Liquid Chromatography (HPLC) Fractionation
Affinity column-eluted material was resuspended in 120 μL of loading buffer (0.1% formic acid, 1% acetonitrile in water). Samples were loaded onto on a 4.6 × 50 mm ProSwiftTM RP-1S column (Thermo Scientific) and eluted using a 500 μL/min flow rate over 10 min from 2 to 35% buffer B (0.1% formic acid in acetonitrile) in buffer A (0.1% formic acid in water) using an Ultimate 3000 HPLC system (Thermo Scientific). Sample fractions were collected from 2 to 15 min. Protein detection was performed at 280 nm. Fractions up to 12 min that did not contain ß2-microglobulin were combined, dried, and further analyzed by LC–MS2.
LC–MS2 Analysis
Samples were suspended in 20 μL of loading buffer and analyzed on an Ultimate 3000 nano UPLC system online coupled to a QExactive-HF mass spectrometer (Thermo Scientific). Peptides were separated on a 75 μm × 50 cm PepMap C18 column using a 1 and 2 h linear gradient from 5 to 35% buffer B in buffer A at a flow rate of 250 nL/min (∼600 bar). Peptides were introduced into the mass spectrometer using a nano Easy Spray source (Thermo Scientific). Subsequent isolation and higher energy C-trap dissociation (HCD) was induced on the 20 most abundant ions per full MS scan with an accumulation time of 128 ms and an isolation width of 1.0 Da. All fragmented precursor ions were actively excluded from repeated selection for 8 s. The mass spectrometry proteomics data have been deposited to the ProteomeXchange Consortium via the PRIDE21 partner repository with the data set identifier PXD008151.
MS Data Analysis
Sequence interpretations of MS2 spectra were performed using a database containing all bovine UniProt entries combined with the all annotated Theileria parva proteins (35 992 entries total; bovine SwissProt entries: 5995, bovine Trembl entries: 25 911, Theileria parva entries: 4084). Spectral interpretation was performed using PEAKS 7.5 (Bioinformatics Solutions).
NetMHCpan Retraining and Data Preparation
MHC binding affinity data were obtained from the IEDB22 (http://tools.immuneepitope.org/main/datasets; data set used for retraining the IEDB class I binding prediction tools). This data set consists of 186 684 peptide–MHC binding affinity measurements covering 172 MHC molecules from human, mouse, primates, cattle, and swine. IEDB eluted ligands were also obtained from the IEDB applying the filtering procedure described in ref (16). This data set contains 85 217 entries in total restricted by 55 unique MHC molecules. Random artificial negatives were added for each MHC molecule covered by eluted ligand data by randomly sampling 10*N peptides of each length 8–15 amino acids from the antigen source protein sequences, where N is the number of 9mer ligands for the given MHC molecule. A similar procedure was applied for the BoLA-I restricted eluted ligands. Here, however, the artificial negatives were obtained from a set of random natural proteins.
Results
Raw MS Ligand Data
We first analyzed the accuracy and consistency of the raw MS BoLA-I ligand data generated. MS ligand data were obtained from five BoLA-I homozygous cell lines describing three BoLA haplotypes: A10, A14, and A18. As expected, the vast majority (99.7%) of the peptides are bovine self-peptides (data not shown). More than 94% of the peptides identified had lengths of between 8 and 14 amino acids. (A full list of this subset of identified ligands is included in Table S1.) Focusing on this peptide subset, the number of ligands obtained in each experiment varied between 6615 and 7755 (Figure 1A). The overlap in ligands identified between cell-lines expressing the same BoLA-I haplotype was large, with >50% of the unique peptides for each haplotype data set found in both samples (reflected in the total number of ligands for each haplotype being smaller than the sum of the counts from each cell line) (Figure 1B).
Figure 1.

(A) Number of peptides obtained from each cell line and for the combined set (all) of peptides for each of the BoLA-A10, -A14, and -A18 haplotypes. (B) Overlap of peptide sequences for A10 and A14 samples. (C) Distribution of ligand lengths within the different data sets.
The length distribution of the peptides was highly consistent between data sets from each haplotype but varied substantially between haplotypes (Figure 1C). The extreme examples are the data from cell lines expressing the A14 haplotype, with a relatively high preference for 8mers, and the cell lines expressing the A18 haplotype, with a preference for 10 and 11mer peptides.
Identification of MHC-I Allele Specificity Groups
One first challenge faced when interpreting and analyzing MS ligand data obtained from a given cell line that expresses more than a single MHC allele is assigning the peptides to the relevant MHC-I molecule they were eluted from. We have previously demonstrated that this challenge can be readily and accurately solved using the GibbsCluster method.23 In short, this method takes the complete list of eluted ligands from a given experiment as input and seeks to cluster the ligands into groups so that the similarity within each group is high and the similarity between groups is low. The algorithm includes an option to place ligands into a trash cluster if they demonstrate poor similarity to all defined clusters. This trash cluster option has proven to be very powerful for the removal of false-positive ligand data. The recent update to the tool allows the clustering to be performed on peptides of variable length.24 The outcome of the algorithm is a solution defined by an optimal number of clusters, with each ligand associated with one such cluster (or the trash cluster).
We hence applied the GibbsCluster method (version 2.0) to deconvolute the BoLA-I restriction of the ligands in the data sets corresponding to the three haplotypes. The method was run with default options for MHC class I ligand clustering except for the number of seeds, which was set to 10 to allow for improved sampling (Figure 2).
Figure 2.

GibbsCluster analysis of the three combined data sets. Each row displays the results from one haplotype data set. Left panels give the barplot of the Kullback–Leibler Distance (KLD) as a function of the number of clusters. The relative size of each black block within a bar is proportional to the size of each of the clusters. The right panels give the sequence motifs derived from the best solution (i.e., the solution with highest KLD) displayed in the form of sequence logos generated with Seq2Logo.25
The GibbsCluster method selects the solution with the highest KLD value (the central column of Figure 2), and in all three cases we find a perfect correspondence between the number of known functional BoLA-I alleles expressed by each cell line and the number of clusters identified by the GibbsCluster method. The number of peptides assigned to the Trash cluster was in the three cases: 3.4% (BoLA A10:347 out of 10 188), 2.1% (BoLA A14:201 out of 9509), and 2.5% (BoLA A18:164 out of 6615). These low proportions confirm the very high purity of the eluted ligand data sets.
Annotation of BoLA-I Restrictions to Specificity Groups
The next challenge of analyzing the MS ligand data set is the association of each identified ligand clusters to a BoLA-I molecule expressed in the given cell line. Here we used the motifs and binding predictions of NetMHCpan (version 3.0)7 as a qualitative guide to make this association. This approach allowed in all cases a clear and unambiguous association of a single BoLA-I restriction to each cluster (Figure 3, upper panel). We further quantified to which degree the motifs identified by the GibbsCluster method correspond to the motifs predicted by NetMHCpan-3.0 and how the Trash cluster is capable of acting as an effective filter for the removal of false-positives. The box plots (Figure 3, lower panel) depict the predicted percentile rank values of NetMHCpan-3.0 toward each of the different BoLA molecules of each haplotype for the peptides associated with the identified GibbsClusters (including Trash). As a rule of thumb, a percentile rank value of 2% or less is indicative of MHC binding.7 This Figure confirms that the ligands in a GibbsCluster in most cases are well-predicted by only one of the alleles in the haplotype (only one allele displays a low median rank value) and that ligands in the Trash cluster are poorly predicted by all alleles in the haplotype (median rank values are in all cases well above 10%). One exception from this is the G3 cluster of the A14 haplotype. This cluster is associated with the BoLA-2*02501 molecule according to visual binding motif association. This annotation is confirmed by the NetMHCpan-3.0 binding prediction analysis. (The median predicted rank for the G3 ligands is lowest for BoLA-2*02501 compared with the two other molecules.) However, the predicted rank values for this molecule are relatively high. (The median rank value is 6.5%, compared with median values close to 1 for the two annotated BoLA molecules for the other GibbsClusters G1 and G2.) This observation underlines the important additional information present in the MS ligand data beyond what is present in the in vitro binding data used for training NetMHCpan-3.0.
Figure 3.

Mapping of GibbsClustered peptides to BoLA-I molecule specificities. Each haplotype is shown separated by the vertical lines as indicated. In each column the binding motif logos for each of the optimal GibbsCluster solutions (upper row) together with the best-matched NetMHCpan predicted binding motif for the BoLA-I molecules (central row) expressed by the relevant haplotype are shown (as determined by visual comparison). The lower row displays boxplot representations of the NetMHCpan-3.0 percentile rank prediction values for all peptides in each GibbsCluster against all BoLA-I molecules expressed by the given haplotype.
On the basis of this mapping, we unambiguously assigned each cluster to one BoLA-I molecule, as shown in Table 1.
Table 1. Association of GibbsCluster Clusters to BoLA-I Restrictions.
| cell line | group | BoLA-I |
|---|---|---|
| A10 | G1 | BoLA-3*00201 |
| G2 | BoLA-2*01201 | |
| A14 | G1 | BoLA-4*02401 |
| G2 | BoLA-1*02301 | |
| G3 | BoLA-2*02501 | |
| A18 | G1 | BoLA-6*01301 |
Given this mapping of ligands to individual BoLA molecules we were able to conduct an allele-specific analysis of the length distribution of MHC-I ligands. As expected, most of the BoLA molecules had a length preference for 9mer peptides (Figure 4); however, clear differences in the ligand length distribution between the different BoLA-I molecules were evident. The most extreme cases were BoLA-1*02301 (A14), with a high preference for binding 8mer peptides (>30%), and BoLA-6*01301 (A18), with an increased preference for binding 10 and 11mer peptides (>65%).
Figure 4.

Length distribution of ligands restricted to each BoLA molecule.
Construction of a Prediction Model
Having mapped the likely BoLA-I restriction of the individual ligands, we sought to use this information to (re)train the NetMHCpan prediction method combining the BoLA MS eluted ligand (EL) data with BoLA binding affinity (BA) data contained within the IEDB. The retraining of the NetMHCpan prediction method was performed as previously described.16 In short, the method was trained on the two data types (BA and EL) in a conventional three-layer feed forward artificial neural network. The weights between the input layers and the hidden layer are shared between the two input types, and the output layer has two output neurons, one for each input type. During training, examples of the two data types (EL and BA) are shown at random to the network, and weights are adjusted using stochastic gradient descent along the gradient of the output neuron corresponding to the input type. Variations in peptide length are handled allowing insertions and deletions as described in ref (26).
The IEDB binding affinity peptide data set for seven BoLA molecules (listed in Table 2) contains exclusively 9mer peptide data. By integrating the MS ligand, we would hence expect that the updated NetMHCpan method would achieve an improved predictive performance for the BoLA system due to (i) the method being informed of the differences in length preference of the different BoLA molecules as illustrated in Figure 4 and (ii) the inclusion of peptide data for additional BoLA molecules expanding the knowledge of BoLA binding specificities. Examples of (i) are shown in Figure 5. (Results for all BoLA molecules are included in Figure S1.) Here the top 1% of the strongest predicted binders from a set of 700 000 random natural 8–14mer peptides (100 000 of each length) predicted using NetMHCpan-2.8, NetMHCpan-3.0, and the two individual output values of the method trained on the combined BoLA-eluted MS ligand data (EL) and binding affinity data (BA) (method 4.0) are shown in comparison with the measured length distribution of the MS ligand data.
Table 2. Comparison of the Predictive Performance of NetMHCpan-4.0_BA (the binding affinity prediction score of the NetMHCpan-4.0 method trained on both eluted ligand and peptide binding affinity data) and NetMHCpan-3.0 Models on Quantitative Binding Affinity Data from the IEDB Affinity Data Seta.
| NetMHCpan-4.0_BA |
NetMHCpan-3.0 |
|||||
|---|---|---|---|---|---|---|
| BoLA-I | no. peps | no. bind | PCC | AUC | PCC | AUC |
| BoLA-3*00101 (BoLA-AW10) | 166 | 8 | 0.497 | 0.816 | 0.381 | 0.792 |
| BoLA-1*02301 (BoLA-D18.4) | 258 | 182 | 0.648 | 0.832 | 0.551 | 0.747 |
| BoLA-6*01301 (BoLA-HD6) | 268 | 219 | 0.622 | 0.815 | 0.482 | 0.728 |
| BoLA-3*00201 (BoLA-JSP.1) | 158 | 32 | 0.464 | 0.703 | 0.277 | 0.622 |
| BoLA-T2c | 90 | 84 | 0.485 | 0.833 | 0.455 | 0.813 |
| BoLA-2*01201 (BoLA-T2a) | 167 | 47 | 0.691 | 0.852 | 0.635 | 0.812 |
| BoLA-6*04101 (BoLA-T2b) | 157 | 38 | 0.631 | 0.835 | 0.566 | 0.816 |
| Ave | 0.577 | 0.812 | 0.478 | 0.761 | ||
Names in parentheses in the first column refer to the historical names for the different alleles. Performance was estimated in terms of Pearson’s correlation coefficient (PCC) and AUC (area under the receiver operator curve). Both of these performance measures take a value of 1 for the perfect and values of 0.0 (PCC)/0.5 (AUC) for a random prediction.
Figure 5.

Predicted length preference for the BoLA-3*00201 (left) and BoLA-1*02301 (right) molecules. The solid line shows the length distribution for the MS eluted ligands in both panels and bars show the length distribution predicted by NetMHCpan-2.8 (2.8 - light gray), NetMHCpan-3.0 (3.0 - white), the eluted ligand output value of NetMHCpan-4.0 (4.0_EL - black), and the binding affinity output value of NetMHCpan-4.0 (4.0_BA - gray).
The Figure shows that the MS eluted ligand likelihood score (4.0 EL) and to a lesser degree the binding affinity score (4.0 BA) of the NetMHCpan-4.0 model trained on the combined BoLA-eluted MS ligand and IEDB MHC binding affinity data accurately captures the length preference of the two BoLA molecules, as described from the MHC-elution MS ligand data. The Figure also confirms the previous observation that NetMHCpan-2.8 has no power to predict peptide length preferences of different MHC molecules and that NetMHCpan-3.0 in most cases (including the two shown here) predicts a strong preference for 9mers, followed by 10mers, but has very limited predictive potential for peptides of other lengths.7 Note that the eluted ligand data displayed as reference in these analyses were included in the training of the NetMHCpan-4.0 method. This is an essential remark because the power of NetMHCpan to predict the binding properties and peptide length preference of a given MHC molecule depends strongly on the similarity of the MHC molecule to the data used to train the NetMHCpan method.16,27 For the BoLA molecules covered by MS ligand data included in this study, the distance to the other MHC molecules in the training data is in all cases very large (data not shown). Hence the method will predict the length preference, in particular, for BoLA molecules with an atypical length distribution like BoLA-3*00201 and BoLA-1*02301 poorly if ligand data for these molecules were excluded from the training.
Turning next to the evaluation of how the inclusion of the MS ligand data impacts the performance when it comes to predicting peptide-BoLA interactions, we show in Table 2 the performance of models trained with and without MS ligand data (NetMHCpan-3.0 and NetMHCpan-4.0, respectively) when evaluated on the set of peptides with measured binding affinity data from the IEDB (performance is evaluated using 5-fold cross validation). From this evaluation, it is apparent that adding MS ligand data improves the predictive performance of the model with a consistent increase in the predictive power as measured in terms of both the Pearson’s correlation coefficient (PCC) and area under the receiver operator curve (AUC) across all six BoLA molecules.
Identification of BoLA-I Restricted T-cell Epitopes
Finally, we evaluated the combined impact of the above two effects (improved prediction of the preferred peptide length and expanded knowledge of BoLA binding specificities) for the capacity to enhance prediction of BoLA-I restricted T-cell epitopes. We performed this evaluation on a set of previously described epitopes with known BoLA-I restrictions.28,29 Here we predict binding for all overlapping 8–11mer peptides from the source protein of the epitopes to the known BoLA-I restriction molecule using the NetMHCpan-3.0 and NetMHCpan-4.0_EL (the eluted ligand prediction score of the NetMHCpan-4.0 method trained on both eluted ligand and peptide binding affinity data) prediction methods and report the performance of each method as a Frank score (i.e., the fraction of peptides with predicted binding values greater than the epitope). Using this measure, a value of 0 corresponds to a perfect prediction (the known epitope is identify with the highest predicted binding value among all peptides found within the source protein) and a value of 0.5 to random prediction. The result of this evaluation is shown in Table 3.
Table 3. Predictive Performance of the NetMHCpan-4.0 Eluted Ligand Likelihood Prediction Model (4.0_EL) Compared with NetMHCpan-3.0 (3.0) on a Data Set of Known BoLA-I Restricted T-Cell Epitopes from Theileria parva (TP) and Bovine Herpes Virus (BHV)a,b.

The part of the Table to the left of the vertical line gives the performance of the two methods on the original epitope data. The part of the Table to the right of the vertical line gives the results allowing each prediction method to suggest alternative epitopes overlapping with the known epitopes (either contained within known epitopes or with single amino acid extensions). In bold is highlighted the case where the two methods suggest alternative optimal epitopes.
#: Minimal epitope defined in ref (30); $: Minimal epitope (N. MacHugh personal communication).
Also, in these data, the improvement in predictive performance when integrating the BoLA-MS eluted ligand data in the prediction methods is apparent. When permitting the prediction methods to suggest alternative epitopes the average scores for NetMHCpan3.0 and 4.0_EL are 0.036 and 0.013, respectively. In the majority of cases (16/18), the NetMHCpan-4.0 method identifies the epitopes (or suggests an alternative variant) within the top 2% of peptides contained within the source protein of the epitope (i.e., has a Frank value <0.02). Notably, the worst prediction made by NetMHCpan4.0_EL is for the FVEGEAASH epitope presented by BoLA-1*00901; there is no binding or BoLA-eluted ligand data are available characterizing the specificity and ligand length preference of this BoLA-I molecule. The closest neighbor, defined in terms of the sequence similarity of the pseudo sequence of BoLA-1*00901 to the MHC molecules in the training data, is BoLA-1*02301 with a neighbor distance of 0.14. This value is larger than the 0.1 distance value that as rule of thumb is defined as the threshold for when NetMHCpan predictions are reliable.27 It is hence not unexpected to observe low predictive performance for this molecule, and its exclusion nearly halves the average score for the NetMHCpan4.0_EL predictions to 0.007. In conclusion, in practical terms and in the context of workload reduction, this result means that more than 99% of the peptides contained within the antigen protein sequences could be discarded by use of peptide binding prioritizations prior to experimental validation.
Discussion and Conclusions
In this work, we have outlined a simple yet highly powerful pipeline for the analysis and interpretation of LC–MS2-defined MHC-eluted ligand data. We applied the pipeline to analyze eluted ligand data obtained from five cell lines covering three BoLA-I haplotypes each characterized to express between one and three distinct BoLA-I molecules.
We demonstrate how the pipeline can effectively deal with several of the important challenges when interpreting MS ligand data, including identification of false-positives, identification of the MHC binding motif, and assignment to the regarding MHC restriction elements. We also demonstrate how this information can be integrated into prediction methods to improve their accuracy for rational epitope discovery.
Comparing the set of ligands identified from separate cell lines derived from two different animals expressing identical BoLA haplotypes revealed a high level of consistency with >50% of the ligands shared between both. Using the GibbsCluster method to group the ligands allowed for both the identification of false-positives and also MHC binding specificity clusters. A very low number of false-positive peptides were identified (<3.4% in all samples), confirming the high accuracy of the MS ligand data. For each of the analyzed data sets, we found a perfect correspondence between the number of specificity clusters identified and the number of known functional MHC molecules included in the corresponding haplotype. Analyzing each of the identified clusters revealed large differences not only in binding motif of associated ligands but also in the length preference of the ligands presented by each of different MHC molecule. This difference in ligand length preference between BoLA-I molecule has to the best of our knowledge not been characterized before.
A challenge related to the identification of MHC binding specificity clusters is the subsequent association of specificity clusters to restricting MHC molecules expressed by the given cell. Several approaches have been suggested to deal with these challenges including the use of MHC monoallelic cell lines15 and co-occurrence of MHC alleles across different samples.14 However, in the vast majority of cases, the association can readily be obtained by comparing the binding motif of each specificity cluster to the motif predicted by state-of-the-art MHC binding prediction methods such as NetMHCpan.7 It is clear that this approach is limited by the prediction accuracy of the NetMHCpan method and will fail in situations where NetMHCpan has no predictive power for one or more of the MHC molecules in question. However, as shown here, applying this approach where some prior information about the BoLA-I specificities is available allows clusters to be unambiguously assigned to BoLA-I molecules.
Having mapped each ligand to a specific BoLA-I molecule, we analyzed how to best benefit from these data in terms of the development of improved prediction methods for BoLA-I restricted T-cell epitopes. We have previously demonstrated that integrating binding affinity data covering a range of relevant BoLA-I into the NetMHCpan prediction tool led to an improved performance for the identification of known BoLA-I restricted T-cell epitopes.4 Previous work moreover suggested that the MHC ligand prediction method could benefit from the integration of MS elution data.15,12,31 To benefit from both of these observations, we here applied the recently proposed approach to train the MHC binding predictor on a combined data set of binding affinity and MS ligand data.16 In accordance with the work by Jurtz et al.,16 we find that this approach led to significantly improved performance for prediction of both peptide binding affinity and T-cell epitopes.
As previously mentioned, the different BoLA-I molecules showed very different peptide length binding preference. As shown here, including the MS ligand data in the training, allows, in agreement with previous work, the prediction method to learn these differences and hence boost the predictive performance by placing lower binding values to peptides with atypical length according to the eluted ligand length profile.
Evaluating the prediction model trained on the combined binding affinity and eluted ligand data on a set of validated BoLA-I restricted epitopes, we found a consistent improvement in performance compared with current methods. In agreement with previous studies, the vast majority of epitopes are identified within the top 2% of the predicted peptides contained within the antigen source protein.7 Only one epitope was very poorly predicted by the proposed model. This epitope is restricted to a BoLA-I molecule very distinct (in terms of the protein sequence) from the BoLA molecules included in the training of the NetMHCpan method, and this most likely accounted for the low prediction accuracy for this molecule.27 Furthermore, data on the nature of the peptides that bind to this allele is likely to improve the predictive values of NetMHCpan. Also, the analysis suggests, in agreement with previous studies, that the presence of alternative epitopes overlapping with the known epitopes (either wholly contained within the peptide or accommodated by single amino acid extensions) strongly suggests that these need to be refined to map the minimal epitope.32,30,33
In conclusion, the present study confirms the very high accuracy of “state-of-the art” proteomic methods for high-throughput and accurate identification of MHC-presented ligands and demonstrates how the proposed pipeline combining GibbsClustering and advanced data mining techniques allows the intuitive interpretation of MS ligand data and also the integration of such data for improved prediction of MHC peptide binding and T-cell epitopes. The developed prediction model is freely available at http://www.cbs.dtu.dk/services/NetMHCpan/NetBoLApan.
Here the approach has been applied to the BoLA-I system, but the pipeline is readily applicable to MHC systems in other species.
Acknowledgments
Mass spectrometry acquisition was performed in the Target Discovery Institute Mass Spectrometry Laboratory led by Benedikt M. Kessler. We greatly appreciate the help from Bruno Alvarez with the design of the artwork presented. The work was supported by the Department for International Development of the United Kingdom and the Bill and Melinda Gates Foundation (OPP1078791) and the CGIAR Research Program on Livestock and Fish.
Supporting Information Available
The Supporting Information is available free of charge on the ACS Publications website at DOI: 10.1021/acs.jproteome.7b00675.
The authors declare no competing financial interest.
Notes
The mass spectrometry proteomics data have been deposited to the ProteomeXchange Consortium via the PRIDE21 partner repository with the data set identifier PXD008151.
Supplementary Material
References
- Yewdell J. W.; Bennink J. R. Immunodominance in major histocompatibility complex class I-restricted T lymphocyte responses. Annu. Rev. Immunol. 1999, 17, 51–88. 10.1146/annurev.immunol.17.1.51. [DOI] [PubMed] [Google Scholar]
- Harndahl M.; Justesen S.; Lamberth K.; Roder G.; Nielsen M.; Buus S. Peptide binding to HLA class I molecules: homogenous, high-throughput screening, and affinity assays. J. Biomol. Screening 2009, 14 (2), 173–180. 10.1177/1087057108329453. [DOI] [PubMed] [Google Scholar]
- Pedersen L. E.; Harndahl M.; Rasmussen M.; Lamberth K.; Golde W. T.; Lund O.; Nielsen M.; Buus S. Porcine major histocompatibility complex (MHC) class I molecules and analysis of their peptide-binding specificities. Immunogenetics 2011, 63 (12), 821–834. 10.1007/s00251-011-0555-3. [DOI] [PMC free article] [PubMed] [Google Scholar]
- Hansen A. M.; Rasmussen M.; Svitek N.; Harndahl M.; Golde W. T.; Barlow J.; Nene V.; Buus S.; Nielsen M. Characterization of binding specificities of bovine leucocyte class I molecules: impacts for rational epitope discovery. Immunogenetics 2014, 66 (12), 705–718. 10.1007/s00251-014-0802-5. [DOI] [PMC free article] [PubMed] [Google Scholar]
- Nielsen M.; Lundegaard C.; Blicher T.; Lamberth K.; Harndahl M.; Justesen S.; Roder G.; Peters B.; Sette A.; Lund O.; et al. NetMHCpan, a method for quantitative predictions of peptide binding to any HLA-A and -B locus protein of known sequence. PLoS One 2007, 2 (8), e796. 10.1371/journal.pone.0000796. [DOI] [PMC free article] [PubMed] [Google Scholar]
- Hoof I.; Peters B.; Sidney J.; Pedersen L. E.; Sette A.; Lund O.; Buus S.; Nielsen M. NetMHCpan, a method for MHC class I binding prediction beyond humans. Immunogenetics 2009, 61 (1), 1–13. 10.1007/s00251-008-0341-z. [DOI] [PMC free article] [PubMed] [Google Scholar]
- Nielsen M.; Andreatta M. NetMHCpan-3.0; improved prediction of binding to MHC class I molecules integrating information from multiple receptor and peptide length datasets. Genome Med. 2016, 8 (1), 1–9. 10.1186/s13073-016-0288-x. [DOI] [PMC free article] [PubMed] [Google Scholar]
- Trolle T.; Metushi I. G.; Greenbaum J. A.; Kim Y.; Sidney J.; Lund O.; Sette A.; Peters B.; Nielsen M. Automated benchmarking of peptide-MHC class I binding predictions. Bioinformatics 2015, 31 (13), 2174–2181. 10.1093/bioinformatics/btv123. [DOI] [PMC free article] [PubMed] [Google Scholar]
- Zhang L.; Udaka K.; Mamitsuka H.; Zhu S. Toward more accurate pan-specific MHC-peptide binding prediction: a review of current methods and tools. Briefings Bioinf. 2012, 13 (3), 350–364. 10.1093/bib/bbr060. [DOI] [PubMed] [Google Scholar]
- Ternette N.; Yang H.; Partridge T.; Llano A.; Cedeño S.; Fischer R.; Charles P. D.; Dudek N. L.; Mothe B.; Crespo M.; et al. Defining the HLA class I-associated viral antigen repertoire from HIV-1-infected human cells. Eur. J. Immunol. 2016, 46 (1), 60–69. 10.1002/eji.201545890. [DOI] [PMC free article] [PubMed] [Google Scholar]
- McMurtrey C.; Trolle T.; Sansom T.; Remesh S. G.; Kaever T.; Bardet W.; Jackson K.; McLeod R.; Sette A.; Nielsen M.; et al. Toxoplasma gondii peptide ligands open the gate of the HLA class I binding groove. eLife 2016, 5, e12556. 10.7554/eLife.12556. [DOI] [PMC free article] [PubMed] [Google Scholar]
- Bassani-Sternberg M.; Gfeller D. Unsupervised HLA Peptidome Deconvolution Improves Ligand Prediction Accuracy and Predicts Cooperative Effects in Peptide-HLA Interactions. J. Immunol. 2016, 197 (6), 2492–2499. 10.4049/jimmunol.1600808. [DOI] [PubMed] [Google Scholar]
- Ritz D.; Gloger A.; Weide B.; Garbe C.; Neri D.; Fugmann T. High-sensitivity HLA class I peptidome analysis enables a precise definition of peptide motifs and the identification of peptides from cell lines and patients’ sera. Proteomics 2016, 16 (10), 1570–1580. 10.1002/pmic.201500445. [DOI] [PMC free article] [PubMed] [Google Scholar]
- Bassani-Sternberg M.; Chong C.; Guillaume P.; Solleder M.; Pak H.; Gannon P. O.; Kandalaft L. E.; Coukos G.; Gfeller D. Deciphering HLA-I motifs across HLA peptidomes improves neo-antigen predictions and identifies allostery regulating HLA specificity. PLoS Comput. Biol. 2017, 13 (8), e1005725. 10.1371/journal.pcbi.1005725. [DOI] [PMC free article] [PubMed] [Google Scholar]
- Abelin J. G.; Keskin D. B.; Sarkizova S.; Hartigan C. R.; Zhang W.; Sidney J.; Stevens J.; Lane W.; Zhang G. L.; Eisenhaure T. M.; et al. Mass Spectrometry Profiling of HLA-Associated Peptidomes in Mono-allelic Cells Enables More Accurate Epitope Prediction. Immunity 2017, 46 (2), 315–326. 10.1016/j.immuni.2017.02.007. [DOI] [PMC free article] [PubMed] [Google Scholar]
- Jurtz V.; Paul S.; Andreatta M.; Marcatili P.; Peters B.; Nielsen M. NetMHCpan-4.0: Improved Peptide-MHC Class I Interaction Predictions Integrating Eluted Ligand and Peptide Binding Affinity Data. J. Immunol. 2017, 199, 3360. 10.4049/jimmunol.1700893. [DOI] [PMC free article] [PubMed] [Google Scholar]
- Ellis S. A.; Morrison W. I.; MacHugh N. D.; Birch J.; Burrells A.; Stear M. J. Serological and molecular diversity in the cattle MHC class I region. Immunogenetics 2005, 57 (8), 601–606. 10.1007/s00251-005-0027-8. [DOI] [PubMed] [Google Scholar]
- Ellis S. A.; Staines K. A.; Stear M. J.; Hensen E. J.; Morrison W. I. DNA typing for BoLA class I using sequence-specific primers (PCR-SSP). Eur. J. Immunogenet. 1998, 25 (5), 365–370. 10.1046/j.1365-2370.1998.00112.x. [DOI] [PubMed] [Google Scholar]
- Goddeeris B. M.; Morrison W. I. Techniques for the generation, cloning, and characterization of bovine cytotoxic T cells specific for the protozoan Theileria parva. J. Tissue Cult. Methods 1988, 11 (2), 101–110. 10.1007/BF01404140. [DOI] [Google Scholar]
- Birch J.; Murphy L.; MacHugh N. D.; Ellis S. A. Generation and maintenance of diversity in the cattle MHC class I region. Immunogenetics 2006, 58 (8), 670–679. 10.1007/s00251-006-0137-y. [DOI] [PubMed] [Google Scholar]
- Vizcaíno J. A.; Csordas A.; del-Toro N.; Dianes J. A.; Griss J.; Lavidas I.; Mayer G.; Perez-Riverol Y.; Reisinger F.; Ternent T.; et al. 2016 update of the PRIDE database and its related tools. Nucleic Acids Res. 2016, 44 (D1), D447–456. 10.1093/nar/gkv1145. [DOI] [PMC free article] [PubMed] [Google Scholar]
- Vita R.; Zarebski L.; Greenbaum J. A.; Emami H.; Hoof I.; Salimi N.; Damle R.; Sette A.; Peters B. The immune epitope database 2.0. Nucleic Acids Res. 2010, 38 (Database issue), D854–62. 10.1093/nar/gkp1004. [DOI] [PMC free article] [PubMed] [Google Scholar]
- Andreatta M.; Lund O.; Nielsen M. Simultaneous alignment and clustering of peptide data using a Gibbs sampling approach. Bioinformatics 2013, 29 (1), 8–14. 10.1093/bioinformatics/bts621. [DOI] [PubMed] [Google Scholar]
- Andreatta M.; Alvarez B.; Nielsen M. GibbsCluster: unsupervised clustering and alignment of peptide sequences. Nucleic Acids Res. 2017, 45, W458. 10.1093/nar/gkx248. [DOI] [PMC free article] [PubMed] [Google Scholar]
- Thomsen M. C.; Nielsen M. Seq2Logo: a method for construction and visualization of amino acid binding motifs and sequence profiles including sequence weighting, pseudo counts and two-sided representation of amino acid enrichment and depletion. Nucleic Acids Res. 2012, 40 (Web Server issue), W281–7. 10.1093/nar/gks469. [DOI] [PMC free article] [PubMed] [Google Scholar]
- Andreatta M.; Nielsen M. Gapped sequence alignment using artificial neural networks: application to the MHC class I system. Bioinformatics 2016, 32 (4), 511–517. 10.1093/bioinformatics/btv639. [DOI] [PMC free article] [PubMed] [Google Scholar]
- Karosiene E.; Lundegaard C.; Lund O.; Nielsen M. NetMHCcons: a consensus method for the major histocompatibility complex class I predictions. Immunogenetics 2012, 64 (3), 177–186. 10.1007/s00251-011-0579-8. [DOI] [PubMed] [Google Scholar]
- Nene V.; Svitek N.; Toye P.; Golde W. T.; Barlow J.; Harndahl M.; Buus S.; Nielsen M. Designing bovine T cell vaccines via reverse immunology. Ticks Tick Borne Dis 2012, 3 (3), 188–192. 10.1016/j.ttbdis.2011.12.001. [DOI] [PubMed] [Google Scholar]
- Hart J.; MacHugh N. D.; Sheldrake T.; Nielsen M.; Morrison W. I. Identification of immediate early gene products of bovine herpes virus 1 (BHV-1) as dominant antigens recognized by CD8 T cells in immune cattle. J. Gen. Virol. 2017, 98 (7), 1843–1854. 10.1099/jgv.0.000823. [DOI] [PubMed] [Google Scholar]
- Connelley T. K.; Li X.; MacHugh N.; Colau D.; Graham S. P.; van der Bruggen P.; Taracha E. L.; Gill A.; Morrison W. I. CD8 T-cell responses against the immunodominant Theileria parva peptide Tp249–59 are composed of two distinct populations specific for overlapping 11-mer and 10-mer epitopes. Immunology 2016, 149 (2), 172–185. 10.1111/imm.12637. [DOI] [PMC free article] [PubMed] [Google Scholar]
- Bassani-Sternberg M.; Pletscher-Frankild S.; Jensen L. J.; Mann M. Mass spectrometry of human leukocyte antigen class I peptidomes reveals strong effects of protein abundance and turnover on antigen presentation. Mol. Cell. Proteomics 2015, 14 (3), 658–673. 10.1074/mcp.M114.042812. [DOI] [PMC free article] [PubMed] [Google Scholar]
- Hart J.; MacHugh N. D.; Sheldrake T.; Nielsen M.; Morrison W. I. Identification of immediate early gene products of bovine herpes virus 1 (BHV-1) as dominant antigens recognized by CD8 T cells in immune cattle. J. Gen. Virol. 2017, 98, 1843. 10.1099/jgv.0.000823. [DOI] [PubMed] [Google Scholar]
- Svitek N.; Hansen A. M.; Steinaa L.; Saya R.; Awino E.; Nielsen M.; Buus S.; Nene V. Use of “one-pot, mix-and-read” peptide-MHC class I tetramers and predictive algorithms to improve detection of cytotoxic T lymphocyte responses in cattle. Vet Res. 2014, 45 (1), 50. 10.1186/1297-9716-45-50. [DOI] [PMC free article] [PubMed] [Google Scholar]
Associated Data
This section collects any data citations, data availability statements, or supplementary materials included in this article.