

Abstract
Protein glycosylation plays an important role in various biological processes, such as modification of protein function, regulation of protein-protein interactions and control of turnover rates of proteins. Moreover, glycans have been considered as potential biomarkers for many mammalian diseases and development of aberrant glycosylation profiles is an important indicator of the pathology of a disease or cancer. Hence, quantitation is an important aspect of a comprehensive glycomics study. Although numerous MS-based quantitation strategies have been developed in the past several decades, some issues affecting sensitivity and accuracy of quantitation still exist, and the development of more effective quantitation strategies is still required. Aminoxy tandem mass tag (AminoxyTMT™) reagents are recently commercialized isobaric tags which enable relative quantitation of up to six different glycan samples simultaneously. In this study, liquid chromatography and mass spectrometry conditions have been optimized to achieve reliable LC-MS/MS quantitative glycomic analysis using aminoxyTMT™ reagents. Samples were resuspended in 0.2 M sodium chloride solution to promote the formation of sodium adduct precursor ions, which leads to higher MS/MS reporter ion yields. This method was first evaluated with glycans from model glycoproteins and pooled human blood serum samples. The observed variation of reporter ion ratios was generally less than 10% relative to the theoretical ratio. Even for the highly complex minor N-glycans, the variation was still below 15%. This strategy was further applied to the glycomic profiling of N-glycans released from blood serum samples of patients with different esophagus diseases. Our results demonstrate the benefits of utilizing aminoxyTMT reagents for reliable quantitation of biological glycomic samples.
Keywords: Glycans, AminoxyTMT™, Quantitation, LC-MS/MS
Graphical abstract
Introduction
Glycosylation is one of the most common post-translational protein modifications, having major roles in various biological processes. 1–6 Quantification is an important part of a glycomics study as in recent years; glycans have been identified as potential biomarkers for a number of diseases, including cancers, immune deficiencies, and cardiovascular diseases.7–10 Accordingly, quantitation reliability is critical for analysis, meanwhile high-throughput and highly efficient quantitative methods are in high demand because of a vast number of samples required for quantitative glycomic analyses of clinical samples.
Glycans can be labeled with chromophores and detected and quantified by fluorescence spectroscopy. However, spectroscopy-based quantitation methods rely greatly on internal or external standards, and quantitation reliability decreases with increasing sample complexity. In recent years, mass spectrometry (MS) has become a dominant analytical instrument for glycomic research because of the ability to offer glycan identification, structure elucidation, and compositional quantitation through high resolution MS and triple quadrupole MS operated in selected reaction monitoring (SRM) or multiple reaction monitoring (MRM) modes.11,12 However, there are still some problematic issues related to MS-based quantitative glycomics, including ionization stability and efficiency as well as response bias over different mass ranges and time. MS-based quantitative glycomics is limited by ionization efficiency in matrix-assisted laser desorption ionization (MALDI) and electrospray ionization (ESI). Both ionization methods result in variation during analyses, which influences the reliability of quantitation; especially when MS is coupled with separation techniques such as liquid chromatography (LC) and capillary electrophoresis. Variation caused by ionization efficiency cannot be simply eliminated by introducing internal standards, in some cases, the addition of internal standard can further complicate the ionization efficiency issue.
Introducing multiplex stable isotope reagents would improve quantitation reliability and analysis efficiency because multiple samples can be analyzed in a single run. This can result in significant time savings for LC-MS where analysis times are often greater than one hour per sample. Additionally, multiplexing can minimize errors induced by ionization efficiency and instrument response. Various types of stable isotope labeling reagents have been reported.13,14 Utilizing different isotopic iodomethane varieties, for glycan permethylation, is an effective and convenient method for stable isotope labeling. For example, 13CH3I and 12CH2DI have been used.15 This technique was first reported for MALDI-MS analysis and demonstrated lower than 30% variation within a large ratio range.16 The method was recently extended to LC-MS analysis, and a variety of quantitative glycomic analyses were conducted based on the technique; such as analysis of human blood serum from patients with different esophageal diseases.17 Alternative isotopic labeling strategies are accomplished by modifying the reducing end of glycans,18–21 examples include P2GPN and INLIGHT™.22–28 An advantage of these strategies is the fact that reagent purity does not adversely influence quantitation since a single site on a glycan structure is derivatized. Tetraplex analysis using reductive amination labeling has been reported to be a reliable method for simultaneously analyzing multiple samples.29,30
Although the techniques mentioned above enable multiplex quantitative analysis, distinguishing labeled samples is based on mass-shifts, which increases the complexity of MS spectra and can limit the ability to simultaneously analyzing multiple samples. Isobaric tags have been well established for proteomics;31–35 however, efficient and reliable glycomic quantitation methods involving isobaric tags are still in development. Several attempts using isobaric tags for glycomic analysis have been reported; for example, aminoxy tandem mass tag (aminoxyTMT),36 which evolved from TMT reagents for proteomics. Previous research has demonstrated the high labeling efficiency and ionization efficiency improvement of aminoxyTMT. However, quantification using this reagent in MALDI-MS is not reliable for minor glycan species due to competitive ionization and low reporter ion yields. Isobaric aldehyde reactive tags (iARTs)37, with a reductive amination labeling mechanism, have recently been reported. This reagent enables pair analysis of glycans derived from two different sources and shows high reliability when evaluating model glycans. However, based on reported results, it displays limitations when utilized for the analysis of complex glycans derived from biological samples.37
Here, we describe the use of aminoxyTMT coupled with LC separation to improve its quantitative reliability in complex samples. Additionally, we have explored methods to induce sodiated precursor ions in order to improve reporter ion yield and achieve higher quantitative reliability. After verifying the quantitative reliability of the method using model glycans we successfully applied it to the analysis of N-glycans derived from biological samples.
Material and Methods
Materials and Reagents
HPLC grade methanol, isopropanol, and acetic acid were procured from Fisher Scientific (Pittsburgh, PA). Acetonitrile (ACN) and acetone were acquired from JT Baker (Phillipsburg, NJ). HPLC grade water and sodium hydroxide were purchased from Mallinckrodt Chemicals (Phillipsburg, NJ). Borane-ammonia complex, sodium hydroxide beads, dimethyl sulfoxide (DMSO), iodomethane, trifluoroacetic acid (TFA), and formic acid (FA) were purchased from Sigma-Aldrich (St. Louis, MO). PNGase F with 10×G7 reaction buffer (0.5 M sodium phosphate) was obtained from New England Biolabs (Ipswich, MA). AminoxyTMT™ reagent was obtained from Thermo Fisher Scientific (Rockford, IL).
RNase B and fetuin from bovine serum were purchased from Sigma-Aldrich (St. Louis, MO). Human blood serum from disease free and patients with Barrett’s disease (BE), high-grade dysplasia (HGD) and esophageal adenocarcinoma (EAC) was provided by Dr. Zane Hammoud (Henry Ford Hospital, Detroit, MA). All cell lines were purchased from American Type Culture Collection (ATCC; Manassas, VA) except for the subline MDA-MB-231Br, which was provided by Dr. Paul Lockman and Dr. Quentin Smith (TTU Pharmacy School, Amarillo, TX).
Sample Preparation Methods
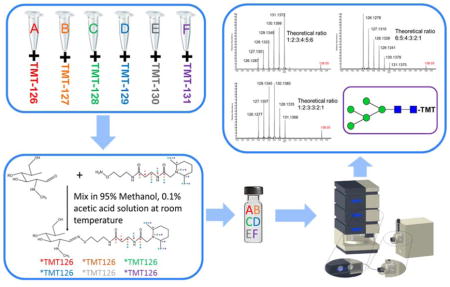
N-glycans were released from RNase B, fetuin and human blood serum by the following procedure. Model glycoproteins or human blood serum were mixed with 20 mM ammonium bicarbonate digestion buffer. Samples were then denatured in an 80°C water bath for 1 hour, followed by PNGase F digestion in a 37°C water bath for 18 hours. Released N-glycans were purified using HyperSep PGC spin columns to remove salts and proteins. Purified N-glycans were then labeled with aminoxyTMT reagents according to the manufacturer’s protocol. Briefly, the glycans were mixed with an excess aminoxyTMT reagent, in a molar ratio of approximately 50 to 1, in 200 μL of 95% methanol containing 0.1% acetic acid and shaken at ambient temperature for 10 minutes. The mixture was then dried under vacuum and subjected to a resuspension and drying cycle with 200 μL of 95% methanol solution. Finally, the sample was quenched by adding 100 μL of a 10% acetone solution (Figure 1).
Figure 1.

Summary of amnioxyTMT™ sample preparation steps.
For the sample preparation of glycans released from cell pellets, additional steps are required. Harvested cells were first centrifuged at 4.5k rpm for 4 minutes to replace the growth medium with phosphate buffer. The cells in the phosphate buffer were then subjected to 3 freeze-thaw cycles and homogenized by a microtube homogenizer. A small portion of the mixture was then taken out for PSA protein assay to determine protein content, which was used as a reference to normalize spiking ratio. The rest of homogenized cell pellet was denatured, digested, purified and labeled with aminoxyTMT™ using the protocol outlined above.
Instrumentation
The LTQ Orbitrap Velos (Thermo Scientific, San Jose, CA, USA) and Dionex Ultimate 3000 UHPLC (Thermo Scientific, Sunnyvale, CA, USA) systems were utilized for LC-MS/MS analysis in this study. AminoxyTMT-labeled glycans were separated on a HyperCarb column (Thermo Scientific, Pittsburgh, PA, USA). A HyperCarb trap column was also employed for trapping and on-line purification of samples. In the first 10 minutes, the sample was directly loaded onto the trap column and flushed by loading buffer (1% ACN, 0.1% FA) at 3 μL/min. After on-line purification, the trap column was connected to the analysis column by valve switching to start the LC separation. 38 The flow rate for porous graphite carbon (PGC) separation was set to 350 nL/min. Mobile phase A consisted of 2% ACN, 98% H2O and 0.1% FA, B consisted of 100% ACN with 0.1% FA. The separation gradient started with 5% mobile phase B for 10 minutes then increased to 25% B during the next 20 minutes; the gradient then ramped to70% B over 35 minutes then jumped to 90% B in oneminute. The flow was held at 90% B for 4 minutes then decreased to 5% B and held for 3 minutes to equilibrate the column for the next sample. The LC outlet was interfaced to the MS by a nanoESI source. The ESI voltage was set to 1.6 kV, and capillary temperature was 300°C. TMT reporter ions were generated in the HCD cell with the normalized collisional energy set to 85%, which was found to achieve the highest yield of reporter ions. The activation time was set to 0.100 seconds. The instrument was operated in data dependent acquisition (DDA) mode, the 8 most abundant precursor ions from parent ions listed were selected for HCD MS2 analysis. The MS resolution was set to 15,000 (at m/z 400) with a mass range of 600–2,000 m/z and the MS2 resolution was 7,500.
Data Analysis
The acquired data was processed manually using Xcalibur software. The elution times of glycans were determined from t extracted ion chromatograms of precursor ions of the glycan structures. MS2 scans of the precursors during their elution windows were picked out to determine the reporter ion ratios. The intensity of reporter ions at m/z 126.13, 127. 14, 128.14, 129.14, 130. 15 and 131. 15 were recorded, and the ratios of different reporter ions were calculated. The ratios of the reporter ions peak intensities represent the relative abundance ratio of the corresponding N-glycans in the given set of samples. The data could also be automatically analyzed by SimGlycan, which facilitates automatic MS/MS spectrum picking and reporter ion calculation.
Results and Discussion
LC-MS/MS Condition Optimization
Although the hydrophobicity of glycans is increased when labeled with aminoxyTMT reagents, TMT-labeled glycans are still not hydrophobic enough for effective separation on a reversed-phase column, such as C18. Herein, a Hypercarb column with PGC packing material was used to separate the TMT labeled glycans. This is an ideal material for the separation of polar analytes. A Hypercarb column provides high separation efficiency and isomeric information of TMT-labeled glycans due to the unique retention properties of PGC, which is a mixed function of hydrophobic, ionic and steric interactions.39 The optimized LC gradient conditions provided effective separation of both neutral and sialylated glycan structures.
In order to apply this LC-MS/MS method to complex glycan samples, the resolution setting during MS and MS2 is critical. Resolution utilized should resolve precursor ions and allow effective isolation of ions for subsequent tandem MS experiments. Additionally, applied resolution should resolve the reporter ions from interfering adjacent fragment ions and should not dramatically decrease the number of tandem MS acquisitions needed for both detection and quantitation of glycans. High resolution spectra are attained using long scan times which restrict the number of tandem MS experiments. This aspect is critical in the case of complex biological samples. A resolution of 15,000 in MS was determined to be adequate to provide accurate detection within 5 ppm, while a resolution of 7,500 was determined to be sufficient to resolve reporter ions from some typical glycan oxonium ions detected within the 126–131 m/z range. For example, a fragment ion at m/z value of 126.0550 is an oxonium ion originating from a HexNAc moiety ([HexNAc-C2H6O3]+). This oxonium ion interferes with the aminoxyTMT6-126 reporter ion detected at m/z 126.1277 (see Figure 2). Adequate resolution of these two ions is attainable at a resolution greater than 2,000. Therefore, the use of a resolution of 7,500 is more than adequate as illustrated in Figure 2. Meanwhile, utilizing a predetermined target list is helpful in avoiding wasting scans on non-glycan ions, which are inevitable in the sample matrix when glycans are derived from complex biological samples. A series of HCD collisional energies were tested, and the highest reporter ion yields were achieved at 85% HCD collision energy (Figure S1).
Figure 2.

(A) Extracted ion chromatograms of precursor ions for all six glycan structures in fetuin from bovine serum. (B) MS spectrum for the biantennary disialylated glycan. (C) MS2 spectrum of the biantennary disialylated glycan. Symbols:
 , N-acetylglucosamine (GlcNAc);
 , Galactose (Gal);
 , Fucose (Fuc);
 , Mannose (Man);
 , Glucose (Glc);
 , N-acetylneuraminic acid (NeuAc/Sialic Acid);
 , N-glycolylneuraminic acid (NeuGc).
Quantitative Analysis of N-glycans Derived from Model Glycoproteins
LC-MS/MS sixplex quantitation using aminoxyTMT was first evaluated using N-glycans derived from RNase B and bovine serum fetuin. Purified N-glycans derived from fetuin were divided into six equal aliquotes. Each aliquot was labeled with a TMT reagent, including aminoxyTMT6-126 to aminooxyTMT6-131. Each TMT reagent yields a reporter ion in MS2 with a unique theoretical m/z value, including 126.1277, 127.1248, 128.1344, 129.1315, 130.1411 and 131.1382. After labeling with the six aminoxyTMT reagents, derivatized samples were mixed together in a 1:1:1:1:1:1 ratio then subjected to LC-MS/MS analysis. Extracted ion chromatograms (XICs) of precursor ions exhibited good separation of all fetuin sialylated N-glycans (Figure 2a). TMT labeled glycans appeared in the fully protonated form in the MS spectrum (Figure 2b). In the MS2 spectrum of a biantennary disialylated glycan, all six reporter ions can be observed in a 1:1:1:1:1:1 ratio with less-than-10% variation, indicating the reliability of utilizing the reporter ion for relative quantitation (Figure 2c). An interfering fragment ion with an m/z value of 126.0541, originating from the fragmentation of HexNAc, was well resolved from the reporter ions of aminoxyTMT (Figure 2c). However, not all reporter ions associated with the fetuin triantennary trisialylated glycan can be observed in the MS2 spectra, and the ratios of the reporter ions were not 1:1 (Figure S2). Although the XICs of the triantennary trisialylated glycan depicted high precursor ion intensity, the reporter ions were poor. This fact suggests that the fragmentation of glycan structures directly influences the formation of the reporter ions rather than the ionization efficiency of precursor ions.
A similar issue was also observed in the case of glycans derived from RNase B; the MS2 spectrum of Man5 GlcNAc2 exhibited all reporter ions with a close to 1:1:1:1:1:1 ratio (Figure S3 insets); however, some reporter ion peaks disappeared in the MS2 spectrum of Man9 GlcNAc2 (Figure S3 insets). A possible reason for this issue is the fact that the report ion bond of the mass tag is stronger than the glycosidic bonds. When molecular weight increases as glycans become more branched, the collision energy is not effectively transferred to the reporter ion bond, resulting in the low yield of reporter ions. This explanation appears to be true in the case of other reducing-end-modified isobaric tags utilized for glycan quantitation.37
This issue can be overcome by employing one of several possible approaches. One approach is to subject the fragment ions generated at the MS2 level to additional tandem MS experiments (MSn). For example, conducting MS3 fragmentation of the Y1 ion produced in the MS2 spectrum. However, selecting ions from HCD for MS3 requires the movement of fragment ions from the HCD cell to the ion-trap. This capability is only attainable using advanced MS instruments. Here, we applied a solution which does not involve the utilization of an advanced MS instrument. The influence of metal ion adducts in the MS2 fragmentation of oligosaccharides has been well studied in glycan structural elucidation.40 We spiked TMT-labeled glycan samples with 0.2 M NaCl solution. As a result, several adduct forms of the glycans were observed, including fully protonated, and sodiated with one,two or three sodium ions (Figure 3a). The intensities of the three sodiated precursor ions were somewhat similar, but the reporter ion intensities generated from all adducts were quite different. The reporter ion intensity produced by adducts with two sodium ions was 40 times higher than that produced by fully protonated precursor ions, indicating that the reporter ion fragmentation efficiency was improved significantly for sodiated adducts (see Figure 3b–d). The comparison between reporter ion and the oxonium ion originating from HexNAc ([HexNAc-CH6O3]+) also demonstrated the fact that more energy was efficiently transferred to break the reporter ion bond in sodiated precursor ions. During our study NaCl was only spiked into sample vials rather than into LC mobile phase solvents, avoiding the influence of salts on ESI and the inconvenience of switching mobile phases. However, it should be noted that this causes precursor ions to be detected as multiple sodium adducts, resulting in reduced analysis sensitivity and increased spectrum complexity. In the analysis of glycans derived from RNase B, all 1:1 ratio reporter ions can be observed for all 5 high mannose structures, indicating this is an efficient solution to the issue of low reporter ion yield for highly branched structures (Figure S4). To further verify the reliability of TMT quantitation, samples of RNase B glycans were prepared at different ratios, including 1:2:3:4:5:6, 6:5:4:3:2:1 and 1:2:3:3:2:1. The reporter ion ratios in MS2 were highly consistent with the theoretical ratios (Figure 4). The standard deviations for all ratios were within 10%.
Figure 3.

Mass Spectrum and tandem mass spectra of aminoxyTMT™ labeled triantennary trisialylated glycan showing different precursor ion adducts and corresponding report ions. Symbols: as in Figure 2.
Figure 4.

Tandem mass spectra of aminoxyTMT™ labeled Man5 GlcNAc2 glycan, mixed at theoretical ratios of (a) 1:2:3:4:5:6, (b) 6:5:4:3:2:1 and (c) 1:2:3:3:2:1. Symbols: as in Figure 2.
Quantitative Analysis of N-glycans Derived from Human Blood Serum
Human blood serum, a complex sample matrix, contains more than 100 types of glycans. The use of chromatographic separation is critical for the analysis of such complex samples. Reliable quantitation of 44 glycans with a relative standard deviation (RSD) of ca. 10% was achieved by LC-MS/MS analysis of pooled human blood serum labeled with TMT sixplex reagents, resuspended in 0.2M NaCl and mixed at 1:1:1:1:1:1 ratios (Table S1). This is the largest number of glycans that has been detected and quantified in a single LC-MS run using multiplex isobaric tags.37 Three analyses were conducted, during which 4 classes of N-glycans were quantified, and run to run variation was less than 5%. Five glycan structures were high mannose type, with an average RSD of 9.7%. Eighteen glycans belonged to biantennary complex type, the average RSD for these structures was found to be 9.9%. Another 18 structures were assigned as the triantennary complex type and showed 10.4% average RSD. Three tetra-antennary glycans were also detected, and the RSD of these structures was 12%. These results demonstrate the reliability of utilizing aminoxyTMT™ reagent in the analysis of biological samples where a variety of glycans are present in a complex sample matrix.
Quantitative Analysis of N-glycans Derived from Blood Serum of Patients with Different Esophageal Diseases
In order to test the performance of aminoxy TMTs for biologically relevant samples blood serum of patients with different esophageal diseases, including EAC, BE and HGDwere analyzed. Each disease type was pooled from 10 male patients with ages from 45 to 65. Pooled blood serum of sex- and age-matched disease-free subjects was also included as a control. HGD refers to the precancerous changes of esophageal cells; it is a critical step in the development of BE to invasive EAC.41 Comparing the quantitative glycomic profiles of these diseases with disease-free profiles may reveal the functions of glycans in the development of esophageal diseases; thus, enabling the identification of potential glycomic biomarker candidates. Here, glycans derived from disease free individuals were labeled by aminooxyTMT6-126, aminooxyTMT6-127 corresponded to EAC, glycans of BE were labeled by aminooxyTMT6-128 and glycans of HGD were labeled by aminooxyTMT6-129. The four different samples were mixed in a 1:1 ratio and analyzed simultaneously; the MS2 spectrum provided an intuitive comparison of glycan expression in the various diseases, increasing sample analysis and data processing speed.
When the MS2 spectrums were examined closely, several observations were noted (Figure 5 and Table S2). For example, high mannose glycans derived from all three diseased samples were under expressed compared to the disease free sample (Figure 5a and b). Some monosialylated glycans derived from patients with EAC were under expressed compared with the other diseases (Figure 5c and d). On the other hand, tri-sialylated glycans derived from blood serum of EAC patients showed a higher intensity than those derived from BE and HGD (Figure 5e and f). Table S2 summarizes the results demonstrating 16 glycans with significant differences between disease cases and disease free cases. Although more experiments are required to verify these potential glycan biomarkers, this study demonstrates the capability of aminoxyTMT™ for the rapid screening of up- or down-regulated glycans.
Figure 5.

Tandem mass spectra of different aminoxyTMT™ labeled glycans derived from blood serum of patients with various esophageal diseases. MS/MS spectra for various glycan structures are shown in (a–f). Symbols: as in Figure 2.
Quantitative Analysis of N-glycans Derived from Different Cancer Cell Lines
Multiplexing through aminoxyTMT is also applicable for the analysis of glycans released from cell lines. We have employed 4 breast cancer cell lines, 1 brain cancer cell line and 1 brain-metastatic subline of MDA-MB-231 in this analysis to investigate the relationship between cell glycosylation and their brain metastasis capability. The detailed description of cancer cell lines can be found in Table S2. Six different cell lines were labeled by aminoxyTMT6-126 to 131 and analyzed by tandem MS. In each injection, glycans released from 50 μg of extracted protein from cell lysate were included. Glycan signal intensities comparable to those detected in the blood serum analysis were observed. Man5 GlcNAc2 released from brain metastatic cell line MDA-MB-231Br was detected at a level approximately 50% higher than that found in the other cell lines (Figure 6a). Man6 GlcNAc2 was observed to be down-regulated for the cell lines MDA-MB-361 and CRL-1620 (Figure 6b). For the complex-type glycan structure in Figure 6c, MDA-MB-231Br and MDA-MB-361 exhibited significantly higher expression. However, more interfering ions were observed in the reporter ion range during MS2 because of increased sample matrix complexity. For example, an ion at m/z 129 interfered with the reporter ion of aminoxyTMT6-129 in the analysis of biantennary bi-sialylated glycans and fucosylated structures (Figure 6d–f). Hence, extensive sample purification is necessary for the analysis of cell lines or tissue samples using aminoxyTMT. Despite the interfering ions, the over expression of the three glycan structures depicted in Figure 6d–f was detectable in the cell line MDA-MB-231Br. In total 17 glycan structures released from cell lines were quantified through tandem MS using aminoxyTMT (Table S4), this number is smaller than the number of identified glycans using other non-multiplexed methods such as permethylation. Although multiplexed analysis using aminoxyTMT is efficient and reliable, it is not the most sensitive quantitative glycomic strategy.
Figure 6.

Tandem mass spectra of different aminoxyTMT™ labeled glycans derived from various cell lines. (Detailed information about the cancer cells analyzed are summarized in Table S3). MS/MS spectra for various glycan structures are shown in (a–f). Symbols: as in Figure 2.
Conclusion
LC-MS/MS quantitation using aminoxyTMT is an effective and dependable method for quantitative glycomic studies. The labeling process was fast and convenient, especially when on-line purification was utilized to increase throughput. Introducing sodium adducts solved the issue of low reporter ion yield in highly branched N-glycan structures. This strategy along with optimized LC and MS conditions enabled simultaneous analysis of six different complex biological samples containing more than 40 different glycans in one run. This is the highest number of samples ever reported to have been quantified simultaneously in glycomics. These applications of the aminoxyTMT quantitative method demonstrate the potential of utilizing this approach in biomarker discovery.
Supplementary Material
Acknowledgments
This work was supported by NIH grant (1R01GM112490-01) and CPRIT (RP130624). We acknowledge Dr. Zane Hammoud from Henry Ford Hospital, Detroit, MA, for providing the blood serum of esophageal disease patients; and Thermo Scientific for providing the AminoxyTMT™ reagents.
References
- 1.Helenius A, Aebi M. Science. 2001;291:2364–2369. doi: 10.1126/science.291.5512.2364. [DOI] [PubMed] [Google Scholar]
- 2.Rudd PM, Woods RJ, Wormald MR, Opdenakker G, Downing AK, Campbell ID, Dwek RA. Biochem Biophys Acta. 1995;1248:1–10. doi: 10.1016/0167-4838(94)00230-e. [DOI] [PubMed] [Google Scholar]
- 3.Rudd PM, Wormald MR, Stanfield RL, Huang M, Mattson N, Speir JA, DiGennaro JA, Fetrow JS, Dwek RA, Wilson IA. J Mol Biol. 1999;293:351–366. doi: 10.1006/jmbi.1999.3104. [DOI] [PubMed] [Google Scholar]
- 4.Varki A. Glycobiology. 1993;3:97–130. doi: 10.1093/glycob/3.2.97. [DOI] [PMC free article] [PubMed] [Google Scholar]
- 5.Iida J, Meijne AML, Knutson JR, Furcht LT, McCarthy JB. Semin Cancer Biol. 1996;7:155–162. doi: 10.1006/scbi.1996.0021. [DOI] [PubMed] [Google Scholar]
- 6.Reitter JN, Means RE, Desrosiers RC. Nat Med. 1998;4:679–684. doi: 10.1038/nm0698-679. [DOI] [PubMed] [Google Scholar]
- 7.Dennis JW, Granovsky M, Warren CE. Bioassays. 1999;21:412–421. doi: 10.1002/(SICI)1521-1878(199905)21:5<412::AID-BIES8>3.0.CO;2-5. [DOI] [PubMed] [Google Scholar]
- 8.Lowe JB, Marth JD. Annu Rev Biochem. 2003;72:643–691. doi: 10.1146/annurev.biochem.72.121801.161809. [DOI] [PubMed] [Google Scholar]
- 9.Mechref Y, Hu Y, Garcia A, Zhou S, Desantos-Garcia JL, Hussein A. Bioanalysis. 2012;4:2457–2469. doi: 10.4155/bio.12.246. [DOI] [PMC free article] [PubMed] [Google Scholar]
- 10.Mechref Y, Hu Y, Garcia A, HA Electrophoresis. 2012;33:1755–1767. doi: 10.1002/elps.201100715. [DOI] [PMC free article] [PubMed] [Google Scholar]
- 11.Tao SJ, Huang YN, Boyes BE, Orlando R. Anal Chem. 2014;86:10584–10590. doi: 10.1021/ac5020996. [DOI] [PMC free article] [PubMed] [Google Scholar]
- 12.Zhou SY, Hu YL, DeSantos-Garcia JL, Mechref Y. J Am Soc Mass Spectr. 2015;26:596–603. doi: 10.1007/s13361-014-1054-1. [DOI] [PMC free article] [PubMed] [Google Scholar]
- 13.Mechref Y, Hu YL, Desantos-Garcia JL, Hussein A, Tang HX. Mol Cell Proteomics. 2013;12:874–884. doi: 10.1074/mcp.R112.026310. [DOI] [PMC free article] [PubMed] [Google Scholar]
- 14.Mechref Y, Zhou S, Hu Y, Hussein A, Tang H. Encyclopedia of Analytical Chemistry. John Wiley & Sons, Ltd; Hoboken, NJ: 2006. [Google Scholar]
- 15.Atwood JA, III, Cheng L, Alvarez-Manilla G, Warren NL, York WS, Orlando R. J Proteome Res. 2008;7:367–374. doi: 10.1021/pr070476i. [DOI] [PubMed] [Google Scholar]
- 16.Kang P, Mechref Y, Kyselova Z, Goetz JA, Novotny MV. Anal Chem. 2007;79:6064–6073. doi: 10.1021/ac062098r. [DOI] [PubMed] [Google Scholar]
- 17.Hu Y, Desantos-Garcia JL, Mechref Y. Rapid Commun Mass Spectrom. 2013;27:865–877. doi: 10.1002/rcm.6512. [DOI] [PMC free article] [PubMed] [Google Scholar]
- 18.Yuan J, Hashii N, Kawasaki N, Itoh S, Kawanishi T, Hayakawa T. J Chromatogr A. 2005;1067:145–152. doi: 10.1016/j.chroma.2004.11.070. [DOI] [PubMed] [Google Scholar]
- 19.Hitchcock AM, Costello CE, Zaia J. Biochemistry. 2006;45:2350–2361. doi: 10.1021/bi052100t. [DOI] [PMC free article] [PubMed] [Google Scholar]
- 20.Hitchcock AM, Yates KE, Shortkroff S, Costello CE, Zaia J. Glycobiology. 2006;17:25–35. doi: 10.1093/glycob/cwl046. [DOI] [PMC free article] [PubMed] [Google Scholar]
- 21.Prien JM, Prater BD, Qin Q, Corckrill SL. Anal Chem. 2010;82:1498–1508. doi: 10.1021/ac902617t. [DOI] [PubMed] [Google Scholar]
- 22.Walker SH, Taylor AD, Muddiman DC. J Am Soc Mass Spectr. 2013;24:1376–1384. doi: 10.1007/s13361-013-0681-2. [DOI] [PMC free article] [PubMed] [Google Scholar]
- 23.Walker SH, Budhathoki-Uprety J, Novak BM, Muddiman DC. Anal Chem. 2011;83:6738–6745. doi: 10.1021/ac201376q. [DOI] [PMC free article] [PubMed] [Google Scholar]
- 24.Walker SH, Lilley LM, Enamorado MF, Comins DL, Muddiman DC. J Am Soc Mass Spectr. 2011;22:1309–1317. doi: 10.1007/s13361-011-0140-x. [DOI] [PMC free article] [PubMed] [Google Scholar]
- 25.Walker SH, Carlisle BC, Muddiman DC. Anal Chem. 2012;84:8198–8206. doi: 10.1021/ac3012494. [DOI] [PMC free article] [PubMed] [Google Scholar]
- 26.Williams TI, Saggese DA, Toups KL, Frahm JL, An HJ, Li BS, Lebrilla CB, Muddiman DC. J Mass Spectrom. 2008;43:1215–1223. doi: 10.1002/jms.1398. [DOI] [PMC free article] [PubMed] [Google Scholar]
- 27.Walker SH, Taylor AD, Muddiman DC. Rapid Commun Mass Sp. 2013;27:1354–1358. doi: 10.1002/rcm.6579. [DOI] [PMC free article] [PubMed] [Google Scholar]
- 28.Walker SH, Muddiman DC. Nanomedicine and Cancer. CRC Press; Boca Raton, FL: 2011. p. 307. [Google Scholar]
- 29.Bowman MJ, Zaia J. Anal Chem. 2007;79:5777–5784. doi: 10.1021/ac070581b. [DOI] [PMC free article] [PubMed] [Google Scholar]
- 30.Bowman MJ, Zaia J. Anal Chem. 2010;82:3023–3031. doi: 10.1021/ac100108w. [DOI] [PMC free article] [PubMed] [Google Scholar]
- 31.Werner T, Becher I, Sweetman G, Doce C, Savitski MM, Bantscheff M. Anal Chem. 2012;84:7188–7194. doi: 10.1021/ac301553x. [DOI] [PubMed] [Google Scholar]
- 32.Byers HL, Campbell J, van Ulsen P, Tommassen J, Ward MA, Schulz-Knappe P, Prinz T, Kuhn K. J Protemics. 2009;73:231–239. doi: 10.1016/j.jprot.2009.09.002. [DOI] [PubMed] [Google Scholar]
- 33.Pichler P, Kocher T, Holzmann J, Mohring T, Ammerer G, Mechtler K. Anal Chem. 2011;83:1469–1474. doi: 10.1021/ac102265w. [DOI] [PMC free article] [PubMed] [Google Scholar]
- 34.Christoforou AL, Lilley KS. Anal Bioanal Chem. 2012;404:1029–1037. doi: 10.1007/s00216-012-6012-9. [DOI] [PubMed] [Google Scholar]
- 35.Ting L, Rad R, Gygi SP, Haas W. Nat Methods. 2011;8:937–940. doi: 10.1038/nmeth.1714. [DOI] [PMC free article] [PubMed] [Google Scholar]
- 36.Hahne H, Neubert P, Kuhn K, Etienne C, Bomgarden R, Rogers JC, Kuster B. Anal Chem. 2012;84:3716–3724. doi: 10.1021/ac300197c. [DOI] [PubMed] [Google Scholar]
- 37.Yang S, Yuan W, Yang W, Zhou J, Harlan R, Edwards J, Li S, Zhang H. Anal Chem. 2013;85:8188–8195. doi: 10.1021/ac401226d. [DOI] [PMC free article] [PubMed] [Google Scholar]
- 38.DeSantos-Garcia JLK, Hussein SI, Mechref AY. Electrophoresis. 2011;32 doi: 10.1002/elps.201100378. [DOI] [PMC free article] [PubMed] [Google Scholar]
- 39.Ross P. LC-GC Europe. 2000;5:13. [Google Scholar]
- 40.Harvey DJ. J Mass Spectrom. 2000;35:1178–1190. doi: 10.1002/1096-9888(200010)35:10<1178::AID-JMS46>3.0.CO;2-F. [DOI] [PubMed] [Google Scholar]
- 41.Lekakos L, Karidis NP, Dimitroulis D, Tsigris C, Kouraklis G, Nikiteas N. World J Gastroentero. 2011;17:4174–4183. doi: 10.3748/wjg.v17.i37.4174. [DOI] [PMC free article] [PubMed] [Google Scholar]
Associated Data
This section collects any data citations, data availability statements, or supplementary materials included in this article.