Abstract
Background
Ewing sarcoma is a cancer of bone and soft tissue. Despite aggressive treatment, survival remains poor, particularly in patients with metastatic disease. Failure to treat Ewing sarcoma is due to the lack of understanding of the molecular pathways that regulate metastasis. In addition, no molecular prognostic markers have been identified for Ewing sarcoma to risk stratify patients.
Procedure
Ewing sarcoma patients were divided into high or low Twist1 gene expression and survival curves were generated using the R2 microarray-based Genomic Analysis platform (http://r2.amc.nl). Tumors from Ewing sarcoma patients were also evaluated for TWIST1 expression by immunohistochemistry. Ewing sarcoma xenografts were established to evaluate the role of TWIST1 in metastasis. The effects of Twist1 on migration and invasion were evaluated using migration and invasion assays in A673 and RDES cells.
Results
Twist1 expression was a negative prognostic marker for overall survival in a public Ewing sarcoma patient dataset based on Twist1 mRNA levels and in patient tumor samples based on Twist1 immunohistochemistry. TWIST1 is detected in significantly higher percentage of patients with metastatic diseases than localized disease. Using Ewing sarcoma tumor xenografts in mice, we found suppressing TWIST1 levels suppressed metastasis without affecting primary tumor development. Knockdown of Twist1 inhibited the migration and invasion capability, while overexpression of Twist1 promoted migration and invasion in Ewing sarcoma cells.
Conclusion
These results suggest that TWIST1 promotes metastasis in Ewing sarcoma and could be used as a prognostic marker for treatment stratification, however further validation is required in a larger cohort of patients.
Keywords: Ewing Sarcoma, metastasis, TWIST1
INTRODUCTION
Ewing sarcoma family of tumors is a group of poorly differentiated malignant cancers of bone and soft tissue. The overall 5-year disease-free survival for localized Ewing sarcoma treated with surgery, radiation therapy, and multi-agent chemotherapy is approximately 70%1,2. In contrast, patients with metastases have a 5-year survival rate of approximately 20-30%, despite aggressive multi-modal therapy2,3. Over the last 30 years only minor progress has been made in the treatment of Ewing sarcoma particularly for metastatic disease4. Majority of the deaths from Ewing sarcoma are due to metastasis, which makes blocking metastasis crucial for effective treatment5. These therapies will only be possible once we have a better molecular understanding of the pathogenic mechanism of metastatic spread.
In Ewing sarcoma the EWS-ETS gene fusion is the primary mechanism promoting tumorigenesis and also plays a role in metastasis6,7. The EWS-ETS fusion gene is thought to promote metastasis through decreased cellular adhesions rather than promoting cell migration and invasion8. This passive dissemination of cancer cells can occur because the primary cancer site is often bone where the marrow space would promote passive transfer into the circulation. However, this does not explain how soft tissue Ewing sarcoma metastasize nor how the cells colonize secondary sites. In fact EWS/FLI knockdown cells tend to seed the lung better than their parental cells with EWS/FLI expression8. This leads us to believe that metastasis requires more than the EWS/FLI gene fusion and more research is needed to better understand the mechanism of metastasis in Ewing sarcoma.
The origin of Ewing sarcoma cells also remains difficult to identify given the nature of the poorly differentiated cells. Several studies indicate that there is a high similarity in gene expression signatures between Ewing sarcoma and fetal and neuronal tissues9–11. Some reports suggest that Ewing sarcoma cell lineage could be traced back to neural crest cells10,11. Neural crest cells are highly motile cells that migrate throughout the body to form bone, soft tissues, and other tissues during embryogenesis. Twist1 transcription factor plays a major role in regulating cell movement and tissue reorganization during neural crestdevelopment12,13. The extensive cell migration during embryogenesis shares many similarities with tumor cell invasion and metastasis14. A number of previous studies have demonstrated a critical role of Twist1 in driving tumor metastasis in breast cancer and skin cancer models12,15. Many studies have also shown Twist1 expression was associated with aggressive human cancers including melanomas and neuroblastoma16,17, both of which originate from the neural crest.
ZEB2 transcription factor, like Twist1, is also involved in normal neural crest development. Higher levels of ZEB2 expression has already been shown to correlate with increased patient metastasis in Ewing sarcoma18. EWS/FLI is reported to prevent mesenchymal differentiation while ZEB2 prevents epithelial differentiation18. This results in Ewing sarcoma cell possessing both epithelial and mesenchymal characteristics, thus promoting both primary tumor growth and metastasis.
The role of Twist1 and Zeb2 in tumor metastasis have been largely contributed to their ability to induce epithelial to mesenchymal transition (EMT), thus allowing carcinoma cell dissemination from primary tumor to distant organs15. Although Ewing sarcoma is not an epithelial tumor and may have a unique mode of metastasis separate from that of epithelial derived carcinomas19,20, they could still use similar cellular machineries for migration and invasion that are activated by Twist1 and Zeb2 to promote neural crest cell formation.
Given the similarity of Ewing sarcoma to fetal and neural tissues, we hypothesize that genes regulating neural crest cells migration are reactivated to allow Ewing sarcoma cells to metastasize. In this study, we test the hypothesis that Twist1, a regulator of neural crest development, plays a critical role in metastatic Ewing sarcoma.
Material and Methods
Ewing Sarcoma Patient Tumor Samples
We used microarray analysis results for Ewing sarcoma patient tumor samples from the R2 Genomics Analysis and Visualization platform (http://r2.amc.nl). The Dirksen and Savola database was used for analysis of Twist1 gene expression for overall and event-free survival. The “Kaplan Scan” feature on the R2 platform was used to separate each database into two groups based on Twist1 gene expression and to create a Kaplan Meier curves based on the log-rank test. The “Kaplan Scan” uses statistical testing instead of an average or median expression cutoff to separate into a high or low Twist1 expressing group. The same high/low groups established using the “Kaplan Scan” method for overall survival was used to analyze event free survival.
Ewing sarcoma patient samples were also obtained through the Pediatric Hematology/Oncology and Pathology departments at Rady Children’s Hospital San Diego (RCHSD) and Children’s Hospital of Orange County (CHOC). The patient tumor samples were collected between 1998 and 2015. IRB approval was obtained from the University of California, San Diego Human Research Protections Program. Patients samples were provided in paraffin embedded blocks or slides. The pediatric oncology department provided de-identified patient information including age, site of primary tumor, metastasis, and survival data. Retrospective evaluation of patient samples was used as part of this study. IRB waiver was obtained to collect these samples without prior patient consents. Patients were also approached prospectively and patient consent was obtained prior to diagnostic or treatment related surgery. Both primary and metastatic tissue at diagnosis and relapse were collected for this study.
Immunohistochemistry
5 μm serial sections of paraffin embedded patient samples were rehydrated through xylene and graded alcohols. Antigen retrieval was used using a pressure cooker and Diva Decloaker (Biocare, Concord CA). Endogenous avidin/biotin were blocked using Vector Avidin/Biotin blocking kit. Primary antibodies were incubated overnight at 4°C. Biotinylated secondary antibody and Vectorstain ABC kit were used prior to development with DAB chromogen (Vector labs, Burlingame, CA). A pediatric pathologist who was blinded to patient clinical data independently quantified IHC protein expression. Patient samples were considered positive for Twist1 expression only if >25% of tumor cells in the primary tumor stained positive for Twist1. EWS rearrangement data was not available but slides were reviewed by a pediatric pathologist to ensure samples were consistent with a Ewing sarcoma diagnosis.
Cell lines and Cell Culture
TC32, TC71, A673, EWS-502, RD-ES, and SK-N-MC human Ewing sarcoma cell lines were obtained from Dr. Alejandro Sweet-Cordero (Stanford) and from the Children’s Oncology Group. A673 cells were grown in DMEM supplemented with 10% FBS. HMLE cells, human mammary epithelial cells, were obtained from Dr. Weinberg (Whitehead Institute) and were grown in 1:1 mixtures of MEGM Bullet kit (Lonza) and DMEM/F12 (Cellgro) supplemented with Insulin (10ug/mL), human EGF (10ng/mL), L-glutamine (1.2g/mL) and hydrocortisone (0.5ug/mL). All cell lines were grown to maximum 80% confluency before passaging.
Viral Production and Infection
Stable cell lines were created via infection of target cells using lentiviruses and pWZL-blast retroviruses. 293T cells were seeded at 1×10⁶ cells per 6cm dish in DMEM/10%FBS. After 18 hours, cells were transfected as follows: 6μL TransIT-LT1 (Mirus Bio) was added to 150 μL DMEM and incubated 20 minutes. 1μg of viral vector along with 0.9μg of gag/pol expression vector (pCMV 8.2R for lentivirus; PUMCV3 for retrovirus) and 0.1μg VSVG expression vector were then added to the DMEM/LT-1 mixture. The mixture was incubated 30 minutes and then added to 293T cells overnight. Next day fresh media were added to the transfected 293T cells. Viral supernatant was harvested at 48 and 72 hours post transfection, filtered, and added to the recipient cell lines with 6 μg/ml protamine sulfate for 4 hours infection. A673 cells were then selected with 6 μg/ml puromycin. RDES cells were selected with 7ug/ml blasticidin.
Plasmids
The shTwist3 and shTwist7 pSP108 lentiviral constructs and theTwist1 cDNA in pWZL-Blast (pWB) retroviral vector have been previously described12,14. The pWZL-Blast-GFP vector was obtained from Addgene. A non-target coding (NTC) siRNA oligo was used as control. The NTC sequence is not known to match any human coding cDNA. The NTC sequence was 5′ CCGGGCGCGATAGCGCTAATAATTTCTCGAGAAATTATTAGCGCTATCGCGCTTTTT-3′. To generate green fluorescent protein (GFP)–expressing cells, we co-infected the cells with PRRL-GFP vectors. The infection rate of the lentivirus, determined by fluorescence, was greater than 90%.
Tumor Xenograft Model
All animal care and experiments were approved by the Institutional Animal Care and Use Committee of the University of California, San Diego. GFP tagged A673 or TC32 cells were virally infected with either control (NCT) shRNA or Twist1 shRNA. The cells were selected with puromycin then resuspended in 50% PBS/ 50% matrigel. 50ul containing 250,000 A673 or TC32 cells were injected intramuscularly into the gastrocnemius muscles of 8 week old nude mice (NU/J strain from the Jackson Laboratory) using a 30 gauge needle. There were 3 cohorts with 10 mice in each for a total of 30 mice for the A673 cells. For the TC32 cells we had 3 cohorts with 5 mice in each for a total of 15 mice. Mice were monitored weekly until visible or palpable tumor growth then monitored at least twice weekly until tumors measured >1.5cm in diameter. Once tumor >1.5cm they were monitored daily and sacrificed once tumors grew to 2 cm in diameter. The tumors grew in the mice for 4-6 weeks. Primary tumors were dissected and weighed to calculate the primary tumor burden per mouse. Lungs were imaged under a fluorescence dissection microscope to evaluate metastases. The total number of GFP-positive colonies was quantified using ImageJ. This experiment was repeated three times with the A673 cells and two times for the TC32.
Migration and Invasion Assay
In the migration assay of A673 cell lines, 250 μL of the cell suspension (100,000 cells/100 μL) was added to the upper chamber of 8-μm pore Transwell inserts (Corning), 750 μL of DMEM medium with 20% FBS was added to the lower chamber. Cells were incubated for 24 h at 37°C. Then non-migrating cells in the upper chamber were removed with a cotton swab, and migrated cells in the lower chamber were fixed in 4% paraformaldehyde and stained with 0.1% crystal violet. In the migration assay of RDES cell lines, 250 μL of the cell suspension (200,000 RDES cells/100 μL) was added to the upper chamber, 750 μL of RPMI-1640 medium with 20% FBS was added to the lower chamber. Cells were incubated for 48 h at 37°C. The remaining steps were the same as migration assay of A673 cell lines.
In the invasion assay, the Transwell membrane was coated with 100 μL of 300μg/mL the matrigel (BD) and incubated at 37°C for 5 hrs. with subsequent aspiration. 250 μL of the A673 or RDES cell suspension (200,000 cells/100 μL) was added to the upper chamber of Transwell inserts. A673 cells were incubated for 24 h and RDES cells were incubated for 48 h at 37°C. The remaining steps were the same as migration assay. The stained cells were observed under microscope (10×, Leica MZ 16F stereomicroscope) and three random chosen fields of one transwell were quantified using ImageJ. Three transwells were used for each cell line. Two to three independent experiments were carried out for each assay.
RESULTS
Expression of TWIST1 is significantly associated with metastatic Ewing Sarcoma
To initially address the involvement of TWIST1 in Ewing sarcoma metastasis, we evaluated the association of Twist1 mRNA expression in Ewing sarcoma tumor samples with patient outcomes using the R2 Genomic Analysis and Visualization platform (http://r2.amc.nl). Microarray-based gene expression analysis of the Dirksen-85 and Savola Ewing sarcoma patient data set was used for analysis21,22. Low/high cut off was established using the Kaplan scan feature of R2 platform. Higher expression of Twist1 was significantly associated with decreased overall survival (Fig. 1A and Fig. 1C). Twist1 expression on Event-free survival was significant in the Dirksen database when using the same low/high groups established for overall free survival analysis (Fig. 1B).
Figure 1. Twist1 mRNA expression correlates with poor outcome in Ewing sarcoma patients.
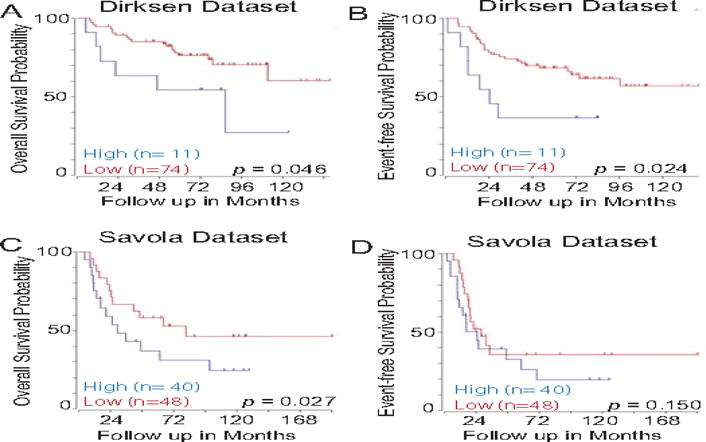
Using the R2 Genomics Analysis and Visualization Platform (http://r2.amc.nl), patients with Ewing sarcoma were divided into high (blue) and low (red) Twist1 expression groups and Kaplan-Meier survival curve were generated. The Dirksen 85 and Savola Ewing sarcoma tumor dataset was used for analysis. Both event-free survival (A and C) and overall survival (B and D) are presented with the number of patients shown in parenthesis.
We further analyzed primary human Ewing sarcoma samples to detect the protein expression of TWIST1, a key regulator of neural crest formation and a key player in metastasis. Forty-one patient samples from RCHSD and CHOC were analyzed for this study using IHC staining for TWIST1 expression. Patient characteristics from RCHSD and CHOC were similar to historical cohorts. There was a slight male predominance and a median age of 11.6 years. However, our cohort had an increased number of patients with metastatic disease at 59% that corresponded with a decreased overall survival compared to historical cohorts (Supplemental Table S1).
All patient tumor tissue was strongly positive for Ewing sarcoma marker CD99, suggesting that the samples were the correct tumor type (Fig. 2A). A pediatric pathologist retrospectively reviewed the patient samples and agreed with the Ewing sarcoma diagnosis. RCHSD and CHOC routinely test for EWS rearrangement to confirm an Ewing sarcoma diagnosis. Prior studies suggests upwards of 95% of Ewing sarcoma patients have an EWS rearrangement detected at diagnosis23,24. However, results on molecular testing for EWS rearrangements were not available for review.
Figure 2. TWIST1 protein is highly upregulated in metastatic Ewing sarcoma.
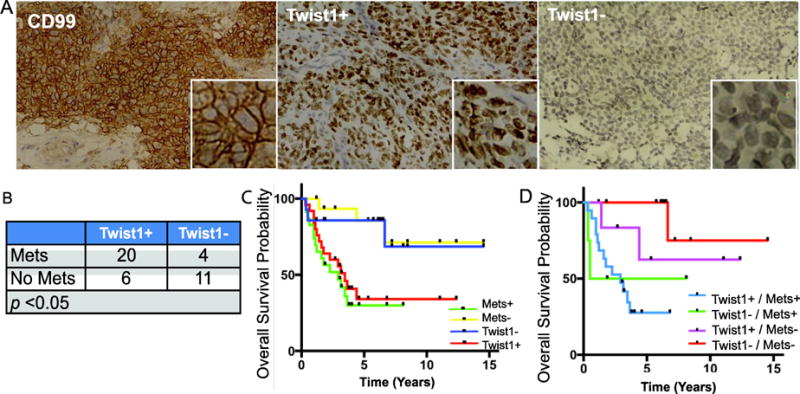
A. A representative image of human Ewing sarcoma tumor sample stained for CD99 (left) with a 32× higher magnified inset. Representative images of human Ewing sarcoma tumor samples stained for TWIST1 positive (middle) vs. TWIST1 negative (right). B. The number of TWIST1+ or TWIST1- patients in localized vs. metastatic Ewing sarcoma p<0.05 C. Kaplan-Meier Curve of overall survival for 37 Ewing sarcoma patients, stratified by TWIST1 expression (p<0.05) and Metastatic disease (p<0.05). D. Kaplan-Meier Curve of overall survival for 37 Ewing sarcoma patients, stratified by metastatic disease status and TWIST1 expression.
Interestingly, 83% (20/24) of tumor samples from patients with metastatic diseases showed strong positive nuclear staining of Twist1 (Fig.2A and 2B). In contrast, only 35% (6/17) of tumor samples from patients with localized tumors showed positive Twist1 staining (Fig. 2B). Furthermore, we found that Twist1 positivity was correlated with poor survival in patients with Ewing sarcoma, consistent with the results from the Dirksen and Savola patient data set (Fig. 2C).
Survival curves based on Twist 1 expression was similar to survival curves based on presence of metastasis (Fig. 2C). Survival curve analysis excluded one patient consented for the study because the survival data was not available. Three other patients died from secondary AML from chemotherapy, which is unlikely related to Twist1 expression, so they were removed from survival analysis. When separating Twist1 expression within the metastatic and non-metastatic group, we noticed that Twist1 expression correlated with worse survival within each group (Fig 2D). The correlation however was not significant due to the small sample size although the results seem to indicate a difference in outcomes. One major clinical obstacle in Ewing sarcoma treatment is the lack of a stratification marker to predict outcome and guide treatment for Ewing sarcoma. It is unclear why some non-metastatic Ewing sarcoma patients subsequently relapse and others have long-term survival. Twist1 expression could potentially identify a high-risk patient group at risk of poorer survival but further validation is required in a larger cohort of patients. These data from human Ewing sarcoma samples indicate a link between upregulation of TWIST1 and Ewing sarcoma metastasis and poor survival outcome.
Twist1 is required for Ewing Sarcoma metastasis
We next tested the biological requirement for Twist1 in mediating Ewing sarcoma tumor cell invasion and metastasis. We first evaluated the expression of Twist1 in a number of established human Ewing sarcoma tumor cell lines, including TC32, TC71, A673, EWS-502, RD-ES, and SK-N-MC. Real-time PCR and western blotting analysis showed that indeed expression of Twist1 mRNA and protein are easily detected in many human Ewing sarcoma cell lines (Fig. 3A and 3B).
Figure 3. Human Ewing Sarcoma cells express Twist1.
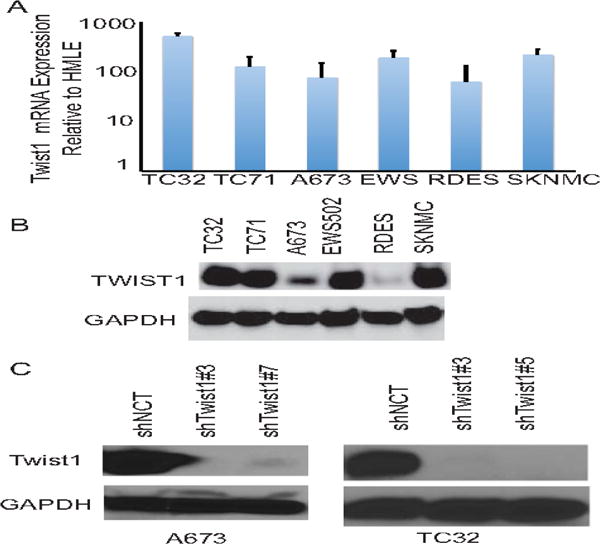
A. Quantitative PCR analysis of Twist1 mRNA expression in Ewing sarcoma cell lines compared to HMLE cells that do not express Twist1. B. Cell lysates from Ewing sarcoma cell lines were analyzed by SDS-PAGE and probed for Twist1 and GAPDH. C. Cell lysates from A673 and TC32 Ewing sarcoma cells expressing control or Twist1 shRNAs were analyzed by SDS-PAGE and probed for Twist1 and GAPDH.
We chose the A673 and TC32 Ewing sarcoma cell lines to establish human Ewing sarcoma xenograft model given their short doubling time, extensive publications using those cell lines as Ewing sarcoma models, and their ability to metastasize in mice. We infected GFP expressing-A673 and TC32 Ewing cells with a lentiviral vector carrying either shRNA against Twist1 (shTwist3, shTwist5, or shTwist7) or a control shRNA (shNCT). Expression of GFP in tumor cells enabled us to detect micrometastases composed of very few tumor cells in the lung. We verified specific knockdown of TWIST1 protein by western blot (Fig. 3C). A673 cells expressing shTwist#3 or shTwist#7 generated primary tumors with similar growth kinetics and similar final weight as the control cells (Fig. 4B). However, mice carrying A673 tumors expressing shRNAs against Twist1 presented significantly fewer lung metastases, average 2 nodules per mice, compared to the control xenografts, average 32 nodules per mice (Fig.4B). IHC for Twist1 in the primary tumor confirm TWIST1 knockdown in the mice (Fig.4A). We obtained similar results for the TC32 cell line (Fig. 4D). Together, these data strongly support the notion that Twist1 is required for Ewing sarcoma metastasis.
Figure 4. Twist1 is required for Ewing Sarcoma metastasis.
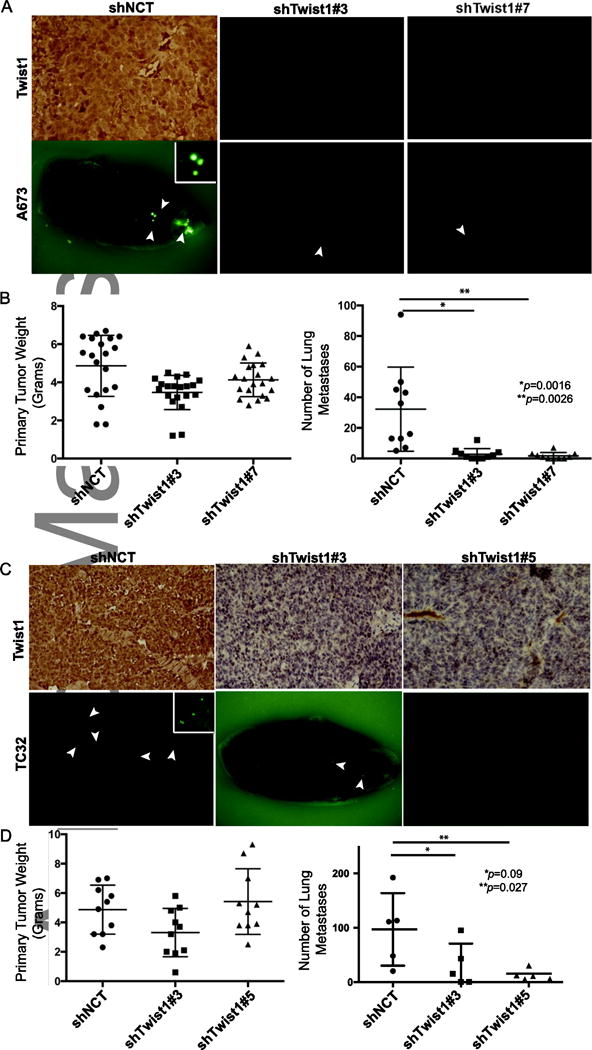
IHC of Twist1 from primary tumors show persistent Twist1 knockdown in the xenograft model in both A673 (A) and TC32 Ewing sarcoma xenografts (C). Fluorescent images of lung metastases from A673 and TC32 xenograft tumors. Arrows point to GFP positive Ewing sarcoma metastases (A and C). B Primary tumor weight of A673 xenograft tumors expressing control or Twist1 shRNAs (p = ns, no significance) Quantification of lung metastases from A673 xenograft tumors (*p< 0.0016, **p<0.0026, T-test, n=10 mice in each group). D. Primary tumor weight of TC32 xenograft tumors expressing control or Twist1 shRNAs (p =ns). Quantification of lung metastases from TC32 xenograft tumors (*p< 0.09, **p<0.027, T-test, n=5 mice in each group).
TWIST1 promote Ewing sarcoma cell migration and invasion
Next, we wanted to determine the effects of Twist1 on the migration and invasion capability of Ewing sarcoma cells. We found that knockdown of Twist1 in A673 cells led to significant decrease in cell migration towards a high serum gradient (Fig 5B). In addition, knockdown of Twist1 also decreased cell invasion through matrigel (Fig 5C). To further generalize the role of Twist1 on migration and invasion, we overexpressed Twist1 in RDES Ewing sarcoma cells. Parental RDES cells have the lowest TWIST1 expression amongst the Ewing sarcoma cells tested (Fig 3A and 3B). We observed that TWIST1 overexpression increased both migration and invasion in RDES cells (Fig. 6B and 6C). Taken together, these results strongly support the notion that TWIST1 promotes Ewing sarcoma cell migration and invasion.
Figure 5. Knockdown of Twist1 inhibits migration and invasion of A673 cells.
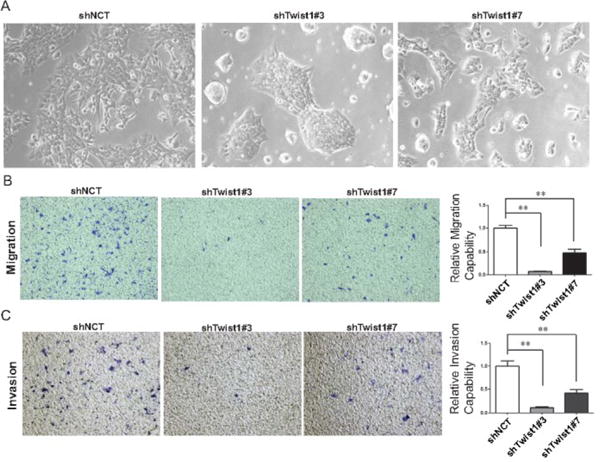
A. Bright-field images of A673 cells expressing shNCT, shTwist1#3 and #7. Migration (B) and invasion (C) assay of A673 cells with shRNAs against Twist1. Representative images of migrated and invasive cells stained with crystal violet and quantification of relative migration and invasion for one representative experiment. Data were presented as mean±SEM. **P<0.01 by ANOVA followed by Bonferroni test.
Figure 6. Twist1 overexpression promotes migration and invasion of RDES cells.
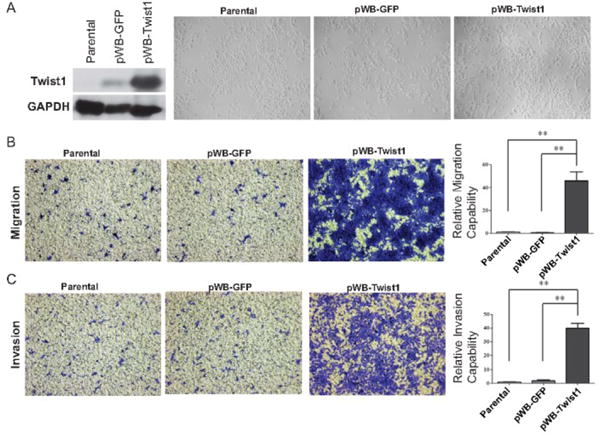
A. Left, lysates from RDES-parental, RDES-GFP and RDES-Twist1 cells were analyzed by SDS-PAGE and probe for Twist1 and GAPDH. Right, bright-field images of RDES cells expressing GFP or Twist1. Migration (B) and invasion (C) assay of RDES-parental, RDES-GFP and RDES-Twist1 cells. Representative images of migrated and invasive cells stained with crystal violet and quantification of relative migration and invasion for one representative experiment. Data were presented as mean±SEM. **P<0.01 by ANOVA followed by Bonferroni test.
DISCUSSION
Prior Ewing studies focused on the characteristic Ewing sarcoma translocation of EWS with a member of the ETS family of genes, most commonly FLI1. The discovery of the EWS-ETS translocation enabled grouping of a spectrum of seemingly diverse tumors with various degrees of neuroectodermal differentiation into a family of tumors: from typical undifferentiated Ewing sarcoma of bone to differentiated primitive neuroectodermal tumors25. The EWS-ETS translocation has been shown to act as determinant of cell lineage. This chimeric fusion gene up-regulates genes important to neural crest development but inhibits terminal differentiation creating an undifferentiated cell with characteristics of both epithelial and mesenchymal tumors10.
Our study suggests that Twist1, normally expressed during neural crest development, is involved in metastasis in Ewing sarcoma by promoting invasion and metastasis. TWIST1 expression correlates with poorer prognosis within the metastatic and non-metastatic patient groups. These results indicate that TWIST1 expression could be used for treatment stratification within the non-metastatic or metastatic groups. Our study however is limited by the small sample size due to the rare incidence of Ewing sarcoma cases. There are only about 200 cases of Ewing sarcoma diagnosed in the US per year. Although the small number of cases show a significant correlation of TWIST1 expression and overall survival the positive predictive value is currently low and could be further improved with larger sample sizes.
Currently, Ewing sarcoma patients are being stratified for treatment purposes solely based on the presence of metastatic lesions. Unfortunately given the rarity of Ewing sarcoma, we will need to rely on data collected from small cohorts to explore new treatment options. Our study suggests that Twist1 expression can stratify patients with localized diseases who are at higher risk for relapse and for those patients, intensified therapy upfront could prevent metastasis and ultimately improve overall survival. As a transcription factor, Twist1 could induce a number of target genes, including Snail226, PDGFRa27, and Akt228. Future studies are needed to evaluate their roles in Ewing sarcoma metastasis and their potential to serve as therapeutic targets to block metastasis.
Future prospective studies are needed to determine if Twist1 expression could be determined in a timely manner to modify treatment plan. A prospective study will also allow comparison of patients treated uniformly with interval compression therapy. Our patient samples were collected as early as 1998 prior to the start of interval compression therapy for Ewing sarcoma in 200129. The small sample size and varied treatments used for our patient cohort may have lead to some sampling bias. Further larger prospective studies looking into Twist1 in Ewing sarcoma is warranted.
Since the most common site of disease recurrence for Ewing sarcoma is the lung, a drug targeting this unique metastatic pathway could be used in conjunction with cytotoxic therapy to prevent lung metastasis. Previous data show that Ewing sarcoma tends to metastasize early and local control alone will not prevent recurrence at distant sites. The addition of targeted therapy against this metastatic pathway instead of additional cytotoxic therapy could minimize long-term sequela of therapy, decrease disease metastasis and recurrence to improve overall survival.
Understanding the mechanism of metastasis in Ewing sarcoma is key to finding targeted therapies that will reduce metastases and improve survival. Our work suggests that Twist1 transcription factor and its key downstream targets could be potential drug targets to inhibit the metastasis program in Ewing sarcoma and other neural crest-derived cancers.
Supplementary Material
Supplemental Table S1: A total of 41 Ewing sarcoma patient samples with corresponding clinical data were collected at RCHSD and CHOC. There was a small difference in male to female patients consistent with historical cohorts. The age distribution was as expected for patients with Ewing sarcoma. There is a higher number of patients presenting with metastasis compared to historical published data which explains the higher percentage of patients who are dead of disease (DOD) compared to published survival data.
Acknowledgments
We thank the members of the Yang lab, especially Leo Lin, Jeff Tsai, and Spencer Wei for technical help. We thank Dr. Peter Zage for critically reading the manuscript and for his advice.
Financial Support: National Institutes of Health, The Hartwell Foundation, St. Baldrick’s Foundation, Seany Foundation, Camden Fund and Hyundai Hope on Wheels
Abbreviation Key
- IHC
Immunohistochemistry
- RCHSD
Rady Children’s Hospital San Diego
- CHOC
Children’s Hospital Orange County
- NTC
Non-target coding
- GFP
Green fluorescent protein
- EMT
Epithelial - mesenchymal transition
- MET
Mesenchymal – epithelial transition
Footnotes
Conflict of Interest Statement: No authors have relevant financial interests or affiliations to disclose.
References
- 1.Grier MD Holcombe E, Krailo PhD Mark D, Tarbell MD Nancy J, Link MD Michael P, Fryer MD Christopher JH, Pritchard MD Douglas J, Gebhardt MD Mark C, Dickman MD Paul S, Perlman MD Elizabeth J, Meyers MD Paul A, Donaldson MD Sarah S, Moore MD Sheila, Rausen MD Aaron R, Vietti MD Teresa J, Miser MD James S. Addition of Ifosfamide and Etoposide to Standard Chemotherapy for Ewing’s Sarcoma and Primitive Neuroectodermal Tumor of Bone.pdf. New England Journal of Medicine. 2003;(348):694–701. doi: 10.1056/NEJMoa020890. [DOI] [PubMed] [Google Scholar]
- 2.Gaspar N, Hawkins DS, Dirksen U, et al. Ewing Sarcoma: Current Management and Future Approaches Through Collaboration. J Clin Oncol. 2015;33(27):3036–46. doi: 10.1200/JCO.2014.59.5256. [DOI] [PubMed] [Google Scholar]
- 3.Ayten Cangir M, Vietti MD Teresa J, Gehan PhD Edmund A, Burgert MD E Omer, Jr, Thomas MD Patrick, Tefft MD Melvin, II, Nesbit MD Mark E, II, Kissane MD John, Pritchard MD Douglas. Ewing’s Sarcoma Metastatic at Diagnosis. Cancer Cell. 1990;(68):887–93. doi: 10.1002/1097-0142(19900901)66:5<887::aid-cncr2820660513>3.0.co;2-r. [DOI] [PubMed] [Google Scholar]
- 4.Gorlick R, Janeway K, Lessnick S, Randall RL, Marina N, Committee COGBT Children’s Oncology Group’s 2013 blueprint for research: bone tumors. Pediatr Blood Cancer. 2013;60(6):1009–15. doi: 10.1002/pbc.24429. [DOI] [PMC free article] [PubMed] [Google Scholar]
- 5.Gupta GP, Massague J. Cancer metastasis: building a framework. Cell. 2006;127(4):679–95. doi: 10.1016/j.cell.2006.11.001. [DOI] [PubMed] [Google Scholar]
- 6.Castillero-Trejo Y, Eliazer S, Xiang L, Richardson JA, Ilaria RL., Jr Expression of the EWS/FLI-1 oncogene in murine primary bone-derived cells Results in EWS/FLI-1-dependent, ewing sarcoma-like tumors. Cancer Res. 2005;65(19):8698–705. doi: 10.1158/0008-5472.CAN-05-1704. [DOI] [PubMed] [Google Scholar]
- 7.Lawlor ER, Sorensen PH. Twenty Years on: What Do We Really Know about Ewing Sarcoma and What Is the Path Forward? Crit Rev Oncog. 2015;20(3–4):155–71. doi: 10.1615/critrevoncog.2015013553. [DOI] [PMC free article] [PubMed] [Google Scholar]
- 8.Chaturvedi A, Hoffman LM, Welm AL, Lessnick SL, Beckerle MC. The EWS/FLI Oncogene Drives Changes in Cellular Morphology, Adhesion, and Migration in Ewing Sarcoma. Genes Cancer. 2012;3(2):102–16. doi: 10.1177/1947601912457024. [DOI] [PMC free article] [PubMed] [Google Scholar]
- 9.Martin S. Staege CH, Ingo Neumann, Sabine Foja, Uwe E. Hattenhorst, Gesine Hansen, Danny Afar, and Stefan E. G. Burdach. DNA Mircoarrays Reveal Relationship of Ewing Family Tumors to both Endothelial and Fetal Neural Crest-derived Cells and Define Novel Targets. Cancer Res. 2004;64:8213–21. doi: 10.1158/0008-5472.CAN-03-4059. [DOI] [PubMed] [Google Scholar]
- 10.Siwen Hu-Lieskovan JZ, Wu Lingtao, Shimada Hiroyuki, Schofield Deborah E, Triche Timothy J. EWS-FLI1 Fusion Protein Up-regulates Critical Genes in Neural Crest Development and is Responsible for the Observed Phenotype of Ewing’s Family of Tumors. Cancer Res. 2005;65:4633–3644. doi: 10.1158/0008-5472.CAN-04-2857. [DOI] [PubMed] [Google Scholar]
- 11.von Levetzow C, Jiang X, Gwye Y, et al. Modeling initiation of Ewing sarcoma in human neural crest cells. PLoS One. 2011;6(4):e19305. doi: 10.1371/journal.pone.0019305. [DOI] [PMC free article] [PubMed] [Google Scholar]
- 12.Yang J, Mani SA, Donaher JL, et al. Twist, a master regulator of morphogenesis, plays an essential role in tumor metastasis. Cell. 2004;117(7):927–39. doi: 10.1016/j.cell.2004.06.006. [DOI] [PubMed] [Google Scholar]
- 13.Yang J, Mani SA, Weinberg RA. Exploring a new twist on tumor metastasis. Cancer Res. 2006;66(9):4549–52. doi: 10.1158/0008-5472.CAN-05-3850. [DOI] [PubMed] [Google Scholar]
- 14.Mani SA, Guo W, Liao MJ, et al. The epithelial-mesenchymal transition generates cells with properties of stem cells. Cell. 2008;133(4):704–15. doi: 10.1016/j.cell.2008.03.027. [DOI] [PMC free article] [PubMed] [Google Scholar]
- 15.Tsai JLD Jeff H, Murphy Danielle A, Chau Sandra, Yang Jing. Spatiotemporal Regulation of Epithelial-Mesenchymal Transition is Essential for Squamous Cell Carcinoma Metastasis. Cancer Cell. 2012:725–36. doi: 10.1016/j.ccr.2012.09.022. [DOI] [PMC free article] [PubMed] [Google Scholar]
- 16.Peinado H, Olmeda D, Cano A. Snail, Zeb and bHLH factors in tumour progression: an alliance against the epithelial phenotype? Nat Rev Cancer. 2007;7(6):415–28. doi: 10.1038/nrc2131. [DOI] [PubMed] [Google Scholar]
- 17.Selmi A, de Saint-Jean M, Jallas AC, et al. TWIST1 is a direct transcriptional target of MYCN and MYC in neuroblastoma. Cancer Lett. 2015;357(1):412–8. doi: 10.1016/j.canlet.2014.11.056. [DOI] [PubMed] [Google Scholar]
- 18.Wiles ET, Bell R, Thomas D, Beckerle M, Lessnick SL. ZEB2 Represses the Epithelial Phenotype and Facilitates Metastasis in Ewing Sarcoma. Genes Cancer. 2013;4(11–12):486–500. doi: 10.1177/1947601913506115. [DOI] [PMC free article] [PubMed] [Google Scholar]
- 19.Wang CC, Schulz MD. Ewing’s sarcoma; a study of fifty cases treated at the Massachusetts General Hospital, 1930-1952 inclusive. N Engl J Med. 1953;248(14):571–6. doi: 10.1056/NEJM195304022481401. [DOI] [PubMed] [Google Scholar]
- 20.Dahlin DC, Coventry MB, Scanlon PW. Ewing’s sarcoma. A critical analysis of 165 cases. J Bone Joint Surg Am. 1961;43-A:185–92. [PubMed] [Google Scholar]
- 21.Savola S, Klami A, Myllykangas S, et al. High Expression of Complement Component 5 (C5) at Tumor Site Associates with Superior Survival in Ewing’s Sarcoma Family of Tumour Patients. ISRN Oncol. 2011;2011:168712. doi: 10.5402/2011/168712. [DOI] [PMC free article] [PubMed] [Google Scholar]
- 22.Volchenboum SL, Andrade J, Huang L, et al. Gene Expression Profiling of Ewing Sarcoma Tumors Reveals the Prognostic Importance of Tumor-Stromal Interactions: A Report from the Children’s Oncology Group. J Pathol Clin Res. 2015;1(2):83–94. doi: 10.1002/cjp2.9. [DOI] [PMC free article] [PubMed] [Google Scholar]
- 23.Balamuth NJ, Womer RB. Ewing’s sarcoma. Lancet Oncol. 2010;11(2):184–92. doi: 10.1016/S1470-2045(09)70286-4. [DOI] [PubMed] [Google Scholar]
- 24.Kelleher FC, Thomas DM. Molecular pathogenesis and targeted therapeutics in Ewing sarcoma/primitive neuroectodermal tumours. Clin Sarcoma Res. 2012;2(1):6. doi: 10.1186/2045-3329-2-6. [DOI] [PMC free article] [PubMed] [Google Scholar]
- 25.Denny AAaC. Biology of EWS:ETS fusions in Ewing’s family tumors. Oncogene. 2001;20:5747–54. doi: 10.1038/sj.onc.1204598. [DOI] [PubMed] [Google Scholar]
- 26.Esmeralda Casas JK, Bendesky Andrés, Ohno-Machado Lucila, Cecily J, Wolfe aJY. Snail2 is an essential mediator of Twist1-induced epithelialmesenchymal transition and metastasis. Cancer Res. 2011;71(1):245–54. doi: 10.1158/0008-5472.CAN-10-2330. [DOI] [PMC free article] [PubMed] [Google Scholar]
- 27.Eckert MA, Lwin TM, Chang AT, et al. Twist1-induced invadopodia formation promotes tumor metastasis. Cancer Cell. 2011;19(3):372–86. doi: 10.1016/j.ccr.2011.01.036. [DOI] [PMC free article] [PubMed] [Google Scholar]
- 28.Cheng GZ, Chan J, Wang Q, Zhang W, Sun CD, Wang LH. Twist transcriptionally up-regulates AKT2 in breast cancer cells leading to increased migration, invasion, and resistance to paclitaxel. Cancer Res. 2007;67(5):1979–87. doi: 10.1158/0008-5472.CAN-06-1479. [DOI] [PubMed] [Google Scholar]
- 29.Womer RB, West DC, Krailo MD, et al. Randomized controlled trial of interval-compressed chemotherapy for the treatment of localized Ewing sarcoma: a report from the Children’s Oncology Group. J Clin Oncol. 2012;30(33):4148–54. doi: 10.1200/JCO.2011.41.5703. [DOI] [PMC free article] [PubMed] [Google Scholar]
Associated Data
This section collects any data citations, data availability statements, or supplementary materials included in this article.
Supplementary Materials
Supplemental Table S1: A total of 41 Ewing sarcoma patient samples with corresponding clinical data were collected at RCHSD and CHOC. There was a small difference in male to female patients consistent with historical cohorts. The age distribution was as expected for patients with Ewing sarcoma. There is a higher number of patients presenting with metastasis compared to historical published data which explains the higher percentage of patients who are dead of disease (DOD) compared to published survival data.


