

Summary
Faithful cellular differentiation requires temporally precise activation of gene expression programs, which are coordinated at the transcriptional and translational levels. Neurons express the most complex set of mRNAs of any human tissue, but translational changes during neuronal differentiation remain incompletely understood. Here, we induced forebrain neuronal differentiation of human embryonic stem cells (hESCs) and measured genome-wide RNA and translation levels with transcript-isoform resolution. We find that thousands of genes change translation status during differentiation without a corresponding change in RNA level. Specifically, we identify mTOR signaling as a key driver for elevated translation of translation-related genes in hESCs. In contrast, translational repression in active neurons is mediated by regulatory sequences in 3′ UTRs. Together, our findings identify extensive translational control changes during human neuronal differentiation, and a crucial role of 3′ UTRs in driving cell-type specific translation.
Keywords: Cellular differentiation, translational control, stem cell, neuron, neural progenitor cell, RNA, ribosome profiling, polysome profiling, TrIP-seq, neurogenesis
eTOC blurb
Many 3′ untranslated regions extend dramatically during neurogenesis, sometimes by over 10 kilobases. Blair et al. use complementary deep sequencing approaches to identify neuronal post-transcriptional regulation through untranslated regions. They find that mTORC1 promotes translation of translation-related genes in hESCs, while 3′ UTRs downregulate translation selectively in active neuronal cultures.
Introduction
Specification of differentiated cell types requires tightly coordinated execution of gene expression programs. The balance and timing of proliferation and differentiation must be exquisitely controlled to promote proper development and avoid unrestricted growth. Coordination of gene expression is especially important in the development and maintenance of post-mitotic cells of neuronal lineages, as deviant proteostasis can lead to diverse pathologies including autism and neurodegenerative disease (Darnell and Klann, 2013; Freibaum and Taylor, 2017; Gkogkas et al., 2013; Kelleher and Bear, 2008). To achieve this coordination, cellular systems regulate each step of gene expression, including transcription, splicing and transcript processing, translation, and mRNA or protein degradation.
The brain contains the most complex mRNA repertoire of any human tissue (Ramskold et al., 2009). Transcript 3′ untranslated regions (UTRs) are lengthened considerably in the brain and during neuronal differentiation, where individual 3′ UTRs can exceed 20 kb (Hilgers et al., 2011; Miura et al., 2013). Extension of 3′ UTRs is driven by changes in expression levels of RNA-binding proteins that influence polyadenylation site selection or selective degradation of elongated 3′ UTRs (Hilgers et al., 2012; Mayr, 2016; Tian and Manley, 2017). Transcript 3′ UTRs regulate translation level, RNA degradation, RNA localization, and protein complex formation, therefore this expansion in 3′ UTR size also increases the post-transcriptional regulatory potential of the brain (Mayr, 2016; Tian and Manley, 2017). Defective 3′ UTR formation leads to nervous system dysfunction (Van Epps et al., 2010) and widespread shortening of 3′ UTRs is observed upon a shift to proliferation in diverse contexts including cancers and other diseases (Elkon et al., 2013; Gennarino et al., 2015; Mayr and Bartel, 2009; Sandberg et al., 2008; Singh et al., 2009).
Despite the importance of brain-specific 3′ UTRs, how the expanded regulatory potential of mRNA 3′ UTRs influences gene expression during neuronal differentiation remains incompletely understood. Transcript 3′ UTRs have been demonstrated to influence subcellular localization of transcripts in neurons (An et al., 2008; Taliaferro et al., 2016). However, 3′ UTRs can also affect protein translation or mRNA degradation by recruiting RNA-binding proteins and miRNAs (Floor and Doudna, 2016; Mayr, 2016; Mayr and Bartel, 2009; Sandberg et al., 2008; Shenoy and Blelloch, 2014). It remains unknown how brain-specific 3′ UTRs affect these processes, in part because RNA-sequencing analysis measures steady-state transcript levels but not their translation level. Furthermore, ribosome profiling, which measures the location of ribosomes on mRNAs using RNase-protected footprints, cannot measure translational effects of 3′ UTRs as they are digested. Prior work found that transcript 5′ UTRs mediate isoform-specific translation in mouse ES cells (mESCs) and early NPCs (Wong et al., 2016), but it is unclear if brain-specific 3′ UTR lengthening occurs in six-day-old neural progenitor cells. Therefore, the connection between brain-specific 3′ UTR extension and protein translation, as well as the dynamics of transcript-specific translation during human neuronal differentiation, remain unclear.
Here, we systematically quantified transcriptional and translational changes during human forebrain neuronal differentiation by performing parallel RNA-seq, ribosome profiling, and polysome profiling with transcript isoform resolution (TrIP-seq; (Floor and Doudna, 2016). We find that the mechanistic target of rapamycin complex 1 (mTORC1) signaling pathway drives high-level translation of translation-related genes selectively in human embryonic stem cells (hESCs), while transcriptional and translational changes are correlated for many other genes. At the transcript level, the presence of long 5′ UTRs represses translation in pluripotent and differentiated cells. In contrast, 3′ UTRs exert the strongest effect of any feature tested on translation in synaptically-active neuronal cultures, but have a minimal effect in hESCs. Cell-type-selective translational repression by 3′ UTRs is driven by an increase in the density of binding sites for regulatory RNA-binding proteins and miRNAs as opposed to 3′ UTR length. Therefore, 3′ UTR extensions predominantly downregulate protein production, which may be crucial for tightly controlling proteostasis in highly specialized, post-mitotic cells such as neurons.
Results
Measuring gene expression during human neuronal differentiation
We differentiated hESCs towards a forebrain fate using a dual-SMAD inhibition protocol (Figure 1A and S1A) (Chambers et al., 2009). We selected four developmental stages for analysis: proliferating hESCs, neural progenitor cells (NPCs), neuronal cultures 14 days post-differentiation from NPCs, and neuronal cultures 50 days post-differentiation from NPCs. These four endpoints were selected to measure initial gene expression in pluripotent stem cells, in proliferating NPCs, in early neuronal cultures, and in more mature cultures containing synaptically-active neurons. We collected two biological replicates from each endpoint and performed cytoplasmic and nuclear total RNA-seq to measure the transcriptome, ribosome profiling to measure gene-level translation and the locations of ribosomes, and TrIP-seq to measure transcript-specific translation (Table S1). We use the term gene-level translation to indicate the aggregate translation level of all RNA molecules produced from a gene; in contrast, transcript-specific translation refers to an individual RNA transcript produced from a gene.
Figure 1. Measuring global changes in transcription and translation during human neuronal differentiation.

(A) The experimental design. Human embryonic stem cells (hESCs) were differentiated into neural progenitor cells using dual-SMAD inhibition followed by neuronal differentiation. Samples were collected from each cell population and RNA-seq, ribosome profiling, and TrIP-seq libraries were prepared from each. (B) Western blotting of five cell-type markers during differentiation. (C) Examples of marker genes from cytoplasmic RNA-seq. TPM: gene-level expression in transcripts-per-million. *: differentially expressed at p < 0.01. Bar: mean expression; points: expression in each replicate. (D) A representative image of 50-day old in vitro differentiated human neuronal cultures. Green: synapsin; red: MAP2; blue: DAPI. (E) Left, example whole cell current clamp recording of a neuron showing action potentials elicited by a 25pA depolarizing current injection. Right, example spontaneous excitatory post-synaptic currents (sEPSCs) showing network connectivity. sEPSCs were abolished by blocking AMPA receptors with NBQX (bottom right).See also Figure S1.
We confirmed at the mRNA and protein levels that hESCs expressed the pluripotency marker OCT4 (POU5F1) (Figure 1B,C). NPCs expressed known markers such as PAX6, SOX1, HES1 and NES (Figure 1B,C and S1B), day 14 neuronal cultures began to express neuronal genes such as MAP2 (Figure 1B,C and S1B), and more mature (day 50) neuronal cultures expressed neuronal markers (CAMKIIA, GRIA1, STMN2, SNAP25, DCX, βIII-tubulin, and synapsin; Figure 1B–D and S1B) as well as glial markers (Figure S1B). At day 50, we observed strong induction of a class of genes representative of developing human neurons (Pollen et al., 2014); Figure S1C). Therefore, for simplicity, we refer to these as neuronal cultures. Neurons in 50-day cultures had synaptic puncta, were electrically active, and showed excitatory synaptic connectivity (Figure 1D,E).
Widespread translation changes during neuronal differentiation
To determine the relative contribution of transcription and translation to gene expression changes during neuronal induction, we compared ribosome profiling data to matched total mRNA levels from RNA-seq data. This analysis was performed on hESCs, NPCs, and day 14 neuronal cultures since it was not possible to obtain ribosome-protected footprints from day 50 neuronal cultures (see Methods). The ribosome profiling data exhibited the expected preference for protein coding regions, and a peak near the start codon likely caused by translation initiation events trapped during harvesting (Figure S2A; (Lareau et al., 2014)). Changes in ribosome profiling and RNA levels were highly correlated between cell types (Figure 2A; r = 0.89 between both hESCs and NPCs or NPCs and day 14 neuronal cultures), suggesting that transcriptional changes are a major influence on gene-level expression changes during differentiation.
Figure 2. Gene-level translational control during human neuronal differentiation.

(A) RNA-seq versus ribosome profiling fold changes between hESCs and NPCs (left) or NPCs and 14-day neuronal cultures (right) are plotted. Green: differentially expressed (DE) genes in ribosome profiling (RP); orange: DE genes in RNA-seq; blue: DE genes in both RNA-seq and RP; black: genes that do not change expression (p > 0.01). (B) Log-ratios of 5′ UTR to ORF ribosome profiling reads shows high 5′ UTR ribosome density for a group of genes in hESCs compared to differentiated cell types. (C) Relative upstream translation decreasing in the SOX2 gene. Purple: ribosome profiling reads mapping to the 5′ UTR. Right: reads per million. Inset: counts of the ribosome protected footprints mapping to the 5′ UTR or main ORF in different cell types; error is standard deviation. See also Figure S2.
Thousands of genes exhibited significant cell-type-specific changes in translation without corresponding changes in RNA levels, in addition to many genes that changed both transcriptionally and translationally (Figure 2A and Table S2). Analysis of the genes that were differentially translated identified 46 transcription-related genes that were significantly translationally upregulated in NPCs relative to hESCs (e.g. YAF2, ARID1A, CTNNB1 and RELA; Figure S2B), while genes associated with translation itself such as EIF4B, six members of the eIF3 translation initiation factor complex, and 56 ribosomal proteins were translationally downregulated in NPCs (Table S3). Between NPCs and day 14 neuronal cultures, 593 genes changed exclusively at the translation level. The most translationally activated genes in neuronal cultures included the fibronectin FSD1L, the transcriptional repressor JAZF1, and the calmodulin-dependent protein kinase CAMK4, although no gene ontology terms were enriched (Figure S2B).
Ribosomes can initiate translation at upstream start codons in mRNA 5′ UTRs (uORFs), which affects translation from the major open reading frame (ORF; (Brar et al., 2012; Hinnebusch et al., 2016). We hypothesized that hESC differentiation into neural precursors would result in a redistribution of ribosomes away from mRNA 5′ UTRs, as was observed in mouse embryoid body formation (Ingolia et al., 2011). Indeed, the relative 5′ UTR ribosome occupancy of 148 genes changed by more than a factor of two between hESCs and NPCs (Figure 2B). The distribution of changes was asymmetric, where 101 genes decreased in 5′ UTR ribosome density in NPCs and only 47 increased. As an example of this trend, the SOX2 gene, which encodes a SRY-box transcription factor involved in neocortex development (Bani-Yaghoub et al., 2006), had more ribosomes in its 5′ UTR versus the main ORF in hESCs than differentiated cells (Figure 2C). Differentiation of NPCs to neuronal cultures caused fewer changes in translation within 5′ UTRs, and in the opposite direction to what is found from hESCs to NPCs (82 genes: 54 up in the 5′ UTR and 28 down; Figure 2B). Translation of uORFs can positively or negatively affect translation of the downstream ORF (Brar et al., 2012; Hinnebusch et al., 2016). We found that genes that experienced increased 5′ UTR ribosomes during differentiation generally had decreased ribosome profiling signal in the main ORF and vice versa (Figure S2C). This suggests that assembly of translating ribosomes in the 5′ UTR predominantly downregulates translation in this system. Taken together, our results show that transcription is responsible for the majority of gene expression changes during neuronal differentiation while translational control preferentially affects a subset of genes, partly due to relocation of ribosomes from 5′ UTRs in hESCs to open reading frames in differentiated cells.
Elevated translation of translation-related genes in embryonic stem cells
We identified 172 genes related to translation that were differentially translated between hESCs and NPCs (Figure 3A). mTORC1 and MYC are two major regulators of protein synthesis, so we tested whether they contributed to the enhanced translation of translation factors in hESCs (Bhat et al., 2015; Pourdehnad et al., 2013). MYC levels were elevated in hESCs compared to differentiated cell types (Figure 3B). However, MYC affects transcription of ribosomal protein genes and ribosomal RNA (van Riggelen et al., 2010) and ribosomal protein genes exhibited relatively small transcriptional changes in these data (Figure 3A). In contrast, mTORC1 post-transcriptionally regulates the translation of a subset of genes that is enriched for translation factors (Thoreen et al., 2012). We therefore assessed mTORC1 activity through phosphorylation of its primary targets involved in translational control, p70S6 kinase and 4E-BP1. We also assessed the phosphorylation state of the p70S6K target, ribosomal protein S6, a commonly used read-out of mTORC1 activity. Differentiation of hESCs into NPCs strongly reduced mTORC1 activity, indicating that suppression of mTORC1 signaling may underlie the downregulation of translational machinery during neural induction (Figure 3C). In support of this, 72 of the 172 genes that exclusively experienced translational changes between hESCs and NPCs overlap with previously identified mTORC1 targets (Thoreen et al., 2012) p = 1.6e-31, hypergeometric test). To experimentally test the role of mTORC1 signaling, we measured the protein levels of genes with elevated translation in Figure 3A after inhibition of mTOR with rapamycin in hESCs (Figure 3D). Protein levels for EIF4B, EIF3D, RPL10A and RPLP1 decreased in abundance following mTOR inhibition, but actin was not affected. Levels of the mTORC1 inhibitor TSC2 increase during differentiation, which is a possible mechanism for the reduction in mTORC1 activity (Figure 3C). We conclude that mTORC1 signaling drives high-level translation of translation-related genes in hESCs.
Figure 3. Elevated translation through mTORC1 in hESCs.

(A) A heatmap of the log2 fold changes between cell types indicated in either RP or RNA-seq. Cyan: higher in early cell-type; yellow: higher in late cell type. Above: pearson correlation of RP and RNA-seq fold changes. (B) Ribosome profiling and RNAseq expression profiles for MYC, RPL38, UBA52 and HOXA9 across differentiation. Bar: mean expression; points: expression in each replicate. (C) Western blots for phospho-p70S6K, phospho-S6, and phospho-4EBP1 as a readout of mTOR activity in differentiating neuronal cells, and the mTOR repressor TSC2. (D) Protein levels from hESCs treated with 20 nM rapamycin for the indicated times in hours for four genes with elevated translation in hESCs in (A). (E) Log2 fold changes in RNA vs ribosome profiling levels for 80 ribosomal proteins between cell types.
We observed that mTORC1 activity increased during early neuronal differentiation (from the NPC state to day 14 neuronal cultures, Figure 3C). To test whether the reactivation of mTORC1 signaling in early neuronal cultures correlated with changes in the translational machinery, we compared the translational regulation of ribosomal proteins across hESCs, NPCs, and early neuronal cultures. Consistent with a reactivation of mTORC1 signaling, translation of many ribosomal proteins increased in early neuronal cells compared to NPCs (Figure 3B,E). Transcriptional changes were smaller than translational changes for this class of genes between hESCs, NPCs and early neuronal cells (Figure 3E), highlighting the relative importance of translational regulation in this context.
Active ribosomes can assemble without some ribosomal proteins, leading to the concept of ribosome specialization (Komili et al., 2007; Shi and Barna, 2015). In line with this idea, we found that not all ribosomal proteins change translation level to the same degree between cell types (Figure 3E). For example, RPL38 was strongly translationally upregulated in hESCs versus NPCs, and reactivated in early neuronal culture (Figure 3B,E). RPL38 selectively controls translation of a subset of genes, including HOX genes (Xue et al., 2015). Intriguingly, translation of the RPL38-sensitive gene HOXA9 was upregulated in early neuronal culture when its transcription increased (Figure 3B). Additionally, the fusion gene UBA52, which expresses ubiquitin and RPL40, was translationally upregulated in hESCs compared to NPCs, and RPL40 has also been shown to mediate transcript-specific translation (Figure 3B; (Lee et al., 2013). In sum, our results indicate that mTORC1 signaling drives dynamic ribosomal protein expression during neuronal differentiation, which may in turn yield selective translation of mRNAs in different cellular contexts.
Transcript-specific translation during human neuronal differentiation
Changes in the translation level of a gene can be driven by altered translation of mRNAs or altered transcript processing, yielding new mRNA transcript isoforms that confer different levels of translation. However, transcript-specific translation is difficult to resolve using ribosome profiling due to the short length of protected footprints, and because alternative 3′ UTRs are invisible to the technique (Ingolia, 2014). To determine the impact of differential transcript isoform expression including 3′ UTRs during human neuronal differentiation, we measured transcript isoform-specific translation using TrIP-seq (Floor and Doudna, 2016) in identical samples to those used for ribosome profiling. TrIP-seq uses polysome profiling and high-throughput sequencing to identify transcript isoforms that are highly translated (polysome-high fraction) and those that are less frequently translated (polysome-low or monosome fractions; Figure 4A). The monosome was separated because monosome-bound mRNAs are enriched for retained intron and nonsense mediated decay (NMD)-targets compared to polysome-bound mRNAs (Floor and Doudna, 2016; Heyer and Moore, 2016), which represent crucial layers of post-transcriptional control (Raj and Blencowe, 2015). Previous work demonstrated that polysomal samples clustered into three groups corresponding to the monosome, polysome-low and polysome-high fractions used here (Floor and Doudna, 2016). RNA-seq libraries were made from these fractions and deep sequenced, yielding over two billion mapped reads (Tables S1 and S4).
Figure 4. Transcript-level translational control during human neuronal differentiation.

(A) Polysome profiles for hESCs, NPCs, day 14 neuronal cultures and day 50 neuronal cultures. RNA was collected from the indicated fractions for TrIP-seq. (B) Two differentially translated transcripts of the MECP2 gene are expressed in 50-day neuronal cultures, which differ in the length of their UTRs and translation level. Bar: mean expression; points: expression in each replicate. (C) Reads from the MECP2 locus. (D) The number of transcript isoforms per gene expressed above 5% of the total gene expression are plotted in different subcellular fractions.
The striking impact that alternative transcript processing has on protein production was evident for genes such as MECP2, which encodes a methyl-CpG DNA binding protein that is altered in a majority of Rett syndrome patients (Lombardi et al., 2015). Some isoforms (e.g. MECP2-001) include an alternative exon that shifts the reading frame of the first start codon in MECP2-002. This exon inclusion therefore introduces a uORF into the mRNA, which downregulates protein production (Figure 4B, (Kriaucionis and Bird, 2004). The 3′ UTR of MECP2 is also alternatively processed, leading to various short (~100 nt) or long (~8 kb) forms, which are differentially translated and differentially expressed during neuronal differentiation (Rodrigues et al., 2016). We observed the impact of both of these transcript processing events in 50-day old human neuronal cultures. Specifically, reads mapping to the second, alternative exon and the 3′ UTR were higher in the monosome and polysome-low fractions than in the polysome-high fraction (Figure 4C), suggesting lower protein production from these transcript isoforms.
The above example focuses on two transcripts generated by MECP2, but there are 26 annotated isoforms for this gene. In our data, the other transcript isoforms were either not expressed or not found in polysomes, suggesting only a subset of transcript isoforms are translated. We therefore tested whether translation of transcript isoforms is generally pervasive or selective. We computed the number of transcript isoforms that are expressed at more than 5% the total gene expression level in nuclear RNA, cytoplasmic RNA, and the three polysome-derived fractions. We found that nuclear export and translation both act as bottlenecks, selecting a subset of all expressed transcript isoforms. In all four-cell stages, we found that the nucleus had the highest diversity of transcript isoforms (Figure 4D). A subset of exported transcripts was associated with ribosomes, resulting in diminished transcripts per gene in cytoplasmic RNA, monosome-associated RNA, and further reductions in transcript diversity in polysomal RNA (Figure 4D). In sum, we find that individual transcript isoforms can vary widely in their translational potential, from being enriched in the nucleus to being highly polysome-associated, and that this variability affects protein production of genes linked to human neurodevelopmental disorders.
Changes to transcript RNA processing drive gene-level translation changes
To determine the prevalence of transcript-specific translation as in the above MECP2 example, we identified differentially translated transcripts across differentiation. Hierarchical clustering was used to group transcripts by their polysome distribution (Figure 5A, Figure S3B and Table S5). In hESCs and differentiated cell types, there were clusters of transcripts that were primarily associated with either the monosome, polysome-low, or polysome-high fractions. Classifying the types of transcript isoforms in different polysomal clusters identified an enrichment for retained intron transcripts in the monosome fraction in all four cell-types (Figure 5B) (Floor and Doudna, 2016; Heyer and Moore, 2016). We note that the true rate of intron retention is higher as we observed hundreds of unannotated events, for example the cell-type specific intron retention in the DNA methyltransferase DNMT3B (Figure S3A). These retained intron transcripts on polysomes are likely being degraded through NMD as well, which has been suggested to be a mechanism to downregulate classes of genes in neurons (Raj and Blencowe, 2015).
Figure 5. Trends in transcript-level translation during human neuronal differentiation.

(A) Heatmaps of hierarchical clusterings of transcript isoform expression. See Figure S3B for dendrograms and average plots. (B) Select transcript types are shown for clusters of transcripts that are primarily present in the monosome fraction. Most other transcripts are annotated as protein coding. (C) Contrasting lowly- and highly-translated clusters between cell types identifies transcripts, such as SKP1-004, that are differentially translated between cell types. Bar: mean expression; points: expression in each replicate. (D) The normalized Jaccard similarity of polysome-low and polysome-high clusters between cell types is plotted. See also Figure S3.
The thousands of translation changes during cell state transitions we observed by ribosome profiling could be driven either by generation of new transcript isoforms with altered translational potency, or altered translation of the same transcript isoforms. To test the relative contribution of these two regulatory mechanisms, we compared clusters of lowly and highly translated transcripts between cell types. Thousands of transcript isoforms moved from low to high (or high to low) polysomal clusters between cell types, likely due to a change in their translation level. For example, a transcript isoform of the SKP1 SCF ubiquitin ligase associated more with the polysome-high fraction following neuronal differentiation (Figure 5C). We analyzed this systematically by computing the Jaccard similarity (the intersection divided by the union) between low and high polysomal clusters between cell types. Between 60–76% of transcript isoforms were detected across pairs of cell types, with day 14 and day 50 neuronal cultures having the highest similarity. We found that transcript isoforms that were expressed in multiple cell types frequently retained their translation level, even between hESCs and day 50 neuronal cells (Figure 5D). Thus, changes to steady-state gene-level translation are frequently driven by production of alternative transcript isoforms as opposed to changes to the translation level of individual transcripts.
3′ untranslated regions repress translation selectively in neuronal cultures
We next identified features of mRNAs that were associated with differential translation during neuronal differentiation. Even if the coding sequence is identical between two alternatively processed transcripts of a gene, the level of protein output can differ due to changes in the regulatory composition of untranslated regions at the 5′ and 3′ ends (Arribere and Gilbert, 2013; Floor and Doudna, 2016; Hinnebusch et al., 2016; Mayr, 2016; Mayr and Bartel, 2009; Sandberg et al., 2008; Sterne-Weiler et al., 2013). We therefore compared transcript isoform properties in polysome-low versus polysome-high clusters that might influence translation, such as the density of various regulatory elements in the 3′ UTR or codon usage (Figure S4A). We compared features between isoforms derived from the same gene (Methods). Of the 21 features tested, five affected translation in all cell types, 11 affected translation in a cell type-dependent manner, and five had no or small effects. Long 5′ UTRs were consistently associated with low levels of translation across all cell types (Figure 6A). By contrast, another transcript property, ORF length, was associated with higher ribosome occupancy in all cell types, although this effect decreased in older neuronal cultures (Figure 6A).
Figure 6. 3′ untranslated regions drive differential translation between cell types.

(A) The relative length of 3′ UTRs between lowly- and highly-translated transcripts from the same gene increases during differentiation. Error bars: 95% confidence interval, also in (B,C). (B) Relative 3′ UTR length increases for transcripts of the same gene expressed between cell types. (C) 3′ UTR structure, the fraction of 3′ UTRs containing AU-rich elements, and the influence of brain-specific miRNA binding sites increase in 50-day old neuronal cultures, suggesting these features may drive translational repression by 3′ UTRs. (D) Expression changes in select RNA binding proteins that influence either 3′ end selection or post-transcriptional control. See also Figure S4.
Transcript 3′ UTR length affected translation more than any other feature tested in 50-day neuronal cultures (Figure 6A). By contrast, the impact of transcript 3′ UTRs was negligible in hESCs (Figure 6A). Long transcript 3′ UTRs were associated with lower levels of translation as cells differentiated into neuronal cultures. The simplest explanation for an increased impact of 3′ UTR length on translation during differentiation is changes in 3′ UTR length. Alternatively, the effect could be caused by a change in 3′ UTR regulatory content or cellular post-transcriptional control factors. The relative length of 3′ UTRs between transcripts of a gene increased in day 14 neuronal cultures to a similar extent as day 50 (Figure 6B), yet 3′ UTR length inhibited translation more strongly in day 50 neuronal cultures than in day 14 cultures (Figure 6A). This suggests changes to the regulatory content of 3′ UTRs or cellular post-transcriptional control factors are responsible for increased translational repression. Indeed, the influence of predicted 3′ UTR secondary structure, the fraction of the 3′ UTR made up of AU-rich elements, and the number and density of binding sites of brain-specific miRNAs (miR-9, −26, −124, −137, −195, −219-, −338, and let-7; (Shenoy and Blelloch, 2014) all increased during neuronal differentiation (Figure 6C). Furthermore, the expression level of several RNA binding proteins that interact with transcript 3′ UTRs increased during differentiation, such as SMAUG1 (SAMD4A), Staufen1 (STAU1), Staufen2 (STAU2), WIG1 (ZMAT3), and the cytoplasmic polyadenylation element binding proteins CPEB1 and CPEB4. We also saw evidence for changes in gene expression for proteins that regulate alternative polyadenylation, such as CSTF2, multiple ELAV genes, and NOVA1 and NOVA2 (Figure 6D). Taken together, these data indicate that extension of 3′ UTRs during neuronal differentiation induces strong translational repression, which is driven by regulatory elements.
Discussion
In this work, we analyzed the relationships between transcriptional and translational changes during human forebrain neuronal differentiation. Our work assigns functional consequences to the 3′ UTR extensions that have been observed during brain development, uncovers how post-transcriptional control changes during human neuronal differentiation, and provides a rich resource of untranslated regions that confer global or cell-type-specific protein expression (Figure 7).
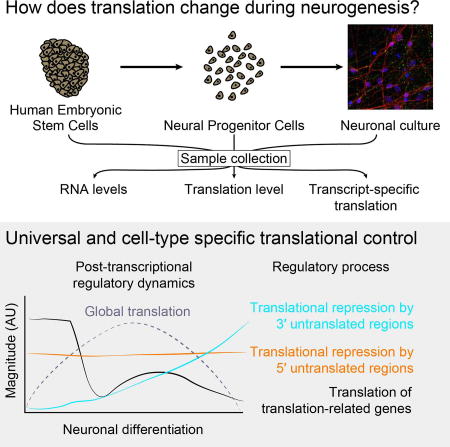
Figure 7. Dynamic translational regulation during human neuronal differentiation.

Left: A diagram of the approximate dynamics of post-transcriptional regulatory processes during human neuronal differentiation. Cyan: 3′ UTR-mediated translational repression, orange: 5′ UTR-mediated translational repression, black: preferential translation of mRNAs produced by translation-related genes. Right: Mechanisms that contribute to the regulatory processes in center. Individual mRNAs may be subject to regulation by one or many of these mechanisms. Our study and previous work indicates that global translation increases upon differentiation and decreases as neurons mature, shown in a dashed line.
Finely tuned translation and mTORC1 signaling are essential for normal neuronal development (Hartman et al., 2013; Magri et al., 2011). We find that high mTORC1 signaling in hESCs drives high-level translation of translation-related genes (Figure 3), which decreases during neuronal differentiation. However, hESCs and other stem cell types maintain low overall levels of translation (Oh et al., 2005; Sampath et al., 2008; Sanchez et al., 2016; Signer et al., 2014). The polysome profiles we observed also seem to indicate a global increase in high polysomes (and therefore translation) as hESCs differentiate into NPCs (Figure 4A). How might hESCs achieve selective translation of ribosomal proteins and translation-related genes (Figure 3) despite low overall translation? One possibility is that some hESC ribosomes are maintained in an inactive state and are activated upon differentiation into NPCs. It is also possible that hESCs preferentially translate a subset of messages through ribosome specialization (Komili et al., 2007; Shi and Barna, 2015; Xue et al., 2015), transcript-specific translation pathways using eIF3 (Lee et al., 2015), or other mechanisms. An interesting future direction will be to define the molecular mechanisms underlying the preferential translation of translation-related genes in hESCs, and to determine its impact on human neuronal differentiation.
Neurons increase their post-transcriptional control potential by extending the set of transcript 3′ UTRs by millions of nucleotides (Hilgers et al., 2011; Miura et al., 2013). Our data clearly indicate that extended 3′ UTRs contribute to translational repression upon neuronal differentiation. Dysregulation of RNA and protein expression in neurons has deleterious consequences and contributes to numerous neurological and psychiatric diseases (Darnell, 2013; Pilaz and Silver, 2015). For example, expression of variants of the TLS/FUS RNA binding protein found in amyotrophic lateral sclerosis patients causes aberrant gene expression in human cells, including of MECP2 (Coady and Manley, 2015). Similarly, copy-number variations in the NUDT21 gene found in patients with neurological disease increase the fraction of MECP2 mRNA molecules with long 3′ UTRs (Gennarino et al., 2015). Total MECP2 mRNA levels are elevated in patient-derived cells (Gennarino et al., 2015) or human cells expressing TLS/FUS variants (Coady and Manley, 2015), but MeCP2 protein levels are decreased in both cases. Thus, measuring translation changes in the manner described here that can detect and quantify alternative transcripts and 3′ UTRs is essential when studying diseases involving genetic alterations to post-transcriptional control factors.
Neurons undergo various forms of plasticity that allow the nervous system to learn and adapt, which often require gene expression changes at both transcriptional and translational levels (Costa-Mattioli et al., 2009). In some cases, local translation at synapses modulates synaptic plasticity (Holt and Schuman, 2013), which involves reactivation of stalled polysomes (Graber et al., 2013). Most methods to measure global translation specifically measure the occupancy of assembled 80S ribosomes on mRNA. Translation is frequently regulated at the initiation step (Hinnebusch et al., 2016), and ribosome occupancy correlates with protein levels (Floor and Doudna, 2016; Ingolia et al., 2009). However, regulated translation elongation decouples ribosome occupancy and protein synthesis, because stalled ribosomes are not actively synthesizing protein. Interestingly, we find that the influence of ORF length on the ribosome occupancy of an mRNA decreases during neuronal differentiation (Figure 6A), which is possibly a sign of increased stalling during elongation. Neuronal elongation stalling is mediated, at least in part, by FMRP binding to the ribosome (Chen et al., 2014; Darnell et al., 2011). Our observation that long transcript 3′ UTRs are enriched in low polysomal fractions (Figure 6) suggests that if these transcripts are incorporated into polysomes that are stalled during elongation, there are few ribosomes bound. Separating the contributions of translation initiation and elongation to neuronal differentiation and function is important, and would be facilitated by approaches that measure the location of multiple ribosomes on a single mRNA.
Our work and previous studies together suggest that cell-type-independent control by 5′ UTRs and cell-type-specific control by 3′ UTRs may be a general property of metazoan translation (Floor and Doudna, 2016; Lianoglou et al., 2013; Merritt et al., 2008). However, the regulatory features that control translation both in 5′ and 3′ UTRs are complex (Figure 6 and S4). Our work motivates future experiments measuring translation output from synthetic libraries of untranslated regions. Deep sampling of regulatory elements would enable rigorous modeling or machine learning of the dependence of transcript features on translation in different cell types. Such a model would achieve a major goal: to be able to predict the translation level of an mRNA in different cell types based on sequence alone. The complexity of regulatory mechanisms between cell-types identified in this work highlights how important such a model would be, both for understanding basic biology and engineering the translation level of synthetic genes or mRNAs.
Overall, our work reveals extensive changes to gene expression programs at multiple layers during human neuronal differentiation. Our findings facilitate interpretation of alterations to post-transcriptional processes that occur in human neurological and developmental disorders. In summary, multiple aspects of translational control act both in concert with and independently of transcriptional output to shape gene expression during specification of the neuronal lineage.
Experimental Procedures
hESC cell culture
Human embryonic stem cell culture was carried out as previously described (Blair et al., 2016) in WIBR3 hESCs (NIH stem cell registry # 0079; (Lengner et al., 2010). Briefly, all hESC lines were maintained on a layer of inactivated mouse embryonic fibroblasts (MEFs) in hESC medium composed of DMEM/F12 supplemented with 20% KnockOut Serum Replacement, 2 mM glutamine, 1% non-essential amino acids, 0.1 mM β-mercaptoethanol, 1000 U/ml penicillin/streptomycin, and 4 ng/ml FGF2. Cultures were passaged every 7 days with collagenase type IV and gravitational sedimentation by washing 3 times in wash media composed of DMEM/F12 supplemented with 5% fetal bovine serum and 1000 U/ml penicillin/streptomycin. hESCs were regularly tested for mycoplasma contamination.
Neuronal differentiation and culture
Neural induction was performed as described previously (Chambers et al., 2011), with minor alterations. Single hESCs were initially plated at a density of 50,000/cm2 (1.9×10⁵ cells/well of a 12-well plate) and maintained in complete conditioned hESC media until >90% confluent. hESCs were transferred to induction media supplemented with 100 ng/µl Noggin and 10 µM SB431542 with daily media changes for 10 days. The composition of induction media changes throughout induction with 100% induction media A (A) from days 1–4, 75% A and 25% induction media B (B) on days 5–6, 50% A and 50% B on days 7–8 and 25% A and 75% B on days 9–10. Induction media A is composed of Knockout DMEM with 15% KSR, 2 mM l-glutamine, 1% non-essential amino acids, 1000 U/ml penicillin/streptomycin and 55 µM β-mercaptoethanol. Induction media B is composed of 50% DMEM/F12 media, 50% Neurobasal media 1x N-2 Supplement, 1x Glutamax, 1000 U/ml penicillin/streptomycin, 0.2% human Insulin and 0.075% bovine serum albumin as previously described (Chambers et al., 2011). After neural induction was complete, cells were dissociated with Accutase, spun down for 4 minutes at 800 rpm, resuspended in induction media B supplemented with 25 ng/ml FGF2 and 40 ng/ml EGF and replated on matrigel at 1:2. Two-thirds of media supplemented with FGF2 and EGF was changed every other day. Cells were passaged as such every 5 days until passage 4, when they were split at 1:3.
Differentiation from NPCs into neuronal cultures commenced at passage 8, 45 days after the beginning of neural induction and 35 days after the completion of neural induction. NPCs were plated at low density – 80,000/cm2 (8×10⁵ cells/well of a 6-well plate) in 4 ml of growth media. For imaging, cells were plated at the same density on a 12mm glass coverslip in a 24-well plate. Growth media (N2B27 media) is composed of 50% DMEM/F12, 50% Neurobasal Media, 1x N-2 Supplement, 1x B-27 Supplement, 1x Glutamax, 1000 U/ml penicillin/streptomycin and 0.075% BSA w/v. For the first 12 days, growth media was supplemented with 20 ng/ml BDNF and 20 ng/ml NT-3. For subsequent media changes, N2B27 media was used with no additional growth factors. All neuronal media changes occurred every 4 days with a half-volume change. Neuronal cultures were harvested after 14 or 50 days post-differentiation from NPCs (Figure S1A).
Replicates
For all experiments both technical and biological replicates were used. Technical replicates consisted of cells that were plated at the same time treated with identical experimental handling and conditions. Biological replicates were cells plated one passage apart with matched cell numbers and experimental handling. Technical replicates were used to assess the robustness of harvesting procedures for sequencing library preparations and other procedures. All sequencing experiments used two biological replicates.
Harvesting cells
Cells were treated with 100 µg/ml cycloheximide dissolved in pre-warmed media at 37 °C for 5 minutes before harvesting and 100 µg/ml cycloheximide was added to all downstream buffers. hESCs were dissociated from the feeder layer using 1 mg/ml Collagenase Type IV for 20 minutes followed by gravity sedimentation 3 times in wash media composed of DMEM/F12 supplemented with 5% fetal bovine serum and 1000 U/ml penicillin/streptomycin. NPCs and neuronal cultures were dissociated with Accutase and spun down for 4 minutes at 800 rpm. Cell pellets from ~10 million cells were washed with PBS, spun down and resuspended in 500 µl hypotonic lysis buffer on ice (10 mM HEPES pH 7.9, 1.5 mM MgCl2, 10 mM KCl, 0.5 mM DTT, 1% Triton X-100, 100 µg/ml cycloheximide). All samples were then incubated on ice for 10 minutes, triturated ten times through a 26G needle, spun at 1500g for 5 minutes at 4 °C (to pellet nuclei and cell bodies), and the supernatant was transferred to a new tube, which was used for either polysome or ribosome profiling in parallel. 20–30 µl of the cytoplasmic lysate was added to 300 µl Trizol reagent, and the nuclei were resuspended in 300 µl Trizol reagent, to generate cytoplasmic and nuclear RNA samples, respectively, and RNA was purified using the manufacturer’s protocol.
Polysome profiling
Polysomes were separated using sucrose gradient centrifugation as previously described (Floor and Doudna, 2016). Equal volumes of samples from the 2–4 ribosomes and the 5–8+ ribosomes fractions were pooled. For further details see Supplemental Experimental Procedures.
Ribosome profiling data processing and analysis
Adapters were removed with Cutadapt 1.13 (Martin, 2011) (--trim-n -u 3 --minimum-length 15), retaining the UMI. PCR duplicate reads were removed using PRINSEQ (Schmieder and Edwards, 2011) (-derep 1 -no_qual_header). Five-base UMIs were then removed with Cutadapt (--trim-n -u −5 --minimum-length 15). Trimmed reads that aligned to human rRNA and then to RMSK-derived regions were removed using Bowtie2 v 2.2.6 (Langmead and Salzberg, 2012) (-L 10 -i S,1,0.5). Reads from hESCs were aligned to a combined human-mouse genome and were discarded if they aligned more than one time, which in most cases was < 1% and in all cases < 2% of reads. Remaining reads were quantified using Kallisto 0.43 (Bray et al., 2016) (bias --fr-stranded --single -l <avg> -s <stdev>) using indexes made from all Ensembl GRCh38 v84 transcripts for both ORF and 5′ UTR regions. Regions were merged if they differed by less than 100 bp for ORFs and 50 bp for 5′ UTRs prior to index generation. Quantified transcript regions were aggregated to the gene level using tximport and analyzed using DESeq2 (Love et al., 2014). Statistically significant changes were called at p < 0.01. Biological duplicate samples were highly correlated (Figure S1D). The 5′ UTR to ORF ratio was computed by dividing 5′ UTR-quantified read counts per gene by ORF-quantified read counts per gene. Reads were aligned to the genome for visualization using HISAT2 v2.0.4 (Kim et al., 2015) and visualized with IGV (Thorvaldsdottir et al., 2013). Bedtools 2.21 (Quinlan, 2014) and Samtools 0.1.19 and 1.3 (Li et al., 2009) were also used.
TrIP-seq polysome data processing and analysis
Paired-end adapters were removed with Cutadapt 1.13 (--minimum-length 50), and trimmed reads that aligned to human rRNA or to RMSK-derived regions were removed using Bowtie2 v 2.2.6. Reads from hESCs were aligned to a combined human-mouse genome and were discarded if they aligned more than one time, which in most cases was < 1% and in all cases < 2% of reads. Remaining reads were quantified using Kallisto 0.42 (--bias) using indexes made from all Ensembl GRCh38 v84 transcripts. Quantified transcript regions were clustered (next section) or analyzed using DESeq2, or aggregated to the gene level using tximport and analyzed using DESeq2. Statistically significant changes were called at p < 0.01. Biological duplicate samples were highly correlated (Figure S1E). Reads were aligned to the genome for visualization using HISAT2 v2.0.4 and visualized with IGV. Classes of genes representing different cell types (Figure S1C) were identified in (Pollen et al., 2014) or (Mallon et al., 2013). The median expression within each gene class is plotted. Python programs used in this analysis can be downloaded at http://github.com/stephenfloor/tripseq-analysis.
Hierarchical clustering and analysis
Clustering was performed essentially as described (Floor and Doudna, 2016), using Euclidean distance. Transcripts were clustered across the monosomal, low polysomal, and high polysomal samples to reflect transcript abundance across the polysome profile. The mean-subtracted, regularized-log transformation (rlog; DESeq2) of each transcript was clustered. Cluster number was determined by merging clusters below a specified dendrogram height until mergers combined clusters with different average profiles. Transcripts from clusters predominantly mapping to monosome, polysome-low, or polysome-high fractions were pooled prior to analysis. Inter-cluster comparisons used a normalized Jaccard Index, which corrects for set size differences:
To show that the transcript features associated with translation are independent of the clustering, we identified statistically significantly different transcript isoforms between polysome-low and polysome-high fractions using DESeq2. Polysome-low or polysome-high enriched transcripts exhibited similar trends to those observed when comparing clusters of transcripts (Figure S4B).
Calculation and comparison of transcript features
Compilation and definition of transcript features was performed as described (Floor and Doudna, 2016). All comparisons are between transcript isoforms derived from the same gene as opposed to all expressed transcript isoforms. Effect size is measured using Cliff’s d, which is related to the Mann-Whitney U statistic by , where m and n are the sample sizes of the two sets, and was calculated using the R package orddom (CRAN). Predicted binding sites for brain-specific microRNAs (Shenoy and Blelloch, 2014) were from TargetScan 7.1 (Agarwal et al., 2015).
Supplementary Material
Table S1. Read tracking for all sequencing libraries, Related to Figure 2 and 4.
Table S2. Statistical testing of changes in RNAseq and ribosome profiling from DESeq2, Related to Figure 2.
Table S4. Quantified expression values for TrIP-seq polysome profiling samples, Related to Figure 4.
Table S5. Clustered transcripts and expression values for TrIP-seq polysome profiling samples, Related to Figure 5.
Highlights.
Translational control of genes and transcripts during human neuronal differentiation
mTOR signaling promotes translation of translation-related genes selectively in hESCs
5′ UTRs influence global translation; 3′ UTRs control cell type-specific translation
Long 3′ UTRs preferentially downregulate translation in neurons
Acknowledgments
We thank A. Tambe, B. Do. R.A. Flynn, S. Iwasaki, N. Ingolia, A.S.Y. Lee, S. Venkataramanan, A. Bhate, and S. McDevitt for helpful discussions, sharing reagents, or contributing to software development. J.D.B. is supported by a Frederick Banting and Charles Best Canada Graduate Scholarship from the Canadian Institutes for Health Research (356733). D.H. is supported through a Pew-Stewart Scholar for Cancer Research by the Pew Charitable Trusts and the Alexander and Margaret Stewart Trust, the Siebel Stem Cell Center, and NIH R01CA196884. J.A.D. is an HHMI Investigator and a Paul Allen Frontiers in Science investigator. H.S.B. is supported by a fellowship from the Alfred P. Sloan foundation, a NARSAD Young Investigator Grant from the Brain & Behavior Research Foundation, the Hellman Family Faculty Fund, and NIH R01NS097823. S.N.F. is a HHMI fellow of the Helen Hay Whitney Foundation. The Vincent J. Coates Genomics Sequencing Laboratory at UC Berkeley is supported by NIH S10 OD018174.
Footnotes
Publisher's Disclaimer: This is a PDF file of an unedited manuscript that has been accepted for publication. As a service to our customers we are providing this early version of the manuscript. The manuscript will undergo copyediting, typesetting, and review of the resulting proof before it is published in its final citable form. Please note that during the production process errors may be discovered which could affect the content, and all legal disclaimers that apply to the journal pertain.
Author Contributions:
Conceptualization, S.N.F., J.A.D., and D.H.; Methodology, S.N.F. and J.D.B.; Software, S.N.F.; Investigation, S.N.F., J.D.B, and H.S.B.; Writing – Original Draft, S.N.F.; Writing – Review & Editing, J.D.B., D.H., J.A.D., H.S.B., and S.N.F.; Funding Acquisition, D.H., J.A.D., H.S.B., and S.N.F.; Supervision, D.H., J.A.D., H.S.B., and S.N.F.
Accession numbers: All sequencing reads are available through the NCBI GEO with accession number GSE100007.
References
- Agarwal V, Bell GW, Nam JW, Bartel DP. Predicting effective microRNA target sites in mammalian mRNAs. Elife. 2015;4 doi: 10.7554/eLife.05005. [DOI] [PMC free article] [PubMed] [Google Scholar]
- An JJ, Gharami K, Liao GY, Woo NH, Lau AG, Vanevski F, Torre ER, Jones KR, Feng Y, Lu B, et al. Distinct role of long 3’ UTR BDNF mRNA in spine morphology and synaptic plasticity in hippocampal neurons. Cell. 2008;134:175–187. doi: 10.1016/j.cell.2008.05.045. [DOI] [PMC free article] [PubMed] [Google Scholar]
- Arribere JA, Gilbert WV. Roles for transcript leaders in translation and mRNA decay revealed by transcript leader sequencing. Genome Res. 2013;23:977–987. doi: 10.1101/gr.150342.112. [DOI] [PMC free article] [PubMed] [Google Scholar]
- Bani-Yaghoub M, Tremblay RG, Lei JX, Zhang D, Zurakowski B, Sandhu JK, Smith B, Ribecco-Lutkiewicz M, Kennedy J, Walker PR, et al. Role of Sox2 in the development of the mouse neocortex. Dev Biol. 2006;295:52–66. doi: 10.1016/j.ydbio.2006.03.007. [DOI] [PubMed] [Google Scholar]
- Bhat M, Robichaud N, Hulea L, Sonenberg N, Pelletier J, Topisirovic I. Targeting the translation machinery in cancer. Nat Rev Drug Discov. 2015;14:261–278. doi: 10.1038/nrd4505. [DOI] [PubMed] [Google Scholar]
- Blair JD, Bateup HS, Hockemeyer DF. Establishment of Genome-edited Human Pluripotent Stem Cell Lines: From Targeting to Isolation. J Vis Exp. 2016:e53583. doi: 10.3791/53583. [DOI] [PMC free article] [PubMed] [Google Scholar]
- Brar GA, Yassour M, Friedman N, Regev A, Ingolia NT, Weissman JS. High-resolution view of the yeast meiotic program revealed by ribosome profiling. Science. 2012;335:552–557. doi: 10.1126/science.1215110. [DOI] [PMC free article] [PubMed] [Google Scholar]
- Bray NL, Pimentel H, Melsted P, Pachter L. Near-optimal probabilistic RNA-seq quantification. Nat Biotechnol. 2016;34:525–527. doi: 10.1038/nbt.3519. [DOI] [PubMed] [Google Scholar]
- Chambers SM, Fasano CA, Papapetrou EP, Tomishima M, Sadelain M, Studer L. Highly efficient neural conversion of human ES and iPS cells by dual inhibition of SMAD signaling. Nat Biotechnol. 2009;27:275–280. doi: 10.1038/nbt.1529. [DOI] [PMC free article] [PubMed] [Google Scholar]
- Chambers SM, Mica Y, Studer L, Tomishima MJ. Converting human pluripotent stem cells to neural tissue and neurons to model neurodegeneration. Methods Mol Biol. 2011;793:87–97. doi: 10.1007/978-1-61779-328-8_6. [DOI] [PubMed] [Google Scholar]
- Chen E, Sharma MR, Shi X, Agrawal RK, Joseph S. Fragile X mental retardation protein regulates translation by binding directly to the ribosome. Mol Cell. 2014;54:407–417. doi: 10.1016/j.molcel.2014.03.023. [DOI] [PMC free article] [PubMed] [Google Scholar]
- Coady TH, Manley JL. ALS mutations in TLS/FUS disrupt target gene expression. Genes Dev. 2015;29:1696–1706. doi: 10.1101/gad.267286.115. [DOI] [PMC free article] [PubMed] [Google Scholar]
- Costa-Mattioli M, Sossin WS, Klann E, Sonenberg N. Translational control of long-lasting synaptic plasticity and memory. Neuron. 2009;61:10–26. doi: 10.1016/j.neuron.2008.10.055. [DOI] [PMC free article] [PubMed] [Google Scholar]
- Darnell JC, Klann E. The translation of translational control by FMRP: therapeutic targets for FXS. Nat Neurosci. 2013;16:1530–1536. doi: 10.1038/nn.3379. [DOI] [PMC free article] [PubMed] [Google Scholar]
- Darnell JC, Van Driesche SJ, Zhang C, Hung KY, Mele A, Fraser CE, Stone EF, Chen C, Fak JJ, Chi SW, et al. FMRP stalls ribosomal translocation on mRNAs linked to synaptic function and autism. Cell. 2011;146:247–261. doi: 10.1016/j.cell.2011.06.013. [DOI] [PMC free article] [PubMed] [Google Scholar]
- Darnell RB. RNA protein interaction in neurons. Annu Rev Neurosci. 2013;36:243–270. doi: 10.1146/annurev-neuro-062912-114322. [DOI] [PMC free article] [PubMed] [Google Scholar]
- Elkon R, Ugalde AP, Agami R. Alternative cleavage and polyadenylation: extent, regulation and function. Nat Rev Genet. 2013;14:496–506. doi: 10.1038/nrg3482. [DOI] [PubMed] [Google Scholar]
- Floor SN, Doudna JA. Tunable protein synthesis by transcript isoforms in human cells. Elife. 2016;5 doi: 10.7554/eLife.10921. [DOI] [PMC free article] [PubMed] [Google Scholar]
- Freibaum BD, Taylor JP. The Role of Dipeptide Repeats in C9ORF72-Related ALS-FTD. Front Mol Neurosci. 2017;10:35. doi: 10.3389/fnmol.2017.00035. [DOI] [PMC free article] [PubMed] [Google Scholar]
- Gennarino VA, Alcott CE, Chen CA, Chaudhury A, Gillentine MA, Rosenfeld JA, Parikh S, Wheless JW, Roeder ER, Horovitz DD, et al. NUDT21-spanning CNVs lead to neuropsychiatric disease and altered MeCP2 abundance via alternative polyadenylation. Elife. 2015;4 doi: 10.7554/eLife.10782. [DOI] [PMC free article] [PubMed] [Google Scholar]
- Gkogkas CG, Khoutorsky A, Ran I, Rampakakis E, Nevarko T, Weatherill DB, Vasuta C, Yee S, Truitt M, Dallaire P, et al. Autism-related deficits via dysregulated eIF4E–dependent translational control. Nature. 2013;493:371–377. doi: 10.1038/nature11628. [DOI] [PMC free article] [PubMed] [Google Scholar]
- Graber TE, Hebert-Seropian S, Khoutorsky A, David A, Yewdell JW, Lacaille JC, Sossin WS. Reactivation of stalled polyribosomes in synaptic plasticity. Proc Natl Acad Sci U S A. 2013;110:16205–16210. doi: 10.1073/pnas.1307747110. [DOI] [PMC free article] [PubMed] [Google Scholar]
- Hartman NW, Lin TV, Zhang L, Paquelet GE, Feliciano DM, Bordey A. mTORC1 targets the translational repressor 4E–BP2, but not S6 kinase 1/2, to regulate neural stem cell self-renewal in vivo. Cell Rep. 2013;5:433–444. doi: 10.1016/j.celrep.2013.09.017. [DOI] [PubMed] [Google Scholar]
- Heyer EE, Moore MJ. Redefining the Translational Status of 80S Monosomes. Cell. 2016;164:757–769. doi: 10.1016/j.cell.2016.01.003. [DOI] [PubMed] [Google Scholar]
- Hilgers V, Lemke SB, Levine M. ELAV mediates 3’ UTR extension in the Drosophila nervous system. Genes Dev. 2012;26:2259–2264. doi: 10.1101/gad.199653.112. [DOI] [PMC free article] [PubMed] [Google Scholar]
- Hilgers V, Perry MW, Hendrix D, Stark A, Levine M, Haley B. Neural-specific elongation of 3’ UTRs during Drosophila development. Proc Natl Acad Sci U S A. 2011;108:15864–15869. doi: 10.1073/pnas.1112672108. [DOI] [PMC free article] [PubMed] [Google Scholar]
- Hinnebusch AG, Ivanov IP, Sonenberg N. Translational control by 5’-untranslated regions of eukaryotic mRNAs. Science. 2016;352:1413–1416. doi: 10.1126/science.aad9868. [DOI] [PMC free article] [PubMed] [Google Scholar]
- Holt CE, Schuman EM. The central dogma decentralized: new perspectives on RNA function and local translation in neurons. Neuron. 2013;80:648–657. doi: 10.1016/j.neuron.2013.10.036. [DOI] [PMC free article] [PubMed] [Google Scholar]
- Ingolia NT. Ribosome profiling: new views of translation, from single codons to genome scale. Nat Rev Genet. 2014;15:205–213. doi: 10.1038/nrg3645. [DOI] [PubMed] [Google Scholar]
- Ingolia NT, Ghaemmaghami S, Newman JR, Weissman JS. Genome-wide analysis in vivo of translation with nucleotide resolution using ribosome profiling. Science. 2009;324:218–223. doi: 10.1126/science.1168978. [DOI] [PMC free article] [PubMed] [Google Scholar]
- Ingolia NT, Lareau LF, Weissman JS. Ribosome profiling of mouse embryonic stem cells reveals the complexity and dynamics of mammalian proteomes. Cell. 2011;147:789–802. doi: 10.1016/j.cell.2011.10.002. [DOI] [PMC free article] [PubMed] [Google Scholar]
- Kelleher RJ, 3rd, Bear MF. The autistic neuron: troubled translation? Cell. 2008;135:401–406. doi: 10.1016/j.cell.2008.10.017. [DOI] [PubMed] [Google Scholar]
- Kim D, Langmead B, Salzberg SL. HISAT: a fast spliced aligner with low memory requirements. Nat Methods. 2015;12:357–360. doi: 10.1038/nmeth.3317. [DOI] [PMC free article] [PubMed] [Google Scholar]
- Komili S, Farny NG, Roth FP, Silver PA. Functional specificity among ribosomal proteins regulates gene expression. Cell. 2007;131:557–571. doi: 10.1016/j.cell.2007.08.037. [DOI] [PMC free article] [PubMed] [Google Scholar]
- Kriaucionis S, Bird A. The major form of MeCP2 has a novel N-terminus generated by alternative splicing. Nucleic Acids Res. 2004;32:1818–1823. doi: 10.1093/nar/gkh349. [DOI] [PMC free article] [PubMed] [Google Scholar]
- Langmead B, Salzberg SL. Fast gapped-read alignment with Bowtie 2. Nat Methods. 2012;9:357–359. doi: 10.1038/nmeth.1923. [DOI] [PMC free article] [PubMed] [Google Scholar]
- Lareau LF, Hite DH, Hogan GJ, Brown PO. Distinct stages of the translation elongation cycle revealed by sequencing ribosome-protected mRNA fragments. Elife. 2014;3:e01257. doi: 10.7554/eLife.01257. [DOI] [PMC free article] [PubMed] [Google Scholar]
- Lee AS, Burdeinick-Kerr R, Whelan SP. A ribosome-specialized translation initiation pathway is required for cap-dependent translation of vesicular stomatitis virus mRNAs. Proc Natl Acad Sci U S A. 2013;110:324–329. doi: 10.1073/pnas.1216454109. [DOI] [PMC free article] [PubMed] [Google Scholar]
- Lee AS, Kranzusch PJ, Cate JH. eIF3 targets cell-proliferation messenger RNAs for translational activation or repression. Nature. 2015;522:111–114. doi: 10.1038/nature14267. [DOI] [PMC free article] [PubMed] [Google Scholar]
- Lengner CJ, Gimelbrant AA, Erwin JA, Cheng AW, Guenther MG, Welstead GG, Alagappan R, Frampton GM, Xu P, Muffat J, et al. Derivation of pre-X inactivation human embryonic stem cells under physiological oxygen concentrations. Cell. 2010;141:872–883. doi: 10.1016/j.cell.2010.04.010. [DOI] [PubMed] [Google Scholar]
- Li H, Handsaker B, Wysoker A, Fennell T, Ruan J, Homer N, Marth G, Abecasis G, Durbin R Genome Project Data Processing, S. The Sequence Alignment/Map format and SAMtools. Bioinformatics. 2009;25:2078–2079. doi: 10.1093/bioinformatics/btp352. [DOI] [PMC free article] [PubMed] [Google Scholar]
- Lianoglou S, Garg V, Yang JL, Leslie CS, Mayr C. Ubiquitously transcribed genes use alternative polyadenylation to achieve tissue-specific expression. Genes Dev. 2013;27:2380–2396. doi: 10.1101/gad.229328.113. [DOI] [PMC free article] [PubMed] [Google Scholar]
- Lombardi LM, Baker SA, Zoghbi HY. MECP2 disorders: from the clinic to mice and back. J Clin Invest. 2015;125:2914–2923. doi: 10.1172/JCI78167. [DOI] [PMC free article] [PubMed] [Google Scholar]
- Love MI, Huber W, Anders S. Moderated estimation of fold change and dispersion for RNA-seq data with DESeq2. Genome Biol. 2014;15:550. doi: 10.1186/s13059-014-0550-8. [DOI] [PMC free article] [PubMed] [Google Scholar]
- Magri L, Cambiaghi M, Cominelli M, Alfaro-Cervello C, Cursi M, Pala M, Bulfone A, Garcia-Verdugo JM, Leocani L, Minicucci F, et al. Sustained activation of mTOR pathway in embryonic neural stem cells leads to development of tuberous sclerosis complex-associated lesions. Cell Stem Cell. 2011;9:447–462. doi: 10.1016/j.stem.2011.09.008. [DOI] [PubMed] [Google Scholar]
- Mallon BS, Chenoweth JG, Johnson KR, Hamilton RS, Tesar PJ, Yavatkar AS, Tyson LJ, Park K, Chen KG, Fann YC, et al. StemCellDB: the human pluripotent stem cell database at the National Institutes of Health. Stem Cell Res. 2013;10:57–66. doi: 10.1016/j.scr.2012.09.002. [DOI] [PMC free article] [PubMed] [Google Scholar]
- Martin M. Cutadapt removes adapter sequences from high-throughput sequencing reads. EMBnetjournal. 2011;17:10. [Google Scholar]
- Mayr C. Evolution and Biological Roles of Alternative 3’UTRs. Trends Cell Biol. 2016;26:227–237. doi: 10.1016/j.tcb.2015.10.012. [DOI] [PMC free article] [PubMed] [Google Scholar]
- Mayr C, Bartel DP. Widespread shortening of 3’UTRs by alternative cleavage and polyadenylation activates oncogenes in cancer cells. Cell. 2009;138:673–684. doi: 10.1016/j.cell.2009.06.016. [DOI] [PMC free article] [PubMed] [Google Scholar]
- Merritt C, Rasoloson D, Ko D, Seydoux G. 3’ UTRs are the primary regulators of gene expression in the C. elegans germline. Curr Biol. 2008;18:1476–1482. doi: 10.1016/j.cub.2008.08.013. [DOI] [PMC free article] [PubMed] [Google Scholar]
- Miura P, Shenker S, Andreu-Agullo C, Westholm JO, Lai EC. Widespread and extensive lengthening of 3’ UTRs in the mammalian brain. Genome Res. 2013;23:812–825. doi: 10.1101/gr.146886.112. [DOI] [PMC free article] [PubMed] [Google Scholar]
- Oh SK, Kim HS, Ahn HJ, Seol HW, Kim YY, Park YB, Yoon CJ, Kim DW, Kim SH, Moon SY. Derivation and characterization of new human embryonic stem cell lines: SNUhES1, SNUhES2, and SNUhES3. Stem Cells. 2005;23:211–219. doi: 10.1634/stemcells.2004-0122. [DOI] [PubMed] [Google Scholar]
- Pilaz LJ, Silver DL. Post-transcriptional regulation in corticogenesis: how RNA-binding proteins help build the brain. Wiley Interdiscip Rev RNA. 2015;6:501–515. doi: 10.1002/wrna.1289. [DOI] [PMC free article] [PubMed] [Google Scholar]
- Pollen AA, Nowakowski TJ, Shuga J, Wang X, Leyrat AA, Lui JH, Li N, Szpankowski L, Fowler B, Chen P, et al. Low-coverage single-cell mRNA sequencing reveals cellular heterogeneity and activated signaling pathways in developing cerebral cortex. Nat Biotechnol. 2014;32:1053–1058. doi: 10.1038/nbt.2967. [DOI] [PMC free article] [PubMed] [Google Scholar]
- Pourdehnad M, Truitt ML, Siddiqi IN, Ducker GS, Shokat KM, Ruggero D. Myc and mTOR converge on a common node in protein synthesis control that confers synthetic lethality in Myc-driven cancers. Proc Natl Acad Sci U S A. 2013;110:11988–11993. doi: 10.1073/pnas.1310230110. [DOI] [PMC free article] [PubMed] [Google Scholar]
- Quinlan AR. BEDTools: The Swiss-Army Tool for Genome Feature Analysis. Curr Protoc Bioinformatics. 2014;47:11–34. doi: 10.1002/0471250953.bi1112s47. 11 12. [DOI] [PMC free article] [PubMed] [Google Scholar]
- Raj B, Blencowe BJ. Alternative Splicing in the Mammalian Nervous System: Recent Insights into Mechanisms and Functional Roles. Neuron. 2015;87:14–27. doi: 10.1016/j.neuron.2015.05.004. [DOI] [PubMed] [Google Scholar]
- Ramskold D, Wang ET, Burge CB, Sandberg R. An abundance of ubiquitously expressed genes revealed by tissue transcriptome sequence data. PLoS Comput Biol. 2009;5:e1000598. doi: 10.1371/journal.pcbi.1000598. [DOI] [PMC free article] [PubMed] [Google Scholar]
- Rodrigues DC, Kim DS, Yang G, Zaslavsky K, Ha KC, Mok RS, Ross PJ, Zhao M, Piekna A, Wei W, et al. MECP2 Is Post-transcriptionally Regulated during Human Neurodevelopment by Combinatorial Action of RNA-Binding Proteins and miRNAs. Cell Rep. 2016;17:720–734. doi: 10.1016/j.celrep.2016.09.049. [DOI] [PubMed] [Google Scholar]
- Sampath P, Pritchard DK, Pabon L, Reinecke H, Schwartz SM, Morris DR, Murry CE. A hierarchical network controls protein translation during murine embryonic stem cell self-renewal and differentiation. Cell Stem Cell. 2008;2:448–460. doi: 10.1016/j.stem.2008.03.013. [DOI] [PubMed] [Google Scholar]
- Sanchez CG, Teixeira FK, Czech B, Preall JB, Zamparini AL, Seifert JR, Malone CD, Hannon GJ, Lehmann R. Regulation of Ribosome Biogenesis and Protein Synthesis Controls Germline Stem Cell Differentiation. Cell Stem Cell. 2016;18:276–290. doi: 10.1016/j.stem.2015.11.004. [DOI] [PMC free article] [PubMed] [Google Scholar]
- Sandberg R, Neilson JR, Sarma A, Sharp PA, Burge CB. Proliferating cells express mRNAs with shortened 3' untranslated regions and fewer microRNA target sites. Science. 2008;320:1643–1647. doi: 10.1126/science.1155390. [DOI] [PMC free article] [PubMed] [Google Scholar]
- Schmieder R, Edwards R. Quality control and preprocessing of metagenomic datasets. Bioinformatics. 2011;27:863–864. doi: 10.1093/bioinformatics/btr026. [DOI] [PMC free article] [PubMed] [Google Scholar]
- Shenoy A, Blelloch RH. Regulation of microRNA function in somatic stem cell proliferation and differentiation. Nat Rev Mol Cell Biol. 2014;15:565–576. doi: 10.1038/nrm3854. [DOI] [PMC free article] [PubMed] [Google Scholar]
- Shi Z, Barna M. Translating the genome in time and space: specialized ribosomes, RNA regulons, and RNA-binding proteins. Annu Rev Cell Dev Biol. 2015;31:31–54. doi: 10.1146/annurev-cellbio-100814-125346. [DOI] [PubMed] [Google Scholar]
- Signer RA, Magee JA, Salic A, Morrison SJ. Haematopoietic stem cells require a highly regulated protein synthesis rate. Nature. 2014;509:49–54. doi: 10.1038/nature13035. [DOI] [PMC free article] [PubMed] [Google Scholar]
- Singh P, Alley TL, Wright SM, Kamdar S, Schott W, Wilpan RY, Mills KD, Graber JH. Global changes in processing of mRNA 3’ untranslated regions characterize clinically distinct cancer subtypes. Cancer Res. 2009;69:9422–9430. doi: 10.1158/0008-5472.CAN-09-2236. [DOI] [PMC free article] [PubMed] [Google Scholar]
- Sterne-Weiler T, Martinez-Nunez RT, Howard JM, Cvitovik I, Katzman S, Tariq MA, Pourmand N, Sanford JR. Frac-seq reveals isoform-specific recruitment to polyribosomes. Genome Res. 2013;23:1615–1623. doi: 10.1101/gr.148585.112. [DOI] [PMC free article] [PubMed] [Google Scholar]
- Taliaferro JM, Vidaki M, Oliveira R, Olson S, Zhan L, Saxena T, Wang ET, Graveley BR, Gertler FB, Swanson MS, et al. Distal Alternative Last Exons Localize mRNAs to Neural Projections. Mol Cell. 2016;61:821–833. doi: 10.1016/j.molcel.2016.01.020. [DOI] [PMC free article] [PubMed] [Google Scholar]
- Thoreen CC, Chantranupong L, Keys HR, Wang T, Gray NS, Sabatini DM. A unifying model for mTORC1-mediated regulation of mRNA translation. Nature. 2012;485:109–113. doi: 10.1038/nature11083. [DOI] [PMC free article] [PubMed] [Google Scholar]
- Thorvaldsdottir H, Robinson JT, Mesirov JP. Integrative Genomics Viewer (IGV): high-performance genomics data visualization and exploration. Brief Bioinform. 2013;14:178–192. doi: 10.1093/bib/bbs017. [DOI] [PMC free article] [PubMed] [Google Scholar]
- Tian B, Manley JL. Alternative polyadenylation of mRNA precursors. Nat Rev Mol Cell Biol. 2017;18:18–30. doi: 10.1038/nrm.2016.116. [DOI] [PMC free article] [PubMed] [Google Scholar]
- Van Epps H, Dai Y, Qi Y, Goncharov A, Jin Y. Nuclear pre-mRNA 3’-end processing regulates synapse and axon development in C. elegans. Development. 2010;137:2237–2250. doi: 10.1242/dev.049692. [DOI] [PMC free article] [PubMed] [Google Scholar]
- van Riggelen J, Yetil A, Felsher DW. MYC as a regulator of ribosome biogenesis and protein synthesis. Nat Rev Cancer. 2010;10:301–309. doi: 10.1038/nrc2819. [DOI] [PubMed] [Google Scholar]
- Wong QW, Vaz C, Lee QY, Zhao TY, Luo R, Archer SK, Preiss T, Tanavde V, Vardy LA. Embryonic Stem Cells Exhibit mRNA Isoform Specific Translational Regulation. PLoS One. 2016;11:e0143235. doi: 10.1371/journal.pone.0143235. [DOI] [PMC free article] [PubMed] [Google Scholar]
- Xue S, Tian S, Fujii K, Kladwang W, Das R, Barna M. RNA regulons in Hox 5’ UTRs confer ribosome specificity to gene regulation. Nature. 2015;517:33–38. doi: 10.1038/nature14010. [DOI] [PMC free article] [PubMed] [Google Scholar]
Associated Data
This section collects any data citations, data availability statements, or supplementary materials included in this article.
Supplementary Materials
Table S1. Read tracking for all sequencing libraries, Related to Figure 2 and 4.
Table S2. Statistical testing of changes in RNAseq and ribosome profiling from DESeq2, Related to Figure 2.
Table S4. Quantified expression values for TrIP-seq polysome profiling samples, Related to Figure 4.
Table S5. Clustered transcripts and expression values for TrIP-seq polysome profiling samples, Related to Figure 5.