Abstract
Background:
The lossy compression algorithm produces different results in various con-trasts areas. Low contrast area image quality declines greater than that of high contrast regions using equal compression ratio. These results were obtained in a subjective study. The objective image quali-ty metrics are more effective if the calculation method is more closely related to the human vision re-sults.
Methods:
This study first measured the PSNR and MI for discrimination between different contrast areas responding to lossy image compression in a SMPTE electronic pattern. The MI was consistent with human vision results in SMPTE electronic phantom but PSNR was not. The measurement was also applied to compressed medical images in different contrast cropping regions.
Results:
The MI was found to be close to human vision in CT and MR but not CRX. Both weighted PSNR and weighted MI were created to respond to the gray value and the contrast areas affected the quality estimation.
Conclusion:
The W-PSNR and W-MI showed that they can discriminate between different contrast areas using image compression ratios and the series of lines are equal to the contrast values and better than the tranditional approach. The W-MI measures were found to perform better than W-PSNR and can be used as an image quality index.
Keywords: JPEG2000, medical image compression, image quality, mutual information, PSNR, W-MI measures
1. Introduction
Data compression schemes are required for the effective storage and transmission of large medical digital data archived datasets, Picture Archiving and Communications Systems (PACS), telemedicine networks and Radiology Information Systems (RIS) [1, 2].
The lossless or lossy schemes had applied to different image compression techniques [3-5]. The lossless scheme allows full recovery of the original data from the compressed image version but only achieves a maximum compression ratio of about 2 to 4 (CR: compression ratio = size of original/size of compressed image) [2]. The lossy compression method has a great effect on both the space savings and transmission speed at higher CR but at the expense of image quality. However, the original reconstructed images cannot be fully recovered after reconstruction [2].
Many studies have been devoted to medical image quality evaluation for the decline in image quality acceptance level or the development of lossy digital image compression techniques [6-9]. Subjective and objective metrics were both extensively used to evaluate medical image compression quality performance. These metrics include receiver operating characteristics (ROC) or mean opinion score (MOS) for subjective and mean square error (MSE) or peak signal to noise ratio (PSNR) for objective metrics.
The objective methods are based on mathematical formulas that calculate the changes between the original and compressed images. A reconstructed image has good quality if the discrepancy between the compressed and original image is small. Objective scheme image quality estimation metrics are simple, fast and convenient. However, most of these metrics do not correlate well with human vision results [10]. The ROC analysis is a method for subjectively evaluating image quality. Radiologists were asked to review the manipulated images with or without an abnormality to provide a binary decision along with their degree of certainty [11]. The diagnostic accuracies of these images were then compared with that of the original images. A typical ROC study would require more than 300 images to obtain a statistically significant result [12]. This analysis is expensive and time-consuming but the subjective scheme provides final image quality judgments. Therefore, the simple and convenient objective image quality metrics would be more effective if these calculations were closer to the human vision results.
A previous study [9] evaluated image quality using three radiologists after image compression and transmission. They found that, for lossy image compression, the high-contrast resolution regions in the compressed image did not decrease at CR of around 10 and 20. There was a loss in the low contrast resolution areas at 1% and 5% modulation, corresponding to 10:1 and 20:1 compression, respectively. This paper indicated that the lossy image compression produces different results in diverse contrast areas. The low contrast areas presented declined image quality more than the high contrast regions using equal CR.
Shiao et al. also found that the PSNR showed different results in each high or low contrast area in a SMPTE (Society of Motion Picture and Television Engineers) test pattern [13]. The PSNR discrepancies increase corresponding to the increasing contrast between the JPEG and JPEG2000 image compression algorithms [13]. In the high contrast areas the JPEG2000 PSNR showed bigger discrepancies to JPEG than the low contrast areas produced using equal CR. They found that, “the differences in PSNR curves between JPEG and JJ2000 in the high contrast areas were greater than those in the low contrast areas”. The contrast affects the image compression results if the image quality is estimated using PSNR [13].
“Information preserving” is a term suggested by the American College of Radiology and the National Electrical Manufacturers Association (ACR-NEMA). Compression is defined as information preserving if the resulting image retains all of the significant information in the original image [14, 15]. The information preserving measurement is based on subjective points.
Mutual information calculations (MI) were recently used as an image quality indicator in Radiology. Tsai et al. and Matsuyama et al. used MI as a measure to express the amount of information that an output image contains in comparison to an input object on an X-ray imaging system [16, 17]. The MI was used to evaluate the performances of a medical imaging system in their studies. The MI is an information variation estimation based on objective points. This calculation process was developed for evaluating an original image against a lossy compression image.
Sheikh and Bovik measured MI as a quality index between the source and distorted images and compared to a subjective study [18]. Their report showed the MI measurement method outperforms recent state-of-the-art image QA algorithms. MI originated from information theory and has been used as an effective similarity metric in medical image registration tasks and template matching schemes, and as feature selection criterion in computer-aided detection [19-21].
MI was used as an image quality index for medical images. The amount of reduced information associated with an original image after compression, the difference in the information preservation is equal to the MI value. The greater the MI value, the better the image quality is and the greater the information preserved in the image. Does the information preservation estimation correspond to the previous subjective study?
This study first measured the PSNR and MI to correspond to a previous human vision test on SMPTE electronic phantom. MI is applied in this work to three medical modalities in different contrast regions and makes a comparison with PSNR. The average gray and contrast values were introduced to PSNR and MI as weighted PSNR and weighted MI. Both W-PSNR and W-MI showed that they can discriminate between each contrast area corresponding to the image compression ratios and the series of lines are equal to the contrast values.
2. Materials and Methods
A and B represent the original and reconstructed image, respectively. The pixel values are denoted as PA and PB, respectively.
2.1. Mutual Information
MI is a basic concept in information theory. It has been applied for the registration of multimodal medical images and evaluated as the medical imaging system performance value. The algorithm definition is presented in the literature [22].
Given events s1,s2,……,sn occurring with probabilities p1, p2,……, pn, the Shannon entropy H is defined as [23]:
(1).
Considering A and B as two random variables corresponding to an original image and a reconstructed image, the entropy for these images are denoted as H(PA) and H(PB), respectively. For this case the MI can be defined as:
(2)
where H(PA,PB) is the joint entropy, and HPA (PB) and HPB(PA) are conditional entropies. The MI conveys the amount of information that output PB has about input PA. A higher MI means lower information loss.
2.2. PSNR
The PSNR is a measure that indicates how “close” one image is to another. This measured error metric is:
(3)
where n is the depth of the bits in a pixel.
This index has generally been widely used to estimate reconstruction quality for lossy image compression algorithms. PSNR is an approximation to the human vision evaluations of reconstruction quality. Articles suggest that PSNR in lossy images with video compression are typically between 30 to 50 dB [24, 25].
2.3. Images
In this study a SMPTE electronic phantom test pattern was selected to verify the PSNR and MI results. Gaussian noise (μ=100, σ=20) was added to the test pattern to simulate real medical images.
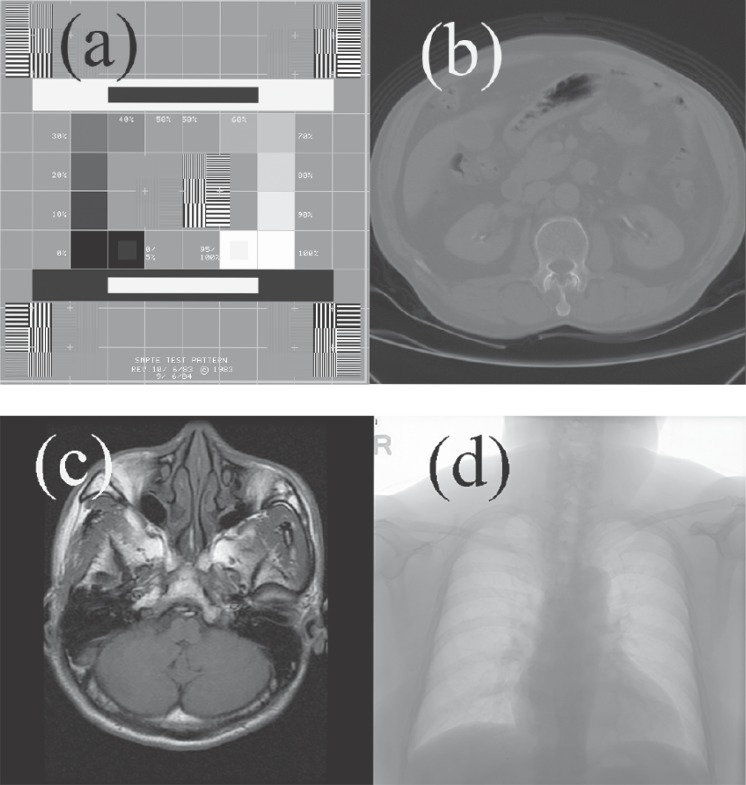
Three common radiological images were used in this study: a CT body image (tomographic x-ray image), a chest image from Computed Radiography (projected x-ray image,CRX) and a MR head image (tomographic intensity image). The CT data were from a series of 3D studies produced using a GE 9800 scanner with a 512 × 512 image size 12 bits deep. The CRX image was from an AGFA ADC-51 CR system with a 2048×2494 image size 12 bits deep. The MR image was produced using a GE Signal 1.5 T scanner with a 512×512 image size 12 bits deep. These images were chosen randomly from a PACS system at a general hospital in Central Taiwan. Fig. () shows these images.
Fig. (1).
A SMPTE test pattern with three medical images from different modalities, a SMPTE (a), an abdominal CT (b), a MR head (c) and a CRX chest (d).
2.4. Image Compression Algorithms
JPEG2000 medical image compression software, JJ2000 (version 4.1, available on the Internet at http://jj2000.epfl.ch) was used in this study.
2.5. Contrast
The contrast C of a periodic pattern such as a sinusoidal grating is measured with the Michelson formula [26, 27]:
(4)
where Lmax and Lmin are the maximum and minimum luminance values in the gratings, respectively.
3. Results
Images were first compressed at ten different CRs, each based on a “Q” option provided by JJ2000. Following that, the quality of the reconstructed images was evaluated using the above algorithms.
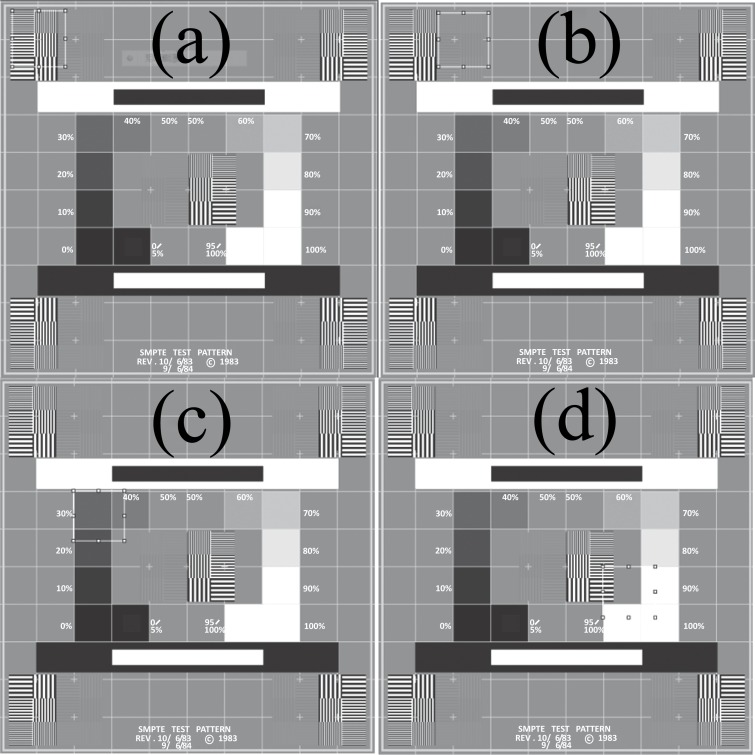
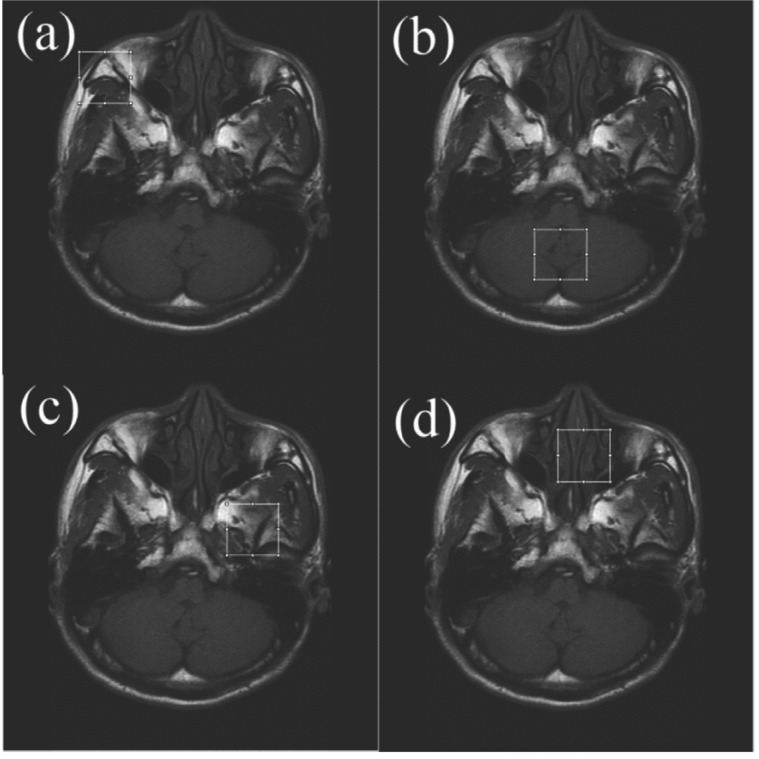
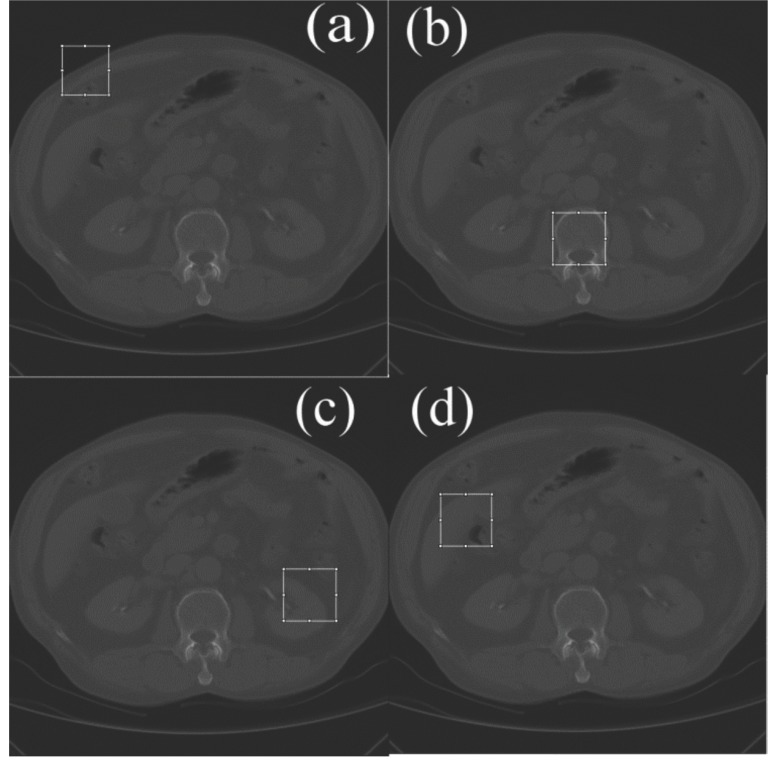
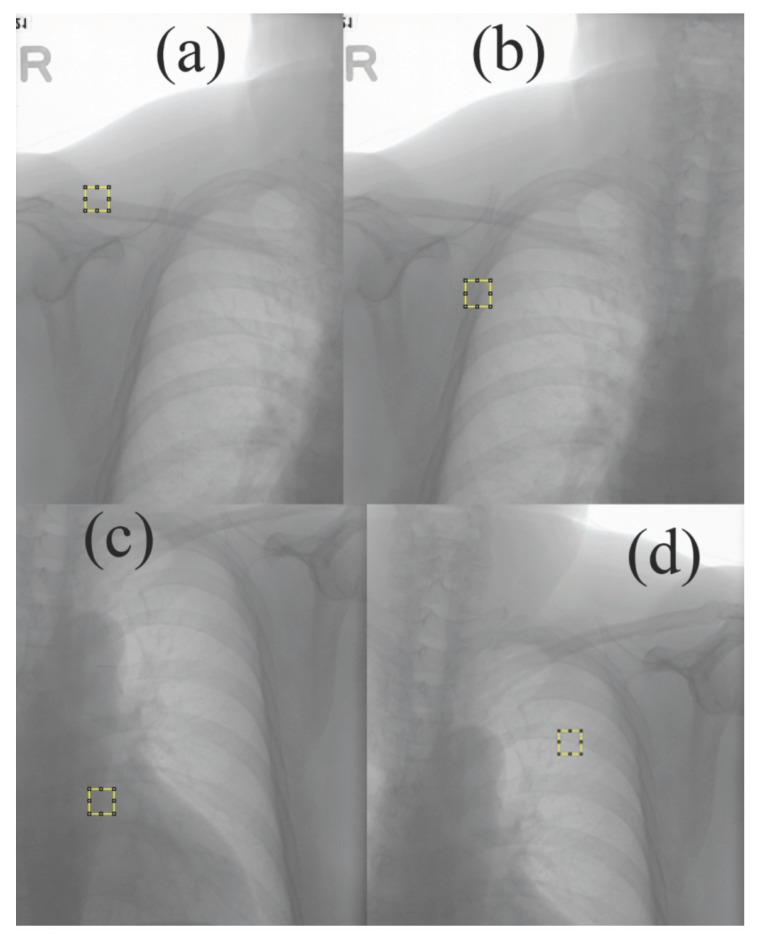
Four different positions each with a size of 70 × 70 pixels in the image were chosen and cropped. Because a striped SMPTE pattern is around 65 pixels in width, these areas were selected visually based on their different contrasts. These areas were then cropped to measure their PSNR and MI at various CR. The selected areas are shown in Figs. (2-5).
Fig. (2).
Four SMPTE show different cropped positions.
Fig. (5).
Four MR images show different cropped positions.
The contrast of each croped region was measured using equation (4). To avoid the extreme contrast in selected areas, Lmax and Lmin were measured by averaging the 1% top and lowest pixel values in each selected area, respectively. The contrasts (C) of the selected areas for the various modalities are shown in Tables 1 and 2. The “a, b, c, d ” in these two tables correspond to each a, b, c, d subfigures in Figs. (2-5).
Table 1.
Contrasts (C) of SMPTE in selected areas.
| Areas | a | b | c | d |
|---|---|---|---|---|
| C | 0.1 | 0.06 | 0.07 | 0.09 |
Table 2.
Contrasts (C) of medical images in selected areas.
| Areas | a | b | c | d |
|---|---|---|---|---|
| CT | 0.34 | 0.18 | 0.08 | 0.19 |
| MR | 0.99 | 0.56 | 0.93 | 0.95 |
| CRX | 0.09 | 0.10 | 0.09 | 0.07 |
3.1. The SMPTE
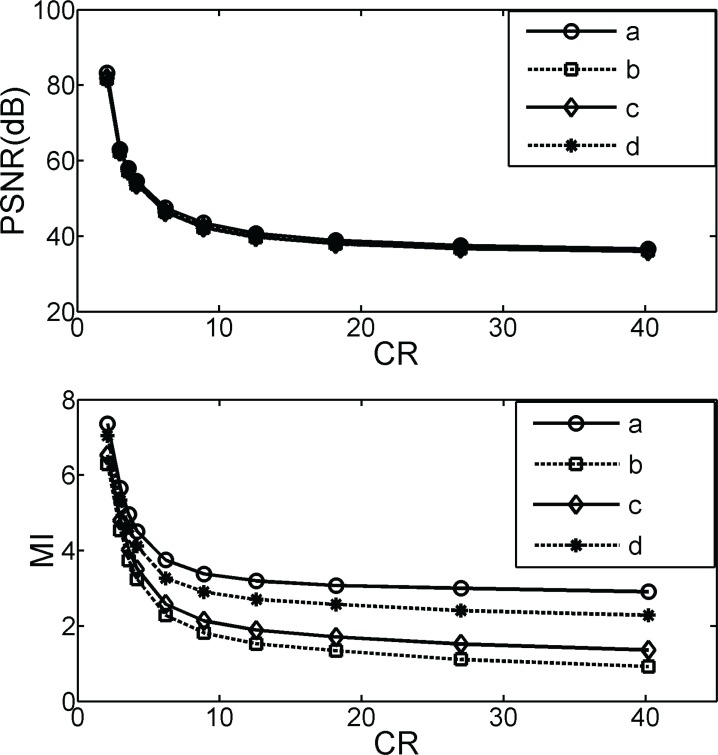
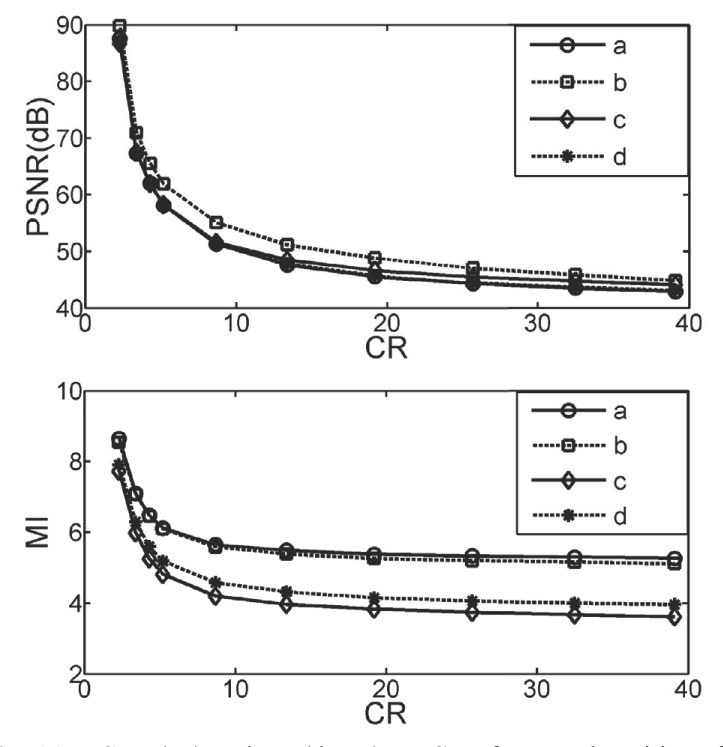
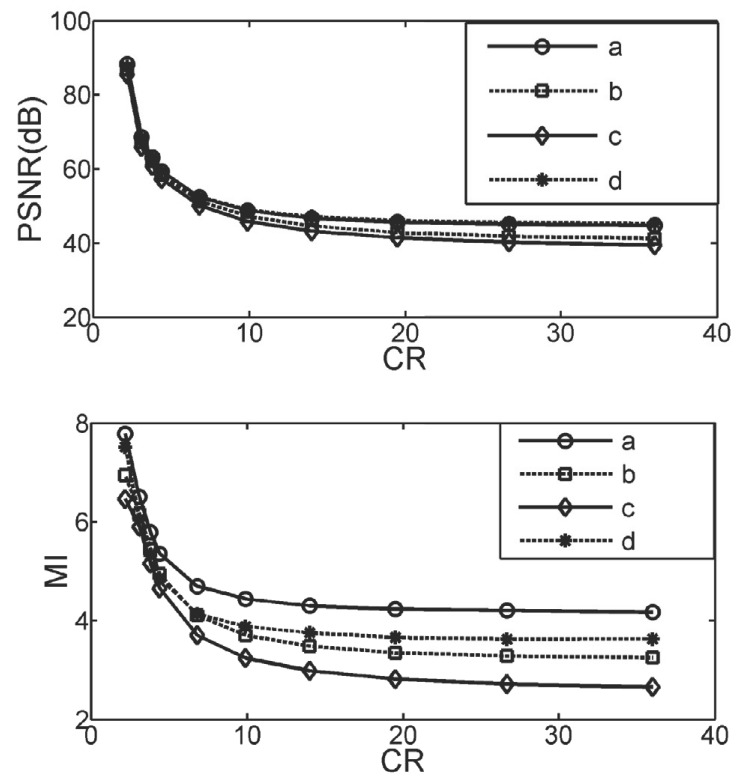
A higher C value corresponds to a higher contrast in the image. Fig. (2a) has the highest C and 2(b) is the lowest. The contrast sequence is a > d > c > b as noted in Table 1. The PSNR and MI measurements, respectively, on ten different CR for the croped areas in Fig. (2) were performed and shown in Fig. (3). The PSNR and MI trends are the same which explains that MI can be used as a image quality index for image compression. The PSNR are totally merged and any areas can be distinguished. In contrast, the MI differantiation results for each contrast area and the series of lines (a > d > c > b) are equal to the contrast values shown in Table 1. This shows tha, the MI method can detect different contrast areas and the high-contrast resolution regions of the compressed image are decreased in quality less. This is also consistent with the suggestion in a previous report [9].
Fig. (3).
PSNR (up) and MI (down) vs. CR of cropped positions for SMPTE. Lines a, b, c, d correspond to Fig. (2a, b, c, d).
3.2. Medical Images
Fig. (4a) produced highest C with the CT modality and (4c) was lowest as noted in Table 2 and also in Fig. (4). These are the same as the visual results. The same areas in the MR modality (a) had highest and (b) lowest and (c), (d) were in the middle and around the same. For the CRX modality the C values in four selcted areas were nearly the same, relatively area (d) was lower as noted in Table 2 and Fig. (6). The CRX and CT images were formed using x-ray projection. X-ray contrasts are inherently smaller than those in tomographic images. The CT contrast is higher than CRX but it was not as good as that in the MR images. MR is an intense image with the biggest contrast.
Fig. (4).
Four CT images show different cropped positions.
Fig. (6).
Four CRX images show different cropped positions.
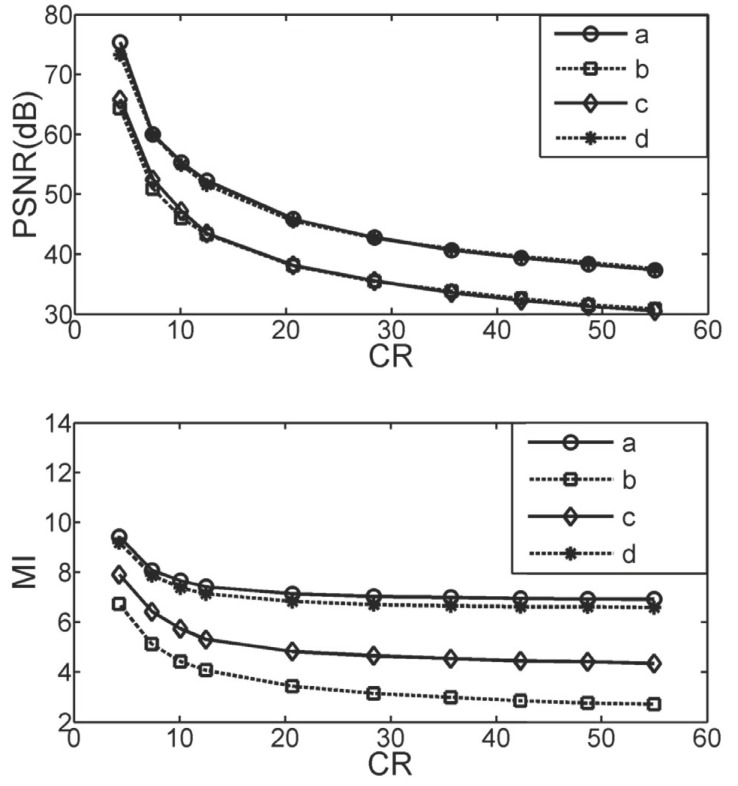
The PSNRs for the three modalities are shown in the upper part of Figs. (7, 8 and 9), respectively. All PSNR lines are obviously not in response to the variations in contrast in the selected image areas, as noted in these Figures. In the low CR regions (i.e. CR< 20) the PSNRs are almost joined. The lines in Fig. (8) (up) show that the PSNR for lines (b) and (c) are the same but area (b) has lowest C value in the MR images in Table 2. The PSNR cannot detect lossy compression differneces in different contrast regions.
Fig. (7).
PSNR (up) and MI (down) vs. CR of cropped positions for the CT image. Lines a, b, c, d correspond to Fig. (4a, b, c, d).
Fig. (8).
PSNR (up) and MI (down) vs. CR of cropped positions for the MR image. Lines a, b, c, d correspond to Fig. (5a, 5b, 5c, d).
Fig. (9).
PSNR (up) and MI (down) vs. CR of cropped positions for the CRX image. Lines a, b, c, d correspond to Fig. (6a, 6b, c, d).
The MI for the three modalities is shown in the lower part of Figs. (7-9) respectively. All MI lines respond to the variations in contrast in the selected image areas, as noted in these Figures. The CT area (a) has the highest contrast and (c) has the lowest, as in Table 2, which corresponds to the top and bottom MI lines (line a and line c) in Fig. (7) (down). The high contrast areas present less quality decline and higher MI, which corresponds to subjective vision. The image qualities declined in the low contrast areas more than in the high contrast regions using equal CR. The MI calculation obviously complies with the human visual system, in this image.
The MR image in Fig. (8) (down) line (a) at the top presents the highest contrast area MI. MR (a) has the top C value as shown in Table 2. In contrast, the smallest C in the MR image is area (b). The MI line is on the bottom as shown in Fig. (8) (down). The MI measures are better than PSNR and correspond to the previous work [9].
In Fig. (9) (down) for the CRX image, the top MI (line a) has the top C value as shown in Table 2. The CRX image contrast is low and presents no diversity. The MI measurement effectiveness was pooled in the CRX image, which was not the same as those in the CT and MR.
4. Discussion
4.1. Gray Level and Contrast
The MI measurements in SMPTE can distinguish between the high and low contrast areas against equal image compression ratios. This effect is consistent with the human vision test that the high contrast areas were less distorted than in low areas using equal CR [9]. However, the PSNR results did not show any discrimination between different contrast regions.
Shiao et al. found that Universal Quality Index (UQI) measurements [10] depended on the average pixel values and variances in pixels in the window. The gray-level of pixels plays a role in the UQI estimation and causes a shift in image quality if the pixel gray-levels vary [13]. The average pixel values of four cropped areas for SMPTE are 1107 to 1146, for CT are 1703 to 2197. For MR the values are 213 to 381, and for CRX 1650 to 2451. The CRX image has a wild gray level variation span and the SMPTE variation span narrower. Because the contrast is also a function of the top and bottom gray levels in each window, as noted in equation (4). Both pixel values and the contrast in the cropped area may play roles in the PSNR and MI measurements.
4.2. Weighing by Gray Level and Contrast
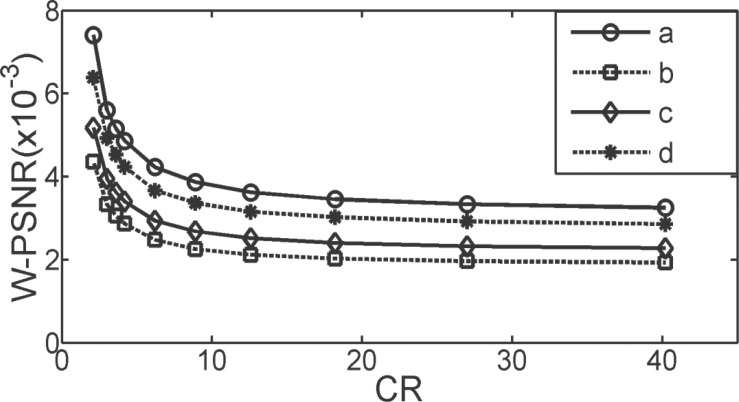
A “weighed PSNR” (W-PSNR) can be created using PSNR multiplied by the inverse mean gray value and contrast (C) of a cropped area. Fig. (10) shows the trends of each W-PSNR for four cropped areas in SMPTE. The W-PSNR discriminates between each contrast area successfully and the series of lines (a > d > c > b) are equal to the contrast values in Table 1.
Fig. (10).
The W-PSNR vs. CR of cropped positions for SMPTE. Lines a, b, c, d correspond to Fig. (2a, b, c, d).
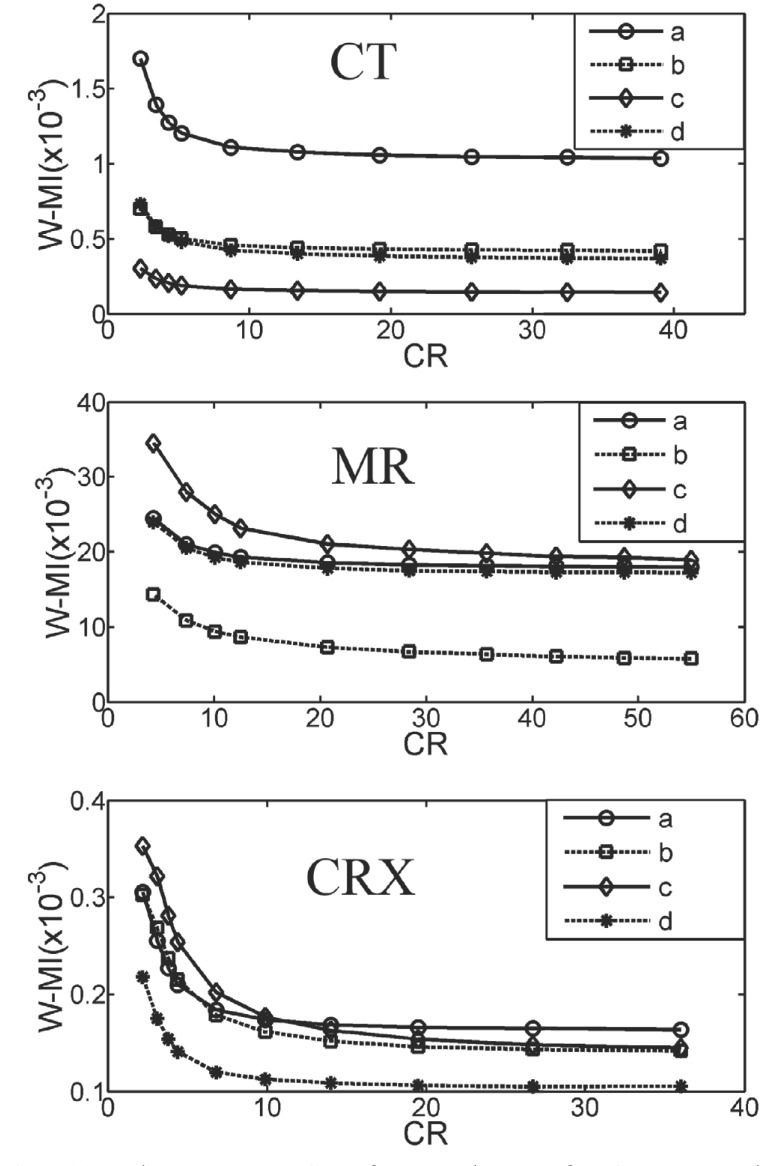
A weighed MI (W-MI) can also be produced using MI multiplied by the inverse mean gray value and contrast (C) of a cropped area. Fig. (11) shows the trends of each W-MI for four cropped areas in three medical images. The W-MI results are better than pure MI only. For CT contrasts, area (a) is higher on the top and (c) is lower on the bottom, (b) same with (d), as noted in Table II. For CT, Fig. (11) (CT) categorizes these contrast values better. For MR, areas (a), (c), (d) have the same contrast and (b) is lower on bottom, as seen in Table 2. For MR, W-MI sorted these contrast values well. For CRX, contrasts in areas (a), (b), (c) are almost equal and (d) is lower on the bottom, as noted in Table 2. In Fig. (11), CRX, W-MI discriminated between these contrast values very well.
Fig. (11).
The W-MI vs. CR of cropped areas for CT, MR and CRX. Lines a, b, c, d correspond to each croping areas (a), (b), (c), (d) in Figs. (4-6).
The W-PSNR and W-MI can discriminate between each contrast area corresponding to the image compression ratios and the series of lines are equal to the contrast values. However, the weighing results of MI on medical images are better than the weighing of PSNR (not shown here). More research with human vision is needed on this effect in the future. This phenomena may be used to index image denoising or enhancement in different contrast regions.
Conclusion
This study measured the PSNR and MI to correspond to a previous human vision test in the discrimination of diverse contrast areas responding to lossy image compression. The MI measurement significantly complied with the human vision results in SMPTE electronic phantom but PSNR did not. The MI was also applied to the CRX image. Based on a previous paper, the average gray and contrast values were introduced to PSNR and MI as weighed PSNR and weighed MI. Both W-PSNR and W-MI showed that they can discriminate between each contrast area corresponding to image compression ratios and the series of lines are equal to the contrast values. W-MI can be used as an image quality index. More advanced research is needed on W-PSNR and W-MI in the future for application to image procession areas.
ETHICS APPROVAL AND CONSENT TO PARTICIPATE
Not applicable.
HUMAN AND ANIMAL RIGHTS
No Animals/Humans were used for studies that are base of this research.
CONSENT FOR PUBLICATION
Not applicable.
ACKNOWLEDGEMENTS
This work was supported in part by four research grants from Wuyi University and Fujian Province, China:
1. Scientific Research Grants, Wuyi University, Wuyishan, Fujian, 354300 China. (XQ1203).
2. Scientific Research Grants for Young and Middle-aged Teacher, Fujian Province, China. (JA13317).
3. Nature Science Foundation of Fujian Province, China. (2017J01780).
4. Fujian Province 2011 Collaborative Innovation Center of Chinese Oolong Tea Industry-Collaborative Innovation Center (2011) of Fujian Province.
CONFLICT OF INTEREST
The authors declare no conflict of interest, financial or otherwise.
REFERENCES
- 1.Huang H.K. PACS – Picture Archiving and Communication Systems in Biomedical Imaging. 2nd ed. New York: VCH Publishers; 1996. [Google Scholar]
- 2.Erickson B.J. Irreversible compression of medical images. J. Digit. Imaging. 2002;15(1):5–14. doi: 10.1007/s10278-002-0001-z. [DOI] [PMC free article] [PubMed] [Google Scholar]
- 3.Rabbani M., Jones P.W. Digital image compression techniques. 1st ed. Bellingham, Washington: SPIE Press; 1991. [DOI] [PubMed] [Google Scholar]
- 4.Chen Z.D., Chang R.F., Kuo W.J. Adaptive predictive multiplicative autoregressive model for medical image compression. IEEE Trans Med Img. 1999;18(2):181–184. doi: 10.1109/42.759128. [DOI] [PubMed] [Google Scholar]
- 5.MacMahon H., Doi K., Sanada S., et al. Data compression: Effect on diagnostic accuracy in digital chest radiography. Radiology. 1991;178(1):175–179. doi: 10.1148/radiology.178.1.1984299. [DOI] [PubMed] [Google Scholar]
- 6.Siddiqui K.M., Johnson J.P., Reiner B.I., Siegel E.L. 2005. [Google Scholar]
- 7.Eikelboom R.H., Yogesan K., Barry C.J., et al. Methods and limits of digital image compression of retinal images for telemedicine. Invest. Ophthalmol. Vis. Sci. 2000;41(7):1916–1924. [PubMed] [Google Scholar]
- 8.Brennecke R., Burgel U., Rippin G., Post F., Rupprecht H.J., Meyer J. Comparison of image compression viability for lossy and lossless JPEG and wavelet data reduction in coronary angiography. Int. J. Card. Imaging. 2001;17(1):1–12. doi: 10.1023/a:1010644318298. [DOI] [PubMed] [Google Scholar]
- 9.Kalyanpur A., Neklesa V.P., Taylor C.R., Daftary A.R., Brink A.R. Evaluation of JPEG and wavelet compression of body CT images for direct digital teleradiologic transmission. Radiology. 2000;217(3):772–779. doi: 10.1148/radiology.217.3.r00nv22772. [DOI] [PubMed] [Google Scholar]
- 10.Wang Z., Bovic A.C. A universal image quality index. IEEE Signal Process. Lett. 2002;9(3):81–84. [Google Scholar]
- 11.Swets J.A. ROC analysis applied to the evaluation of medical imaging techniques. Invest. Radiol. 1979;14(2):109–121. doi: 10.1097/00004424-197903000-00002. [DOI] [PubMed] [Google Scholar]
- 12.Wong S., Zaremba L., Gooden D., et al. Radiologic image compression - a review. Proc. IEEE. 1995;83(2):194–219. [Google Scholar]
- 13.Shiao Y.H., Chen T.J., Chuang K.S., Chuang C.C. Quality of compressed medical images. J. Digit. Imaging. 2007;20(2):149–159. doi: 10.1007/s10278-007-9013-z. [DOI] [PMC free article] [PubMed] [Google Scholar]
- 14.Slone R.M., Foos D.H., Whiting B.R., et al. Assessment of visually lossless irreversible image compression: Comparison of three methods by using an image-comparison workstation. Radiology. 2000;215(2):543–553. doi: 10.1148/radiology.215.2.r00ap47543. [DOI] [PubMed] [Google Scholar]
- 15.Cox G.G., Cook L.T., Insana M.P., et al. The effects of lossy compression on the detection of subtle pulmonary nodules. Med. Phys. 1996;23(1):127–132. doi: 10.1118/1.597691. [DOI] [PubMed] [Google Scholar]
- 16.Tsai D.Y., Lee Y., Matsuyama E. Information-entropy measure for evaluation of image. J. Digit. Imaging. 2008;21(3):338–347. doi: 10.1007/s10278-007-9044-5. [DOI] [PMC free article] [PubMed] [Google Scholar]
- 17.Matsuyama E., Tsai D.Y., Lee Y. Mutual information-based evaluation of image quality with its preliminary application to assessment of medical imaging systems. J. Electron. Imaging. 2009;18(3):033011. [Google Scholar]
- 18.Sheikh H.R., Bovik A.C. Image information and visual quality. IEEE Trans. Image Process. 2006;15(2):430–444. doi: 10.1109/tip.2005.859378. [DOI] [PubMed] [Google Scholar]
- 19.Pluim J.P., Maintz J.M., Viergever M.A. Mutual information-based registration of medical images: A survey. IEEE Trans. Med. Imaging. 2003;22(8):986–1004. doi: 10.1109/TMI.2003.815867. [DOI] [PubMed] [Google Scholar]
- 20.Last M., Kandel A., Maimon O. Information-theoretic algorithm for feature selection. Pattern Recognit. Lett. 2001;22(6-7):799–811. [Google Scholar]
- 21.Tourassi G.D., Vargas-Voracek R., Catarious D.M., Floyd C.E. Computer-assisted detection of mammographic masses: A template matching scheme based on mutual information. Med. Phys. 2003;30(8):2123–2130. doi: 10.1118/1.1589494. [DOI] [PubMed] [Google Scholar]
- 22.Cover TM, Thomas JA. Elements of information theory. 1991.
- 23.Shannon C.E. A mathematical theory of communication. Bell Syst. Tech. J. 1948;27:379–423. [Google Scholar]
- 24.Li N., Yan B., Chen G. A measurement study on wireless camera networks.; Second ACM/IEEE International Conference on Distributed Smart Cameras; 2008; Stanford, CA, USA: IEEE; 2008. [Google Scholar]
- 25.Mastriani M. Union is strength in lossy image compression. World Acad. Sci. Eng. Technol. 2009;59:704–721. [Google Scholar]
- 26.Michelson A.A. Studies in Optics. Chicago: Courier Corporation; 1927. [Google Scholar]
- 27.Peli E. Contrast in complex images. J. Opt. Soc. Am. A. 1990;7(10):2032–2040. doi: 10.1364/josaa.7.002032. [DOI] [PubMed] [Google Scholar]


