

Abstract
Background
An estimated 11% of births occur preterm, and survival is improving. Early studies suggested an association between preterm birth and earlier puberty. Given the adverse outcomes associated with early puberty this could have significant public health implications.
The objective of this review was to assess the timing of puberty after preterm birth.
Methods
Pubmed, Embase, Popline, Global Health and Global Health Library were searched using terms relating to “premature birth”, “menarche”, “puberty” and “follow up studies”. Inclusion criteria were a population consisting of pubertal or post-pubertal adolescents and adults; studies which defined preterm delivery in participants and compared outcomes to those after term delivery; and a quantitative assessment of pubertal onset. Assessment of risk of bias was conducted using principles from the Critical Appraisal Study Process.
Results
Our search identified 1051 studies, of which 16 met the inclusion criteria. In females, 8 studies found no association between preterm birth and the timing of menarche. Five studies found earlier onset in preterm infants, 1 found later onset, and 1 showed both earlier and later menarche, depending on birth weight. The range of effect of studies showing earlier menarche was - 0.94 to −0.07 years in the preterm group, with a median of - 0.3 years. In males, 2 studies showed earlier onset of puberty in the preterm group, 5 showed no difference, and 1 showed later onset. Most studies did not present outcomes in the form of a mean with standard deviation, precluding a meta-analysis. There was insufficient data to address potential confounding factors.
Conclusions
The published evidence does not suggest that being born preterm leads to a significant acceleration in the onset of puberty. This should prove reassuring for public health purposes, and for clinicians counseling parents of infants born preterm.
Electronic supplementary material
The online version of this article (10.1186/s12887-017-0976-8) contains supplementary material, which is available to authorized users.
Keywords: Menarche, Follow up studies
Background
Preterm birth is common, with an estimated 11% of infants worldwide being born at a gestational age of less than 37 weeks [1]. Survival of preterm infants born even at very early gestations is improving, [2] and thus these patients are now consistently surviving into adolescence and adulthood. It is increasingly recognized that preterm birth is an independent risk factor for adverse cardiometabolic [3] and neurodevelopmental outcomes, [4] even following birth at moderate (32–33 weeks) and late (34–36 weeks) preterm gestation. Although the precise mechanism for preterm deliveries cannot be established in most cases, [5] epidemiological studies have shown a correlation between low socio-economic status, adverse life circumstances, and an increased risk of preterm delivery [5–7]. Earlier puberty, particular in females, has also been linked with lower socioeconomic status and adverse early life circumstances [8, 9]. Like preterm birth, earlier puberty also seems to be associated with an increased risk of cardiovascular [10, 11] and metabolic [12, 13] disease in adult life. In addition, in females earlier sexual development may be linked to an increased risk of cancer, [14, 15] depression, [16] and other psychopathology later in life [14, 17].
Some authors have postulated both preterm birth and earlier puberty as part of a complex of adaptive phenotypic changes (a ‘predictive adaptive response’) made in response to a threatening developmental environment [18]. This hypothesis is supported by early data which showed that preterm birth was associated with earlier (6 months) onset of menarche, as compared to term controls [19]. To examine the hypothesis that preterm birth is associated with a stereotyped phenotypic developmental trajectory, we carried out a systematic review looking at the association between preterm birth and the timing of puberty. Given the morbidity associated with both entities, if there proved to be relationship between the two this would have significant public health consequences. In addition, this information would be important for clinicians counseling parents and eventually patients on the longer term consequences of preterm birth. We therefore asked the research question: in adolescents (Population), what are the effects of being born prematurely at <37 weeks (Exposure) versus being born at term (Comparison) on the timing of onset of puberty (Outcome), as reported in cohort, cross sectional or case control studies (Study design).
Methods
Searches
We carried out a systematic literature review in September 2015 using the following databases: Medline, [20] Embase, [21] and Global Health [22] (all using the OVID interface), [23] Popline [24] and Global Health Library [25]. Search strategies were generated using MESH and Emtree terms relating to “premature birth”, “menarche”, “puberty” and “follow up studies,” with input from a medical librarian. A complete list of search terms, formatted for each database, is available within the study protocol in Additional file 1: Appendix S1. The review is registered on PROSPERO, [26] CRD42015024806.
Databases were searched from 1946 onwards. Only papers with abstracts published in the Latin alphabet were reviewed, and these were translated if necessary by one of the authors (TW). We conducted reference searches of the studies which met the inclusion criteria, and contacted experts in the field in to identify further relevant studies. Two reviewers (EJ and CW) independently assessed the papers identified in the screening search using the inclusion and exclusion criteria.
Inclusion/exclusion criteria
Studies were included if 1) the population consisted of pubertal and post-pubertal adolescents and adults, 2) they were cohort, cross sectional or case control studies, 3) they defined preterm delivery in participants and compared this to term delivery, and 4) they carried out a quantitative assessment (either by participants or study researchers) of commencement of puberty, in the form of changes on growth charts, clinical examination of Tanner stages, or age at onset of menarche (first menstrual period) .
Studies were excluded if 1) they were case reports or opinion pieces, 2) they reported on birthweight but not gestation for the patient population, or 3) they were qualitative studies that did not provide quantitative data on the age of onset of puberty.
Data extraction, assessment of study quality and risk of bias
The following data were extracted from the studies meeting the inclusion criteria: authors, study publication date, country where the study was conducted, sex of participants, study design, study setting, definition of prematurity, number of study subjects (term and preterm), mean/median age of onset of puberty (from growth charts), Tanner stages, menarche, or age at voice breaking, and whether a statistical summary measure was calculated for the results. Data were entered onto Microsoft Excel (Microsoft Corporation, Redmond, WA, USA).
In order to assess the risk of bias within each individual study, we applied principles from the Critical Appraisal Study Process (CASP), [27] examining whether an appropriate study design had been chosen, whether the exposure and outcome were accurately measured, whether potential confounding factors were identified, and if so whether they had been adjusted for, and whether a statistical summary measure was given with the results. In order to assess the risk of publication bias, we noted whether or not each study had been published in a peer reviewed journal, and we contacted experts in the field to ascertain if there were relevant large datasets that remained unpublished.
Results
Searches
Our database search yielded 1370 records, and consultation with experts in the field identified 1 further study. Reference searches of 11 studies that met the inclusion criteria yielded 4 additional records, and after excluding duplicates a total of 1051 studies were screened. 47 of these studies were selected for full text review, of which 16 studies met the inclusion criteria. Figure 1 shows the PRISMA flowchart for the search. Four studies were from the United States; [28–31] 2 studies from Canada, [32, 33] Australia [34, 35], Finland [36, 37] and India; [19, 38] and 1 study from Hong Kong, [39] France, [40] Sweden, [41] and Turkey [42]. Participants in the studies were born between 1929 and 2003.
Fig. 1.
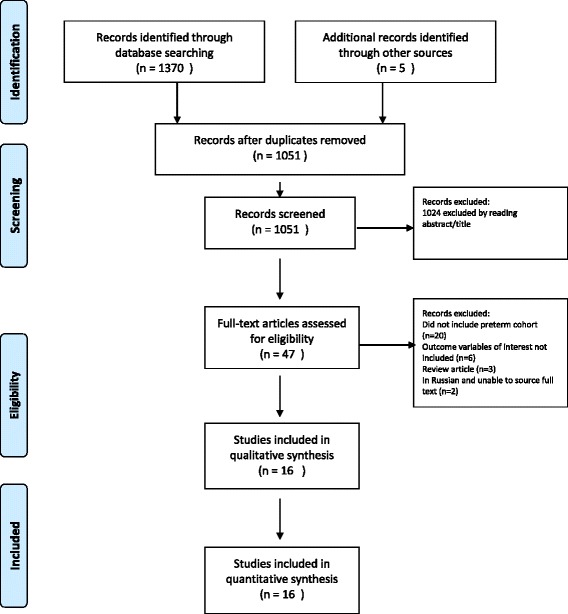
PRISMA Flow Chart
Assessment of risk of bias at study and outcome level
The assessment of risk of bias is shown in Table 1. All the studies asked a clearly focused study question. Twelve of the included studies were cohort studies [19, 28, 30, 32–40] (of which 2 were nested cohorts), [32, 34] 3 were cross sectional, [29, 31, 42] and 1 was a case control; [41] in all cases the study design was appropriate, although there was variation in the identification of potential confounding factors and adjustment for these. There was variability in how the exposure (gestational age at delivery) was assessed, with 5 studies not documenting how this was calculated, [19, 35, 36, 38, 41] 4 studies relying on an assessment of gestational age from the participants or their parents, [28, 32, 40, 42] and 7 using a combination of the date of last menstrual period with ultrasound measurements if available. [29–31, 33, 34, 37, 39] There was also variability in how the outcome (age at onset of puberty or menarche) was assessed, with 5 studies using self-reporting from participants or their parents, [28, 32, 35, 40, 42] 10 studies using data from outpatients clinics, [19, 29, 31, 33–39, 41] and 1 study not documenting this process [30]. Fourteen out of the 16 studies [19, 28–31, 33–40, 42] documented possible confounding factors, although only 8 of these corrected for them in subsequent analyses [19, 28, 29, 31, 33, 36, 38, 39]. Seven studies [19, 31, 32, 34, 35, 38, 42] did not provide a statistical summary measure for the comparison between term and preterm infants, thus limiting our ability to interpret and compare results.
Table 1.
Assessment of risk of bias
| Authors | Peer reviewed? | Clearly focused study question? | Study design | Cohort recruitment acceptable? (Cohort, cross sectional studies) | Case control appropriate study method? (Case control studies) | Exposure (gestational age at birth) accurately measured? | Outcome (age at menarche/onset puberty) accurately measured? | Confounding factors identified? | Confounding factors accounted for? | Statistical summary measure given? |
|---|---|---|---|---|---|---|---|---|---|---|
| Atay et al. | Yes | Yes | Cross-sectional | Yes | N/A | Reported by parents | Self reported by participants or parents | Yes | No | No |
| Bhargava et al | Yes | Yes | Cohort | Yes | N/A | Not documented | Data from outpatient clinics | Yes | Yes | No |
| Chaudhari et al | Yes | Yes | Cohort | Yes | N/A | Not documented | Data from outpatient clinics | Yes. | Yes | No |
| D’Aloisio et al. | Yes | Yes | Cohort | Yes. | N/A | Self reported by participants or parents | Self reported by participants | Yes | Yes | Yes |
| Dossus et al | Yes | Yes | Cohort | Yes | N/A | Self reported by participants | Self reported by participants | Yes | No | Yes |
| Epplein et al | Yes | Yes | Cross-sectional | Yes | N/A | Calculated from date of LMP | Data from outpatient clinics | Yes | Yes | Yes |
| Ford et al | Yes | Yes | Nested cohort | Yes | N/A | Calculated from date of LMP and ultrasound measurements | Data from outpatient clinics | Yes | No | No |
| Hack et al. | Yes | Yes | Cohort | Control group recruited at 8 years of age | N/A | Calculated from date of LMP | Not documented | Yes | No | Yes |
| Hui et al. | Yes | Yes | Cohort | Yes | N/A | Calculated from date of LMP | Data from outpatient clinics | Yes | Yes | Yes |
| Kitchen et al | Yes | Yes | Cohort | No control group | N/A | Not documented | Data from outpatient clinics | Yes | No | No |
| Moisan et al. | Yes | Yes | Nested cohort | Yes | N/A | Reported by parents | Reported by parents | No | No | No |
| Peralta-Calcelen et al | Yes | Yes | Cross-sectional | Control group recruited in adolescence | N/A | Calculated from date of LMP and ultrasound measurements | Data from outpatient clinics | Yes | Yes | No |
| Persson et al. | Yes | Yes | Case control | N/A | Yes | Not documented | Data from outpatient clinics | No | No | Yes |
| Saigal et al | Yes | Yes | Cohort | Control group recruited at 8 years of age | N/A | Calculated from date of LMP and ultrasound measurements | Data from outpatient clinics | Yes | Yes | Yes |
| Sipola-Leppänen et al | Yes | Yes | Cohort | Yes | N/A | Calculated from date of LMP and ultrasound measurements | Data from outpatient clinics | Yes | Yes | Yes |
| Wehkalampi et al | Yes | Yes | Cohort | Yes | N/A | Not documented | Data from outpatient clinics | Yes | Yes | Yes |
Assessment of risk of bias at review level
All studies were published in peer reviewed journals. Regarding the possibility of publication bias, as most studies reported outcomes in addition to the onset of puberty, it is unlikely that there was a systematic bias against studies reporting either earlier or later onset of puberty after preterm delivery. Consultation with global experts in the field revealed only 1 study which had not been identified by our review, providing reassurance that we had successfully retrieved the majority of the available published evidence. However, consultation with these experts did reveal 4 datasets which contained information relevant to the aims of this review but had not been analyzed for our outcome of interest [43–46].
Preterm birth and timing of puberty
The findings of the included studies are presented in Table 2. Studies varied in size, including between 12 [29] and 2748 [40] participants born preterm. Nine studies looked at cohorts of hospital born infants, [19, 30, 31, 33–38] and 7 recruited participants from childhood onwards. [28, 29, 32, 39–42] The timing of menarche was reported in all but one study, but there was otherwise wide variation in the summary measure used to describe the timing of puberty, making meaningful comparison of other measures challenging. The summary measure for the timing of menarche varied between studies, with 3 reporting median age, [19, 40, 42] 7 reporting mean age, [31, 33, 35, 36, 38, 39, 41] and the remaining 5 giving an alternative summary measure or not documenting one [28–30, 32, 34]. Of the 7 studies providing a mean, only 3 provided a standard deviation for both preterm and term groups.
Table 2.
Full results from included studies
| Country, Participant DOB (REF) | Study design | Participant selection | Gestation used to define prematurity (weeks) | Number of subjects | Form of summary measure | Age at menarche (years) | Age of onset of puberty for females (years) | Age of attainment of TS 2 for males (years) | ||||
|---|---|---|---|---|---|---|---|---|---|---|---|---|
| Preterm | Term | Preterm | Term | Preterm | Term | Preterm | Term | |||||
| Turkey, 1993–2003 (Atay et al) |
Cross-sectional | Randomly selected healthy school girls. | Not specified | 166 | 4702 | Median | “Gestational age had no effect on the odds of being menarcheal” | 12.74 | “Gestational age had no effect on the odds of on attaining any of the pubertal stages” | TS 2–5 9.65, 10.10, 11.75, and 14.17 years, respectively | ||
| India, 1968–1971 (Bhargava et al) | Cohort | Children born in urban hospital | 37 | 79 | 176 | Median | 13.1 | 13.6 | “Almost half the LBW were in TS 2 at 9.5 years” | 28% at TS 2 at age 9.5 | 10.2 | 10.02 |
| India, 1987–1989 (Chaudari et al) | Cohort | Infants discharged from Neonatal Unit | Not specified | 147 (73 SGA, 74 AGA) | 123 (33 SGA, 90 AGA) | Mean | 12.5 | 12.7 (SGA) 12.8 (AGA) |
SGA: 59% AGA: 73% |
SGA: 61% AGA:64% |
||
| US and Puerto Rico, 1929–1975 (D’Aloisio et al..) | Cohort | Women from the Sister Study with FH of Breast Cancer. | <36 | 767 | 17,365 | Other | No significant difference in RR of menarche at different ages compared to controls | |||||
| France, 1925–1951 (Dossus et al.) | Cohort | Women recruited into E3N study | Not specified | 2748 | 73,972 | Median | 0.07 years earlier | 13 | ||||
| Hawaii, 1986–1995 (Epplein et al..) | Cross-sectional | Healthy females in adolescent maturation study. | <36 | 12 | 336 | Other | Hazard ratio 1.61 (p value 0.16) with 36–41 weeks as reference. | |||||
| Australia, 1977–1982 (Ford et al.) | Nested cohort | VLBW (Mean gestation for BW < 1000 g =27 w; 1000–1499 g = 30w) and NBW controls | 37 | 165 | 41 | Other | At 14 yrs. of age: BW <1000 g: 15% BW: 1000–1500 g: 0% |
6% | TS >3 at 14: BW <1000 g: 74% BW 1000–1500 g: 69% |
75% | TS 3: BW < 1000 g: 88% BW 1000–1500 g:88%. |
88% |
| USA, 1977–1979 (Hack et al) | Cohort | VLBW infants (mean 30 w) and controls | 37 | 195 | 208 | Other | 12.4 | 12.3 | ||||
| Hong Kong, 1997 (Hui et al) | Cohort | “Children of 1997” Birth Cohort | 36 | 382 | 6984 | Mean | 9.88 | 9.68 | 11.71 | 11.67 | ||
| Australia, 1966–1970 (Kitchen et al) | Cohort | Hospital born infants BW 500 g–1500 g | No controls | 152 | No controls | Mean | 12.04 | 12.98 (standard Australian population) | ||||
| Canada, 1975–1976 (Moisan et al) | Nested cohort | Fifth grade females from public schools | Not specified | 3022 overall | 3022 overall | No data | “Prematurity had no association with early menarche” | |||||
| US, 1978–1984 (Peralta-Carcelen et al) | Cross-sectional | Adolescents born ELBW (mean 30 w) and term controls | 37 | 53 | 53 | Mean | 11.15 | 11.45 | TS 4/5: 88% | TS 4/5: 97% | “Testicular size not significantly different between groups”. |
|
| Sweden, 1973–1977 (Persson et al) | Case control | Singleton births | 37 | 139 | 688 | Mean | 13.2 | 13.1 | Onset of pubertal growth spurt: 11.3 | 11.1 | Onset of pubertal growth spurt: 12.0 | 12.1 |
| Canada, 1977–1982 (Saigal et al) | Cohort | Infants born ELBW (and term controls | 37 | 82 | 69 | Mean | 12.0 | 12.2 | ||||
| Finland, 1986 (Sipola-Leppänen et al) | Cohort | Infants born early (GA <34 w) and late preterm (GA 34–36 w) and term controls | 37 | early preterm = 79 late preterm = 238 |
6325 | Other | At age 16 54.3% early preterm had reached TS 4/5, 58.9% late preterm | At age 16 69.5% had reached TS 4/5 | At age 16 65% early preterm had reached TS 4/5, 71.5% late preterm |
At age 16 75.3% had reached TS 4/5 | ||
| Finland, 1978–1985 (Wehkalampi et al) | Cohort | Infants born VLBW (SGA mean 32 w; AGA mean 28 w) and term controls | 37 | SGA = 35 AGA = 78 |
146 | Mean | SGA:12.6 AGA:12.2 |
12.5 | Voice break SGA:13.5 AGA:13.3 |
13.8 | ||
Abbreviations: DOB Date of Birth, RR Relative Risk, w weeks, SGA Small for Gestational Age, AGA Appropriate for Gestational Age, BW Birth Weight, LBW Low Birth Weight, VLBW Very Low Birth Weight, ELBW Extremely Low Birth Weight, NBW Normal Birth Weight, TS Tanner Stage
Only four out of 15 studies (Additional file 2: Table S1) presented data on age of menarche in participants at an age where the majority of them would be expected to have attained it (> 15 years). As menarche can be classified as a binary variable (ie attained or not), if studies assessed participants at the same age, we believe a comparison between the proportion of participants who had attained menarche in the preterm and term groups can be reasonably be interpreted as indicating a relative acceleration or deceleration in pubertal timing in the preterm (compared to term) group. In the more complicated situation where studies assessed median or mean age at menarche amongst the sub-group of females who had attained it by a particular age (e.g. 12 or 14 years), it is plausible that this summary measure could be skewed by an unequal distribution of this event in the two sub-groups, and in addition to the problem of missing information, could complicate a comparison between the results from different studies. This heterogeneity in the outcome measure, and the point at which it was measured, rule out a formal meta-analysis.
With regards the timing of menarche in females, 5 studies found that menarche occurred earlier in preterm girls, [19, 31, 35, 36, 38, 40] 8 found that there was no difference between the preterm and term groups, [28–30, 32–34, 41, 42], and 1 showed that menarche was later in those born preterm (+ 0.2 years), [39]. One study showed earlier menarche (−0.3 years) in the appropriate for gestational age (AGA) group, and later menarche in the small for gestational age (SGA) group, (+0.1 years) [39]. This data is summarized in Table 3. The five studies that showed earlier menarche in the preterm compared to term group found it to be a median of 0.3 years earlier (range- 0.94 to −0.07 years). The study with the largest effect [35] however did not have an internal control group and instead used a national average.
Table 3.
Summary of results
| Authors and year of study | Country | Sex of participants | Timing of menarche in females (years) | Onset of puberty in males (years) | Statistical summary measure (type) |
|---|---|---|---|---|---|
| Atay et al. | Turkey | Females only | No difference | No | |
| Bhargava et al | India | Females and males | Earlier in preterm (0.5) | Later in preterm (0.18) | No |
| Chaudari et al | India | Females and males | Earlier in preterm (0.3) | Earlier in preterm (9.7% more attained) | No |
| D’Aloisio et al. | US | Females only | No difference | Yes (RR with 95% CI) | |
| Dossus et al. | France | Females only | Earlier in preterm (0.07) | Yes (Beta value with 95% CI) | |
| Epplein et al | US | Females only | No difference | Yes (HR with 95% CI) | |
| Ford et al. | Australia | Females and males | No difference | No difference | No |
| Hack et al | US | Females only | No difference | Yes (T test) | |
| Hui et al. | Hong Kong | Females and males | Onset of puberty later in preterm (0.2) | No difference | Yes (TR with 95% CI) |
| Kitchen et al | Australia | Females only | Earlier in preterm (0.94) | No | |
| Moisan et al | Canada | Females only | No difference | No | |
| Peralta-Carcelen | US | Females and males | Earlier in preterm (0.3) | No difference | No |
| Persson et al. | Sweden | Females and males | No difference | No difference | Yes (T test) |
| Saigal et al | Canada | Females only | No difference | Yes (mean with sd) | |
| Sipola-Lapponen et al | Finland | Females and males | “Girls born preterm were at an earlier pubertal stage than controls” | No difference | Yes (χ2 test) |
| Wehkalampi et al. | Finland | Females and males | Earlier in AGA preterm (0.3) Later in SGA preterm (0.1) |
Voice break earlier in AGA (0.5) and in SGA (0.3) preterm | Yes (T test) |
Abbreviations: RR Relative risk, HR Hazard Ratio, TR Time Ratio, CI Confidence Interval, sd standard deviation
Seven studies examined the onset of puberty in girls, 6 using Tanner breast stages. Of these, 1 study found an earlier onset of puberty in preterm infants, [19].2 showed no difference, [34, 42] and 3 studies showed later onset of puberty [31, 37, 39]. One study used the timing of the onset of the pubertal growth spurt and found a later onset of puberty in the preterm group [41]. Eight studies examined the onset of puberty in boys, using different markers. Six studies used Tanner stages, [19, 31, 34, 37–39] 1 used the onset of the pubertal growth spurt, [41] and a further study used age at voice break [36]. Of these, 2 studies showed an earlier onset of puberty in boys born preterm, [36] 5 showed no difference, [31, 34, 37–39, 41] and 1 showed a later onset of puberty in those born preterm [19].
Discussion
The published data available shows no clear association between being born premature and substantially earlier pubertal onset. There may be a subtle trend towards preterm females entering puberty earlier. Five out of the 16 studies showed earlier menarche after preterm birth, with a range of effect of between −0.07 to - 0.94 years. However, over half of the studies demonstrated no effect of gestational age on menarcheal timing. Other measures of female pubertal onset such as Tanner Stages showed no clear pattern. An inconsistent pattern was also seen in males, although it is hard to draw conclusions from the data as three different outcome measures were used to assess pubertal status.
Factors affecting the risk of bias
Size of studies
There was wide variability in the size of studies. As we could not perform a meta-analysis, there is a risk that our findings could be skewed by unrepresentative smaller studies. However, the largest study identified [40] included 2748 participants born preterm and 73,972 term-born controls. This study showed a small, but statistically significant, difference between the two groups, with those born preterm achieving menarche a median of 0.07 years earlier, which is in keeping with the findings of the review as a whole. The next largest study [28] included 767 participants born preterm and 17,365 controls, and did not find any difference in the timing of menarche. The remainder of the studies included between 12 and 382 participants born preterm. Due to the heterogeneity of the data we could not perform a funnel plot, but tabulating the data shows there is no clear correlation between the size of the study and the direction or magnitude of the effect found (Table 4).
Table 4.
Size of study and results
| Authors and year of study | Number of preterm participants | Number of term participants | Timing of menarche (years) |
|---|---|---|---|
| Dossus et al. | 2748 | 73,972 | Earlier in preterm (0.07) |
| D’Aloisio et al. | 767 | 17,365 | No difference |
| Hui et al. | 382 | 6984 | Onset of puberty later in preterm (0.2) |
| Sipola-Leppänen et al. | 317 | 6325 | Onset of puberty later in preterm |
| Hack et al | 195 | 208 | No difference |
| Atay et al. | 166 | 4702 | No difference |
| Ford et al. | 165 | 41 | No difference |
| Kitchen et al | 152 | No controls | Earlier in preterm (0.94) |
| Chaudari et al | 147 | 123 | Earlier in preterm (0.3) |
| Persson et al. | 139 | 688 | No difference |
| Wehkalampi et al. | 123 | 146 | Earlier in AGA preterm (0.3) Later in SGA preterm (0.1) |
| Saigal et al | 82 | 69 | No difference |
| Bhargava et al | 79 | 176 | Earlier in preterm (0.5) |
| Peralta-Carcelen | 53 | 53 | Earlier in preterm (0.3) |
| Epplein et al | 12 | 336 | No difference |
| Moisan et al | Not specified | 3022 overall | No difference |
Abbreviations: RR Relative risk, HR Hazard Ratio, TR Time Ratio, CI Confidence Interval, sd standard deviation
Confounding factors
Both the risk of being born preterm and the risk of entering puberty at an earlier age may share a number of parental confounding factors. A number of studies adjusted for these, in particular parental socioeconomic status (5 studies), [19, 33, 38, 39, 41] education (5 studies), [19, 29, 36–38] and height (3 studies); [19, 36, 38] and maternal age (3 studies) [28, 39, 41]. It is possible that adjusting for these variables might attenuate any relationship found between preterm birth and risk of earlier menarche, and thus our data could be skewed by the studies which did not carry out any adjustment. However, examining the studies that adjusted for confounding factors showed that 38% of these (3/8) identified earlier puberty in those born preterm, compared to 29% (2/7) of those that did not, indicating that if confounding bias exists for these factors, there is no clear association in their relationship to preterm birth and earlier menarche.
Correcting for gestational age
Another potential source of bias is whether studies accounted for degree of prematurity, by correcting for gestational age at birth (number of weeks of prematurity subtracted from the chronological age). Only two studies performed this adjustment [36, 39]. One of these [36] found that those born preterm and at a birthweight appropriate for gestation entered puberty and attained menarche earlier, but that correcting for gestational age attenuated this effect. Conversely, the other study, [39] which showed that preterm birth was associated with later onset of puberty and menarche, found that correcting for gestational age removed this association. Together these studies show that correction for gestational age is unlikely to bias results significantly, as it had no clear effect in either direction.
Degree of prematurity and onset of puberty
Another factor that might affect the results was whether studies included those born extremely preterm, as they might be expected to go into puberty earlier if there is indeed a relationship between the intensity of adverse early life conditions and risk of earlier puberty. Four studies did not specify the gestational age at which they defined prematurity; [32, 38, 40, 42] in the remaining 12 studies, the gestational age of the participants ranged from 24 to 37 weeks. As a proxy for extreme prematurity, there were 6 studies which included participants with a very low birth weight (VLBW, <1500 g) [30, 34–36] or extremely low birth weight (ELBW, < 1000 g) [31, 33]. Of these, 2 studies (33%) showed that girls had earlier menarche, [31, 35, 36] a lower percentage than the 5/9 studies (56%) that did not include participants born with a VLBW/ELBW, thus suggesting no clear association between extreme prematurity and age at onset of puberty. It is likely that other causes of low birthweight also influence pubertal timing, rather than length of gestation alone. The fact that the study that categorized participants into AGA or SGA found differences in the timing of menarche [39] suggests that this might be a significant factor.
In addition to the factors discussed above, it is likely that other variables that we could not control for in our analysis, such as childhood growth, [47] probably have an equally, or perhaps more important role on pubertal timing [48]. Diet and body composition, which are inextricably linked to socioeconomic status, also play a significant role in the timing of an individual’s pubertal development. Several studies of both preterm and term-born cohorts have shown that obesity has a clear influence on pubertal timing, [36, 49] and according to the Developmental Origins of Health and Disease (DoHAD) hypothesis, both intrauterine and early life environments are important for later health outcomes [50]. There is insufficient information in the studies reviewed to examine the role of catch up growth and childhood weight gain on pubertal timing. Other important factors that cannot be overlooked include genetic and psychosocial factors, including exposure to stress and trauma (which have been linked to both earlier [51, 52] and later menarche), [53, 54] and the role of exposure to endocrine disruptors on later pubertal timing [55].
Limitations
There was marked heterogeneity in assessment of both the exposure and the outcome, and many studies did not calculate a statistical summary measure, limiting our ability to compare the studies, and meaning we could not perform a funnel plot. Similarly, as most studies did not present outcomes in the form of a mean with a standard deviation, we were unable to perform a meta-analysis. There was insufficient data within the articles to enable us to address all potential confounding factors. If this research question is to be investigated in further detail it would be beneficial to utilize the additional data contained within the large population- based datasets highlighted to us by experts in the field. These datasets are from the ALSPAC cohort in the United Kingdom [45], 2 cohorts of patients who formed part of trials in Australasia looking at the long term effects of antenatal corticosteroids, [43, 44], and a large birth cohort from Finland [46]. In order to perform a meta-analysis including this unpublished data, sourcing and standardization of the existing datasets would also be required to enable additional statistical analysis.
Another important factor in attempting to identify whether there is a stereotyped phenotypic response to a particular exposure is the homogeneity of the relevant population. In our case, although many preterm deliveries occur after the spontaneous onset of preterm labor, a substantial proportion are precipitated by infection, or are medically expedited for maternal or fetal indications [5]. Thus, it may be that classing all those born preterm into a single group and attempting to identify a response to the exposure of an early delivery is an over-simplification of what is likely to be a combination of complex biological mechanisms.
Conclusion
The published evidence does not suggest that being born preterm in itself leads to a significant acceleration in the onset of puberty. This lack of evidence for a substantial effect should prove reassuring for public health purposes, and clinicians counseling parents of infants born preterm. To strengthen the evidence base to answer the question whether preterm birth is associated with the timing of puberty, further studies re-analyzing existing study data and including unpublished data from existing datasets will be required.
Additional files
Appendix S1. Review protocol. (DOCX 45 kb)
Table S1. Age at participant review for included studies. (DOCX 12 kb)
Acknowledgements
The authors would like to thank Marshall Dozier, Academic Liaison Librarian at the University of Edinburgh, for her input into our search strategy.
We would also like to thank Dr. Tim Cheetham, Dr. Martin Ward-Platt, Prof. Jean Golding, Prof. Gorm Greisen, Dr. Rasmus a Rogvi, Prof. Abdullah Bereket and Prof Deborah Sloboda for their expert advice on data (published and unpublished) that might meet the inclusion criteria for this review.
Funding
TW- Wellcome Trust 204802/Z/16/Z, CW- Medical Research Council and Muscular Dystrophy UK MR/N020588/1.
Availability of data and materials
All data is available within this article, appendices or via the references.
Abbreviations
- AGA
Appropriate for gestational age
- CASP
Critical appraisal study process
- DoHAD
Developmental origins of Health and Disease
- ELBW
Extremely low birth weight
- SGA
Small for gestational age
- VLBW
Very low birth weight
Authors’ contributions
EJ, TW and CW conceptualized and designed the study, carried out the initial analyses, drafted the initial manuscript, and approved the final manuscript as submitted. HN contributed towards the analysis, drafted the initial manuscript, and approved the final manuscript as submitted. All authors approved the final manuscript as submitted and agree to be accountable for all aspects of the work. No honorarium, grant, or other form of payment was given to anyone to produce the manuscript.
Ethics approval and consent to participate
Not applicable
Consent for publication
Not applicable
Competing interests
The authors indicate that they have no financial relationships relevant to this article to disclose. The authors indicate that they have no potential conflicts of interest to disclose.
Publisher’s Note
Springer Nature remains neutral with regard to jurisdictional claims in published maps and institutional affiliations.
Footnotes
Electronic supplementary material
The online version of this article (10.1186/s12887-017-0976-8) contains supplementary material, which is available to authorized users.
Contributor Information
Evlyn James, Email: ejames2@doctors.org.uk.
Claire L. Wood, Email: claire.wood@ncl.ac.uk
Harish Nair, Email: harish.nair@ed.ac.uk.
Thomas C. Williams, Phone: +44 (0) 131 651 8500, Email: thomaschristiewilliams@gmail.com
References
- 1.Blencowe H, Cousens S, Oestergaard MZ, et al. National, regional, and worldwide estimates of preterm birth rates in the year 2010 with time trends since 1990 for selected countries: a systematic analysis and implications. Lancet. 2012 [cited 2014 Jul 11];379:2162–72. Available from: http://www.ncbi.nlm.nih.gov/pubmed/22682464. [DOI] [PubMed]
- 2.Saigal S, Doyle LW. An overview of mortality and sequelae of preterm birth from infancy to adulthood. Lancet (London, England). 2008 [cited 2015 Aug 29];371:261–9. Available from: http://www.ncbi.nlm.nih.gov/pubmed/18207020. [DOI] [PubMed]
- 3.Bayman E, Drake AJ, Piyasena C. Prematurity and programming of cardiovascular disease risk: a future challenge for public health? Arch Dis Child Fetal Neonatal Ed. 2014 [cited 2015 Jan 25];99:F510–4. Available from: http://www.ncbi.nlm.nih.gov/pubmed/25135955. [DOI] [PubMed]
- 4.Mathur A. Understanding moderate prematurity. Arch Dis Child Fetal Neonatal Ed. 2015 [cited 2015 Nov 27];100:F474–5. Available from: http://www.ncbi.nlm.nih.gov/pubmed/26187934. [DOI] [PubMed]
- 5.Goldenberg RL, Culhane JF, Iams JD, Romero R. Epidemiology and causes of preterm birth. Lancet. 2008 [cited 2014 Dec 3];371:75–84. Available from: http://www.ncbi.nlm.nih.gov/pubmed/18177778. [DOI] [PMC free article] [PubMed]
- 6.Collins JW, Rankin KM, David RJ. Downward economic mobility and preterm birth: an exploratory study of Chicago-born upper class white mothers. Matern Child Health J. 2015 [cited 2015 Mar 21];Available from: http://www.ncbi.nlm.nih.gov/pubmed/25656715. [DOI] [PubMed]
- 7.Collins JW, Rankin KM, David RJ. African American women’s lifetime upward economic mobility and preterm birth: the effect of fetal programming. Am J Public Health. 2011 [cited 2015 Sep 9];101:714–9. Available from: http://www.pubmedcentral.nih.gov/articlerender.fcgi?artid=3052339&tool=pmcentrez&rendertype=abstract [DOI] [PMC free article] [PubMed]
- 8.Alvergne A, Faurie C, Raymond M. Developmental plasticity of human reproductive development: effects of early family environment in modern-day France. Physiol Behav. 2008 [cited 2015 Dec 7];95:625–32. Available from: http://www.ncbi.nlm.nih.gov/pubmed/18822309. [DOI] [PubMed]
- 9.Chisholm JS, Quinlivan JA, Petersen RW, Coall DA. Early stress predicts age at menarche and first birth, adult attachment, and expected lifespan. Hum Nat. 2005 [cited 2015 Nov 16];16:233–65. Available from: http://www.ncbi.nlm.nih.gov/pubmed/26189749. [DOI] [PubMed]
- 10.Charalampopoulos D, McLoughlin A, Elks CE, Ong KK. Age at menarche and risks of all-cause and cardiovascular death: a systematic review and meta-analysis. Am J Epidemiol. 2014 [cited 2015 Nov 19];180:29–40. Available from: http://aje.oxfordjournals.org/content/180/1/29 [DOI] [PMC free article] [PubMed]
- 11.Remsberg KE, Demerath EW, Schubert CM, Chumlea WC, Sun SS, Siervogel RM. Early menarche and the development of cardiovascular disease risk factors in adolescent girls: the Fels Longitudinal Study. J Clin Endocrinol Metab. 2005 [cited 2016 Apr 22];90:2718–24. Available from: http://www.ncbi.nlm.nih.gov/pubmed/15728207. [DOI] [PubMed]
- 12.Lakshman R, Forouhi N, Luben R, et al. Association between age at menarche and risk of diabetes in adults: results from the EPIC-Norfolk cohort study. Diabetologia. 2008 [cited 2015 Dec 7];51:781–6. Available from: http://www.ncbi.nlm.nih.gov/pubmed/18320165. [DOI] [PubMed]
- 13.Mueller NT, Duncan BB, Barreto SM, et al. Earlier age at menarche is associated with higher diabetes risk and cardiometabolic disease risk factors in Brazilian adults: Brazilian Longitudinal Study of Adult Health (ELSA-Brasil). Cardiovasc Diabetol. 2014 [cited 2016 Apr 22];13:22. Available from: http://www.pubmedcentral.nih.gov/articlerender.fcgi?artid=3899384&tool=pmcentrez&rendertype=abstract [DOI] [PMC free article] [PubMed]
- 14.Golub MS, Collman GW, Foster PMD, et al. Public health implications of altered puberty timing. Pediatrics. 2008 [cited 2016 Mar 9];121 Suppl:S218–30. Available from: http://www.ncbi.nlm.nih.gov/pubmed/18245514. [DOI] [PubMed]
- 15.Day FR, Thompson DJ, Helgason H, et al. Genomic analyses identify hundreds of variants associated with age at menarche and support a role for puberty timing in cancer risk. Nat Genet. 2017 [cited 2017 May 17];Available from: http://www.ncbi.nlm.nih.gov/pubmed/28436984. [DOI] [PMC free article] [PubMed]
- 16.Trépanier L, Juster R-P, Marin M-F, et al. Early menarche predicts increased depressive symptoms and cortisol levels in Quebec girls ages 11 to 13. Dev Psychopathol [Internet] 2013 [cited 2015 Dec 7];25:1017–27. Available from: http://www.ncbi.nlm.nih.gov/pubmed/24229546. [DOI] [PubMed]
- 17.Mendle J, Turkheimer E, Emery RE. Detrimental psychological outcomes associated with early pubertal timing in adolescent girls. Dev Rev. 2007 [cited 2015 Nov 27];27:151–71. Available from: http://www.pubmedcentral.nih.gov/articlerender.fcgi?artid=2927128&tool=pmcentrez&rendertype=abstract [DOI] [PMC free article] [PubMed]
- 18.Hanson MA, Gluckman PD. Early developmental conditioning of later health and disease: physiology or pathophysiology ? Physiol Rev. 2014 [cited 2014 Nov 26];94:1027–76. Available from: http://www.ncbi.nlm.nih.gov/pubmed/25287859. [DOI] [PMC free article] [PubMed]
- 19.Bhargava SK, Ramji S, Srivastava U, et al. Growth and sexual maturation of low birth weight children: a 14 year follow up. Indian Pediatr. 1995;32:963–970. [PubMed] [Google Scholar]
- 20.US National Library of Medicine. PubMed. [Internet]. 2013;Available from: http://www.ncbi.nlm.nih.gov/pubmed
- 21.Embase [Internet]. Available from: http://www.embase.com
- 22.Global Health Archive [Internet]. [cited 2014 Nov 6];Available from: http://www.cabi.org/publishing-products/online-information-resources/global-health-archive/
- 23.Ovid SP [Internet]. Available from: https://ovidsp.ovid.com/
- 24.POPLINE.org [Internet]. [cited 2015 Dec 7];Available from: http://www.popline.org/
- 25.Global Health Library [Internet]. [cited 2014 Nov 6];Available from: http://www.globalhealthlibrary.net/php/index.php
- 26.PROSPERO: International Prospective Register of Systematic Reviews [Internet]. Available from: http://www.crd.york.ac.uk/PROSPERO/ [DOI] [PMC free article] [PubMed]
- 27.CASP Critical Appraisal Skills Programme Oxford UK [Internet]. [cited 2015 Dec 7];Available from: http://www.casp-uk.net/
- 28.D’Aloisio AA, DeRoo LA, Baird DD, Weinberg CR, Sandler DP. Prenatal and infant exposures and age at menarche. Epidemiology. 2013;24:277–284. doi: 10.1097/EDE.0b013e31828062b7. [DOI] [PMC free article] [PubMed] [Google Scholar]
- 29.Epplein M, Novotny R, Daida Y, Vijayadeva V, Onaka AT, Le Marchand L. Association of maternal and intrauterine characteristics with age at menarche in a multiethnic population in Hawaii. Cancer Causes Control. 2010;21:259–268. doi: 10.1007/s10552-009-9457-1. [DOI] [PMC free article] [PubMed] [Google Scholar]
- 30.Hack M, Schluchter M, Cartar L, Rahman M, Cuttler L, Borawski E. Growth of very low birth weight infants to age 20 years. Pediatrics. 2003 [cited 2015 sep 15];112:e30–8. Available from: http://www.ncbi.nlm.nih.gov/pubmed/12837903. [DOI] [PubMed]
- 31.Peralta-Carcelen M, Jackson DS, Goran MI, Royal SA, Mayo MS, Nelson KG. Growth of adolescents who were born at extremely low birth weight without major disability. J Pediatr. 2000 [cited 2016 Apr 22];136:633–40. Available from: http://www.ncbi.nlm.nih.gov/pubmed/10802496. [DOI] [PubMed]
- 32.Moisan J, Meyer F, Gingras S. A nested case-control study of the correlates of early menarche. Am J Epidemiol. 1990 [cited 2016 Apr 22];132:953–61. Available from: http://www.ncbi.nlm.nih.gov/pubmed/2239910. [DOI] [PubMed]
- 33.Saigal S, Stoskopf BL, Streiner DL, Burrows E. Physical growth and current health status of infants who were of extremely low birth weight and controls at adolescence. Pediatrics. 2001 [cited 2016 Apr 22];108:407–15. Available from: http://www.ncbi.nlm.nih.gov/pubmed/11483807. [DOI] [PubMed]
- 34.Ford G, Doyle L, Davis N, Callanan C. Very low birth weight and growth into adolescence. Arch Pediatr Adolesc Med. 2000;154:778–784. doi: 10.1001/archpedi.154.8.778. [DOI] [PubMed] [Google Scholar]
- 35.Kitchen WH, Ryan MM, Rickards AL. Longitudinal study of very low birthweight infants: impairments, health and distance growth to 14 years of age. Aust Paediatr J. 1987;23:335–338. doi: 10.1111/j.1440-1754.1987.tb00285.x. [DOI] [PubMed] [Google Scholar]
- 36.Wehkalampi K, Hovi P, Dunkel L, et al. Advanced pubertal growth spurt in subjects born preterm: the Helsinki study of very low birth weight adults. J Clin Endocrinol Metab. 2011 [cited 2015 May 15];96:525–33. Available from: http://www.ncbi.nlm.nih.gov/pubmed/21147886. [DOI] [PubMed]
- 37.Sipola-Leppanen M, Vaarasmaki M, Tikanmaki M, et al. Cardiovascular risk factors in adolescents born preterm. Pediatrics. 2014 [cited 2017 may 17];134:e1072–81. Available from: http://www.ncbi.nlm.nih.gov/pubmed/25180275. [DOI] [PubMed]
- 38.Chaudhari S, Otiv M, Hoge M, Pandit A, Mote A. Growth and sexual maturation of low birth weight infants at early adolescence. Indian Paediatr. 2008;45:191–198. [PubMed] [Google Scholar]
- 39.Hui LL, Leung GM, Lam TH, Schooling CM, LaiLing H, TaiHing L. Premature birth and age at onset of puberty. Epidemiology. 2012;23:415–422. doi: 10.1097/EDE.0b013e31824d5fd0. [DOI] [PubMed] [Google Scholar]
- 40.Dossus L, Kvaskoff M, Bijon A, et al. Determinants of age at menarche and time to menstrual cycle regularity in the French E3N cohort. Ann Epidemiology. 2012;22:723–730. doi: 10.1016/j.annepidem.2012.07.007. [DOI] [PubMed] [Google Scholar]
- 41.Persson I, Ahlsson F, Ewald U, et al. Influence of perinatal factors on the onset of puberty in boys and girls: implications for interpretation of link with risk of long term diseases. Am J Epidemiol. 1999 [cited 2015 Feb 11];150:747–55. Available from: http://www.ncbi.nlm.nih.gov/pubmed/10512428. [DOI] [PubMed]
- 42.Atay Z, Turan S, Guran T, Furman A, Bereket A. Puberty and influencing factors in schoolgirls living in Istanbul: end of the secular trend? Pediatrics. 2011;128:e40–e45. doi: 10.1542/peds.2010-2267. [DOI] [PubMed] [Google Scholar]
- 43.Dalziel SR, Parag V, Rodgers A, Harding JE. Cardiovascular risk factors at age 30 following pre-term birth. Int J Epidemiol. 2007 [cited 2015 Dec 7];36:907–15. Available from: http://www.ncbi.nlm.nih.gov/pubmed/17468503. [DOI] [PubMed]
- 44.McKinlay CJD, Cutfield WS, Battin MR, Dalziel SR, Crowther CA, Harding JE. Cardiovascular risk factors in children after repeat doses of antenatal glucocorticoids: an RCT. Pediatrics. 2015 [cited 2015 Dec 7];135:e405–15. Available from: http://www.ncbi.nlm.nih.gov/pubmed/25601978. [DOI] [PubMed]
- 45.Bristol University | Avon Longitudinal Study of Parents and Children | Avon Longitudinal Study of Parents and Children [Internet]. [cited 2015 Dec 7]; Available from: http://www.bristol.ac.uk/alspac/
- 46.Widén E, Silventoinen K, Sovio U, et al. Pubertal timing and growth influences cardiometabolic risk factors in adult males and females. Diabetes Care. 2012 [cited 2017 May 17];35:850–6. Available from: http://www.ncbi.nlm.nih.gov/pubmed/22338106. [DOI] [PMC free article] [PubMed]
- 47.dos Santos Silva I, De Stavola BL, Mann V, Kuh D, Hardy R, Wadsworth MEJ. Prenatal factors, childhood growth trajectories and age at menarche. Int J Epidemiol. 2002 [cited 2016 Feb 9];31:405–12. Available from: http://www.ncbi.nlm.nih.gov/pubmed/11980804. [DOI] [PubMed]
- 48.Euling SY, Selevan SG, Pescovitz OH, Skakkebaek NE. Role of environmental factors in the timing of puberty. Pediatrics [Internet] 2008 [cited 2016 Mar 10];121 Suppl:S167–71. Available from: http://www.ncbi.nlm.nih.gov/pubmed/18245510. [DOI] [PubMed]
- 49.Ong KK, Emmett P, Northstone K, et al. Infancy weight gain predicts childhood body fat and age at menarche in girls. J Clin Endocrinol Metab. 2009 [cited 2016 Mar 16];94:1527–32. Available from: http://www.ncbi.nlm.nih.gov/pubmed/19240149. [DOI] [PubMed]
- 50.Williams TC, Drake AJ. What a general paediatrician needs to know about early life programming. Arch Dis Child. 2015 [cited 2016 Feb 25];100:1058–63. Available from: http://adc.bmj.com/content/100/11/1058.abstract. [DOI] [PubMed]
- 51.Pesonen A-K, Räikkönen K, Heinonen K, Kajantie E, Forsén T, Eriksson JG. Reproductive traits following a parent-child separation trauma during childhood: a natural experiment during World War II. Am J Hum Biol. [cited 2016 Mar 10];20:345–51. Available from: http://www.ncbi.nlm.nih.gov/pubmed/18257076. [DOI] [PubMed]
- 52.Teilmann G, Pedersen CB, Skakkebaek NE, Jensen TK. Increased risk of precocious puberty in internationally adopted children in Denmark. Pediatrics. 2006;118:e391–e399. doi: 10.1542/peds.2005-2939. [DOI] [PubMed] [Google Scholar]
- 53.van Noord PA, Kaaks R. The effect of wartime conditions and the 1944–45 “Dutch famine” on recalled menarcheal age in participants of the DOM breast cancer screening project. Ann Hum Biol. [cited 2016 Mar 10];18:57–70. Available from: http://www.ncbi.nlm.nih.gov/pubmed/2009006. [DOI] [PubMed]
- 54.Tahirović HF. Menarchal age and the stress of war: an example from Bosnia. Eur J Pediatr. 1998 [cited 2016 mar 10];157:978–80. Available from: http://www.ncbi.nlm.nih.gov/pubmed/9877035. [DOI] [PubMed]
- 55.Colón I, Caro D, Bourdony CJ, Rosario O. Identification of phthalate esters in the serum of young Puerto Rican girls with premature breast development. Environ Health Perspect. 2000 [cited 2016 Mar 16];108:895–900. Available from: http://www.pubmedcentral.nih.gov/articlerender.fcgi?artid=2556932&tool=pmcentrez&rendertype=abstract [DOI] [PMC free article] [PubMed]
Associated Data
This section collects any data citations, data availability statements, or supplementary materials included in this article.
Supplementary Materials
Appendix S1. Review protocol. (DOCX 45 kb)
Table S1. Age at participant review for included studies. (DOCX 12 kb)
Data Availability Statement
All data is available within this article, appendices or via the references.