

Abstract
Background
Although marijuana is the most commonly used illicit drug in the United States, little is known about the effects of typical marijuana use patterns and whether there are distinct subgroups of marijuana users.
Methods
The present study used latent profile analysis to determine the number of distinct subgroups of marijuana users in a large sample of college students (n = 2,129 past month marijuana users across 11 universities). We also examined how these distinct groups differ on several putative risk/protective factors (e.g., personality traits, perceptions of marijuana, and motives for using marijuana).
Results
Using the Lo-Mendell-Rubin Likelihood Ratio Test, we identified four latent classes with the largest class consisting of infrequent marijuana users, and three other classes demonstrating increasingly frequent use and more negative consequences with the most severe class being the smallest class. We found the largest between-class differences (i.e., distinctions across classes) to be on identification with being a marijuana user and use of protective behavioral strategies (PBS), such that the heavier user classes showed higher identification with marijuana users and lower use of PBS.
Conclusions
Our findings demonstrate that college student marijuana users are a heterogeneous group with different profiles of risk/protective factors and that those who use cannabis a few times per month are different from those who are near-daily or daily users. Our findings also serve as a call to action for the field to consider examining identification with being a marijuana user and the use of PBS in future marijuana studies.
Keywords: Marijuana Use, Negative Marijuana Consequences, Protective Behavioral Strategies, Social Norms, Identity, Latent Profile Analysis, Person-Centered Analysis
1. Introduction
Increasing evidence suggests that heavy, chronic, and early onset marijuana use has a wide range of long-term negative consequences including cannabis use disorder (CUD), cognitive impairment, lower achievement, and poor educational outcomes (Volkow et al., 2014). With the trend towards decriminalization and legalization of marijuana use across the country (Pacula et al., 2015), the availability of marijuana, and perhaps use of marijuana is likely to increase. Given this landscape, it is important to identify risk factors associated with heavy and problematic (i.e., associated with negative consequences) marijuana use (Simons et al., 2012). Although data from large epidemiological studies (e.g., Monitoring the Future, Johnston et al., 2015; National Survey of Substance Use and Health, Center for Behavioral Health Statistics and Quality, 2015) demonstrate that chronic marijuana use is associated with various psychosocial and medical problems, many questions still remain. For example, much less is known about the effects of typical marijuana use patterns and whether there are distinct subgroups of marijuana users.
Although variable-centered analyses (e.g., multiple regression, structural equation modeling) predominate the marijuana literature, they are limited in that they tend to focus on the unique associations between marijuana use and associated outcomes as well as only comparing users to non-users. Further, variable-centered approaches assume that all participants have been sampled from a single population (i.e., population homogeneity assumption; Collins and Lanza, 2010). The limitations of variable-centered analyses can be overcome through the use of person-centered analyses. Person-centered analyses can identify subpopulations, or subgroups, of individuals who share particular attributes. For example, there has been a plethora of person-centered research identifying distinct subpopulations of users for various drugs including: tobacco (Sutfin et al., 2009), MDMA/ecstasy (Carlson et al., 2005), alcohol (Reboussin et al., 2006), and opioids (Monga et al., 2007).
There have been several studies utilizing person-centered analyses in the examination of marijuana users among adolescents (Eassey et al., 2015; Hix-Small et al., 2004; Windle and Wiesner, 2004) and emerging/young adults (Arria et al., 2016; Brook et al., 2011; Brown et al., 2004; Caldeira et al., 2012; Ellickson et al., 2004; Jackson et al., 2008; Juon et al., 2011; Schulenberg et al., 2005; Tait et al., 2011). Using group-based trajectory approaches, these studies typically identified 3 to 5 groups of marijuana users: abstainers, increasing users, daily users, and, in some cases, experimental and decreasing users. Further, researchers were able to identify several variables that were predictive of these distinct marijuana users, some acting as risk and some as protective factors. For example, Eassey and colleagues (2015) found that for each trajectory group, parental disapproval of substance use and associating with non-using peers demonstrated significant protective effects on the frequency of marijuana use. Less exposure to peer pressure was associated with lower frequency of marijuana use for the increasing and chronic trajectory groups, whereas school attachment had a protective effect for only those in the chronic use trajectory group. As most of these previous studies have come from large, longitudinal epidemiological studies, they have a strength in being from nationally representative samples that capture change over time (i.e., trajectories) of these marijuana users.
The studies mentioned above predominately used a single indicator of marijuana frequency as the key indicator for their distinct classes, while ignoring other key variables, such as experiences of marijuana-related negative consequences. From a public health perspective, experience of marijuana-related negative consequences is arguably the most important measure to include, yet none of these studies had a direct measure of marijuana-related negative consequences. By including experiences of marijuana-related negative consequences as an indicator, researchers may be able to further distinguish marijuana users beyond just frequency of use (e.g., a subclass of moderate marijuana users without problems). Such knowledge gains can help improve upon existing treatment of CUD (Davis et al., 2015) as well as policies surrounding the regulation of marijuana use (Room, 2014).
According to the National Survey of Substance Use and Health (NSDUH), the peak period of marijuana use occurs between the ages 18 and 25 years old (Center for Behavioral Health Statistics and Quality, 2015), which is also the age of most college students in the United States (Kena et al., 2015). Thus, college students are an important group to study with regards to examining if there is heterogeneity among marijuana users based on not only frequency of use but also experiences of marijuana-related problems.
1.1 Purpose of Study
The purpose of the present study was to identify subpopulations of marijuana users defined by both marijuana use frequency and experiences of marijuana-related negative consequences. Specifically, we used latent profile analysis to determine the number of distinct subgroups of marijuana users in a large sample of college student past month marijuana users collected from 11 different universities. Latent profile analysis is a person-centered statistical technique that assumes that the pattern of means on observed variables can be accounted for by the existence of distinct latent classes, or distinct classes of individuals in terms of their level of marijuana involvement. One of the strengths of latent profile analysis relative to other person-centered approaches (e.g., cluster analysis) is that latent class membership is considered to be probabilistic and the size of classes is taken in account when assigning probabilistic class membership. Although we had no a priori hypotheses regarding how many latent classes we would find, we expected that there would be at least one latent class of low frequency, marijuana users and one latent class of heavy, problematic users. To determine the most salient factors that distinguished lower vs. higher marijuana involvement classes, we examined how these distinct classes differed on a host of risk and protective factors that have been linked to marijuana use, such as personality traits (Cyders et al., 2007; Galbraith and Conner, 2015; Whiteside and Lynam, 2001; Woicik et al., 2009), perceptions of marijuana use (Napper et al., 2015; Swaim, 2003), motives for using marijuana use (Simons et al., 1998), use of protective behavioral strategies (Pedersen et al., 2016), and difficulties in emotion regulation (Gratz and Roemer, 2004).
2. Method
2.1. Participants and Procedure
College students (n = 8,141) were recruited from Psychology Department Participant Pools at 11 participating universities in 11 different states (Washington, California, Wyoming, Colorado, New Mexico, North Dakota, Kansas, Texas, New York, Virginia, Alabama) in the United States between Fall 2015 and Spring 2016. Participants read an informed consent prior to completing the main survey online (~45-60 minutes to complete), and were awarded research participation credit. This research was approved by the institutional review board at each participating university. Additional information about this sample is reported elsewhere (Pearson et al., 2016). For the present study and given our primary concern of identifying the heterogeneity among current marijuana users, our analyses were restricted to participants who reported using marijuana in the past month (n = 2,129). Among current marijuana users, the majority of participants identified as being either White, non-Hispanic (n = 1,285; 60.4%), or of Hispanic/Latino ethnicity (n = 390; 18.3%), were female (n = 1,260; 59.2%), and reported a mean age of 19.95 (SD=3.66) years.
2.2. Measures
2.2.1. Marijuana Involvement Indicators
To determine lifetime marijuana user status, we asked, “In your lifetime, have you ever used marijuana in any form?” If participants responded with “yes,” they were branched to two additional questions: 1) “Approximately how many days in your lifetime have you used marijuana?”, and 2) “On how many days during the last 30 days did you use marijuana?” If participants responded with 1 or greater to this second question, they were then asked the remainder of the marijuana-related questions.
Marijuana use frequency was determined using a more high-definition measure patterned from the Daily Drinking Questionnaire (DDQ; Collins et al., 1985). Specifically, each day of the week was broken down into 6 4-hour blocks of time (12a-4a, 4a-8a, 8a-12p, etc.), and participants were asked to report at which times they used marijuana during a “typical week” and their “heaviest use week” in the past 30 days. From this measure, we created two marijuana use frequency estimates by summing the total number of time blocks for which they reported using during the typical and heaviest use weeks (hypothetical ranges: 0-42). The initial measure has shown adequate reliability and validity in previous research (Dvorak and Day, 2014; Williams et al., 2000). The measure of “heaviest” week has not been used in prior research, but was modeled after measures of heavy weekly alcohol use.
Adapted from the Young Adult Alcohol Consequences Questionnaire (YAACQ; Read et al., 2006), the 50-item Marijuana Consequences Questionnaire (MACQ; Simons et al., 2012) assesses eight domains of marijuana negative consequences: social-interpersonal consequences (6 items), impaired control (6 items), negative self-perception (5 items), self-care (9 items), risk behaviors (8 items), academic/occupational consequences (5 items), physical dependence (4 items), and blackout use (7 items). Participants were asked whether they experienced each of these negative consequences due to their marijuana use in the past month. Participants responded to dichotomously coded responses (0=no, 1=yes). In the present study, we used a total score as an indicator of problematic marijuana use. The bivariate correlations and descriptive statistics of marijuana involvement indicators are shown in Table 1.
Table 1.
Bivariate correlations and descriptive statistics among indicators for marijuana involvement in full sample.
| 1 | 2 | 3 | 4 | M | SD | Range | |
|---|---|---|---|---|---|---|---|
| 1. Past 30-Day Marijuana Use | — | 9.57 | 9.93 | 0–30 | |||
| 2. Typical Marijuana Use | .75 | — | 5.76 | 6.92 | 0–42 | ||
| 3. Heavy Marijuana Use | .73 | .86 | — | 6.78 | 8.44 | 0–42 | |
| 4. Consequences | .35 | .35 | .35 | — | 8.10 | 7.83 | 0–50 |
Note. Significant correlations are bolded for emphasis and were determined by a 99% bias-corrected bootstrapped confidence interval (based on 10,000 bootstrapped samples) that does not contain zero.
2.2.2. Auxiliary variables
We assessed a wide range of auxiliary variables. All of these measures have strong psychometric properties and have been validated in college study/young adult populations. Additional psychometric information regarding these measures for the whole sample can be obtained elsewhere (Pearson et al., 2016).
We assessed several individual difference variables. Using the 59-item UPPS-P (Cyders et al., 2007; Whiteside and Lynam, 2001), we assessed five impulsivity-like traits: premeditation (i.e., tendency to think before acting), perseverance (i.e., tendency to follow through on tasks or plans), sensation seeking (i.e., tendency to seek out novel or exciting experiences), negative urgency (i.e., tendency to behave impulsively especially when experiencing negative affect), and positive urgency (i.e., tendency to behave impulsively when experiencing positive affect). Using the 23-item Substance Use Risk Profile Scale (SURPS; Woicik et al., 2009), we assessed four personality traits known to be associated with risk of substance use: hopelessness (i.e., depressed mood), impulsivity (i.e., tendency to react to internal/external influences without consideration of possible consequences to oneself or others), sensation seeking, and anxiety sensitivity (i.e., tendency to fear arousal-related bodily sensations such as rapid breathing, perspiration, and elevated heart). Using the 15-item Sensation Seeking Personality Trait Questionnaire (SSPTQ; Conner, 2015), we examined specific facets of sensation seeking: risk seeking and experience seeking. Using the 36-item Difficulties in Emotion Regulation Scale (DERS; Gratz and Roemer, 2004), we examined six facets of emotion regulation: nonacceptance of emotional responses, difficulty engaging in goal-direct behavior, impulsive control difficulties, lack of emotional awareness, limited access to emotion regulation strategies, lack of emotional clarity.
We also assessed several marijuana-related variables. Marijuana descriptive norms, or perceptions of how frequently others use marijuana, was assessed using the same marijuana use frequency measures to assess one’s marijuana use but in reference to the “typical college student” (hypothetical range: 0-42). Marijuana injunctive norms, or perceptions of how much others approve of marijuana use, was assessed using a 9 item measure that assesses three behaviors (“using marijuana,” “using marijuana to get high,” and “using marijuana daily”) for three reference groups (“Your best friends,” “Typical college students,” and “Your parents”). Internalization of the college marijuana culture, or the degree to which one perceives marijuana use to be integral to the college experience, was assessed using the 8-item Perceived Importance of Marijuana to the College Experience (PIMCES; Pearson et al., 2016). Reasons for using marijuana (social, coping, enhancement, conformity, and expansion) was assessed using the 25-item Marijuana Motives Questionnaire (MMQ; Simons et al., 1998). Identification with being a marijuana user was assessed using a 5-item measure adapted from the Smoker Self-Concept Scale (Shadel and Mermelstein, 1996). Utilization of protective behavioral strategies, or behavioral strategies aimed at reducing marijuana use, intoxication, and/or related harms, was assessed using the 29-item Protective Behavioral Strategies-Marijuana (PBSM; Pedersen et al., 2016).
3. Results
3.1. Class Solution
To determine the number of latent classes in our sample based on marijuana use indicators, we used the Lo-Mendell-Rubin Adjusted Likelihood Ratio Test (Lo et al., 2001; Vuong, 1989), which compares whether a k class solution fits better than a k − 1 class solution. The Likelihood Ratio Test suggests that a 2-class solution fit significantly better than a 1-class solution (p < .001), a 3-class solution fit significantly better than a 2-class solution (p < .001), and a 4-class solution fit significantly better than a 3-class solution (p = .011); however, a 5-class solution did not fit significantly better than a 4-class solution (p = .685). Therefore, we settled on a 4-class solution. Table 2 reports commonly used fit statistics for 1 through 6 class solutions. Importantly, our relative entropy was .957, indicating that about 19 out of 20 subjects were correctly classified in the appropriate latent class, which is excellent classification quality (>.80 is considered ‘high’, Clark and Muthen, 2009).
Table 2.
Fit statistics for 1 through 6 class solutions for Latent Profile Analysis (LPA).
| Number of Classes | ||||||
|---|---|---|---|---|---|---|
|
| ||||||
| Fit Statistics | 1 | 2 | 3 | 4 | 5 | 6 |
| AIC | 60030.42 | 55538.71 | 53281.74 | 52541.65 | 52201.57 | 51730.42 |
| BIC | 60075.73 | 55612.33 | 53383.68 | 52671.91 | 52360.15 | 51917.32 |
| Adjusted BIC | 60050.31 | 55571.03 | 53326.49 | 52598.84 | 52271.19 | 51812.47 |
| Entropy | — | 0.951 | 0.957 | 0.957 | 0.959 | 0.939 |
| Smallest n | 2,129 | 518 | 195 | 76 | 76 | 64 |
| LRT | — | p < .001 | p < .001 | p = .011 | p = .685 | p = .831 |
Note. AIC = Akaike Information Criterion, BIC = Bayesian Information Criterion. LRT = Lo-Mendell-Rubin Adjusted Likelihood Ratio Test.
Figure 1 depicts the pattern of means across the 4 latent classes. Class 1 was the largest class, with 68.6% of the sample (n = 1,461.13), reported using 3 to 4 days per month on average (M = 3.69), 2 to 3 times during typical and heaviest use weeks (M = 2.42, 2.64), and experienced about 6 negative consequences from marijuana use (M = 6.24). Class 2 was the next largest class, with 19.46% of the sample (n = 414.34), reported using about 20 days per month (M = 20.24), using 8 to 11 times during typical and heaviest use weeks, and experienced nearly 11 negative consequences from marijuana use. Class 3 was the next largest class, with 8.31% of the sample (n = 176.81), reported using about 25 days per month, 17 to 23 times during typical and heaviest use weeks, and experienced nearly 14 negative consequences from marijuana use. Class 4 was the smallest class, with 3.61% of the sample (n = 76.73), reported using 27 to 28 days per month, 29 to 33 times during typical and heaviest use weeks, and experienced nearly 15 negative consequences from their marijuana use.
Figure 1.
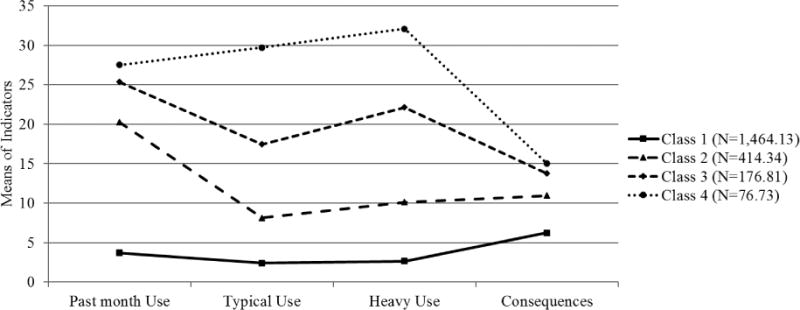
Depiction of the four latent classes defined by the pattern of means on past month marijuana use (mean days), marijuana use in a typical week (times used in terms of 6 4-hour blocks of time), marijuana use on heaviest use week (times used in terms of 6 4-hour blocks of time), and marijuana-related negative consequences (mean frequency of negative consequences experienced in the past month).
3.2. Equality of Means
Based on our 4-class solution, we tested the equality of means across latent classes on various marijuana-related variables using pseudo-class-based multiple imputations (Asparouhov and Muthén, 2007). Rather than assigning individuals to the latent class where their membership has the highest probability and conducting traditional techniques like analysis of variance (ANOVA), this method accounts for the probabilistic nature of class membership, and both global and pairwise comparisons can be conducted using Wald tests. Results are summarized in Table 3 and 4. To provide sociodemographics of these classes, we examined age (means) and gender (percentage of female) differences in each class. Within these classes, Class 1 had a significantly lower age group (M = 19.76) of individuals compared to Class 3 and 4 (see Table 3). Among gender, about 67% of the individuals in Class 1 were female which was significantly higher than Class 2 (55%), Class 3 (50%), and Class 4 (37%). To maximize interpretability of mean differences, all variables were converted to z-scores (see Table 4) and a mean difference of one indicates a one-standard deviation difference.
Table 3.
Mean comparisons between latent classes on personal beliefs and coping styles.
| Class 1 | Class 2 | Class 3 | Class 4 | |
|---|---|---|---|---|
| Demographic Factors | ||||
|
| ||||
| Age | 19.762a | 20.172ab | 20.576b | 20.878b |
| Percentage of Females | 67%a | 55%b | 50%bc | 37%c |
|
| ||||
| Impulsivity-like Traits | ||||
|
| ||||
| Premeditation | 2.881a | 2.824b | 2.861ab | 2.842ab |
| Perseverance | 2.913a | 2.842b | 2.872ab | 2.836ab |
| Sensation-Seeking | 2.840a | 2.852a | 2.871a | 2.906a |
| Negative Urgency | 2.370a | 2.409a | 2.373a | 2.403a |
| Positive Urgency | 2.053a | 2.085a | 2.084a | 2.086a |
|
| ||||
| SURPS Personality Traits | ||||
|
| ||||
| Hopelessness | 1.869a | 1.927b | 1.881ab | 1.920ab |
| Anxiety Sensitivity | 2.545a | 2.504ab | 2.438b | 2.405b |
| Impulsivity | 2.146a | 2.173a | 2.139a | 2.953a |
| Sensation-Seeking | 2.837a | 2.892a | 2.906a | 2.086a |
|
| ||||
| Sensation Seeking Facets | ||||
|
| ||||
| Risk Seeking | 2.991a | 3.117b | 3.045ab | 3.136ab |
| Experience Seeking | 3.912a | 3.902a | 3.891a | 3.926a |
|
| ||||
| Emotion Regulation Facets | ||||
|
| ||||
| Nonacceptance | 2.299a | 2.316a | 2.189a | 2.307a |
| Goals | 2.945a | 2.879a | 2.910a | 2.836a |
| Impulse | 2.056a | 2.106a | 2.063a | 2.015a |
| Aware | 2.505a | 2.498a | 2.444a | 2.390a |
| Strategies | 2.224a | 2.260a | 2.212a | 2.212a |
| Clarity | 2.360a | 2.406a | 2.368a | 2.287a |
|
| ||||
| Marijuana-related Perceptions | ||||
|
| ||||
| Descriptive Norms-Typical | 7.911a | 10.070b | 13.340c | 15.545c |
| Descriptive Norms-Heaviest | 8.345a | 12.093b | 17.372c | 19.647c |
| Injunctive Norms-Best Friends | 5.032a | 5.785b | 6.099c | 6.243c |
| Injunctive Norms-College Students | 5.152a | 5.267a | 5.328a | 5.332a |
| Injunctive Norms-Parent | 2.209a | 2.717b | 3.242c | 3.284c |
| Internalized Norms | 2.476a | 2.802b | 2.850bc | 2.975c |
|
| ||||
| Motives | ||||
|
| ||||
| Social Motives | 2.577a | 2.826b | 2.901b | 3.056b |
| Coping Motives | 2.027a | 2.521b | 2.687b | 2.736b |
| Enhancement Motives | 3.508a | 3.914b | 4.041b | 4.121b |
| Conformity Motives | 1.491a | 1.482a | 1.415a | 1.360a |
| Expansion Motives | 2.199a | 2.893b | 3.083b | 3.043b |
|
| ||||
| Other Factors | ||||
|
| ||||
| Marijuana User Identification | 1.729a | 3.040b | 3.794c | 4.219d |
| Protective Behavioral Strategies | 4.425a | 3.758b | 3.299c | 2.862d |
Note. Means sharing a subscript in a row indicate means that are not significantly different from each other. For gender, values represent percentage of females within the class.
Table 4.
Standardized mean comparisons between latent classes on personal beliefs and coping styles.
| Class 1 | Class 2 | Class 3 | Class 4 | Largest Class Difference | |
|---|---|---|---|---|---|
| Impulsivity-like Traits | |||||
|
| |||||
| Premeditation | 0.035a | −0.108b | −0.015ab | −0.059ab | d=0.143 |
| Perseverance | 0.052a | −0.132b | −0.053ab | −0.147ab | d=0.199 |
| Sensation-Seeking | −0.014a | 0.008a | 0.046a | 0.125a | d=0.139 |
| Negative Urgency | −0.019a | 0.062a | −0.014a | 0.054a | d=0.081 |
| Positive Urgency | −0.019a | 0.040a | 0.040a | 0.050a | d=0.069 |
|
| |||||
| SURPS Personality Traits | |||||
|
| |||||
| Hopelessness | −0.030a | 0.092b | −0.001ab | 0.072ab | d=0.122 |
| Anxiety Sensitivity | 0.046a | −0.041ab | −0.178b | −0.250b | d=0.296 |
| Impulsivity | −0.011a | 0.044a | −0.027a | 0.038a | d=0.071 |
| Sensation-Seeking | −0.039a | 0.066a | 0.088a | 0.181a | d=0.220 |
|
| |||||
| Sensation Seeking Facets | |||||
|
| |||||
| Risk Seeking | −0.054a | 0.145b | 0.030ab | 0.177ab | d=0.231 |
| Experience Seeking | 0.006a | −0.013a | −0.029a | 0.027a | d=0.056 |
|
| |||||
| Emotion Regulation Facets | |||||
|
| |||||
| Nonacceptance | 0.006a | 0.022a | −0.105a | 0.009a | d=0.127 |
| Goals | 0.021a | −0.048a | −0.108a | −0.101a | d=0.129 |
| Impulse | −0.011a | 0.050a | −0.002a | −0.063a | d=0.113 |
| Aware | 0.014a | 0.003a | −0.067a | −0.134a | d=0.148 |
| Strategies | −0.006a | 0.035a | −0.020a | −0.023a | d=0.058 |
| Clarity | −0.009a | 0.048a | 0.005a | −0.109a | d=0.157 |
|
| |||||
| Marijuana-related Perceptions | |||||
|
| |||||
| Descriptive Norms-Typical | −0.144a | 0.128b | 0.536c | 0.812c | d=0.956 |
| Descriptive Norms-Heaviest | −0.214a | 0.212b | 0.811c | 1.070c | d=1.284 |
| Injunctive Norms-Best Friends | −0.217a | 0.370b | 0.611c | 0.725c | d=0.942 |
| Injunctive Norms-College Students | −0.040a | 0.066a | 0.120a | 0.132a | d=0.172 |
| Injunctive Norms-Parent | −0.154a | 0.192b | 0.563c | 0.597c | d=0.751 |
| Internalized Norms | −0.183a | 0.346b | 0.426bc | 0.632c | d=0.851 |
|
| |||||
| Motives | |||||
|
| |||||
| Social Motives | −0.090a | 0.156b | 0.224b | 0.380b | d=0.470 |
| Coping Motives | −0.166a | 0.302b | 0.457b | 0.505b | d=0.671 |
| Enhancement Motives | −0.147a | 0.270b | 0.392b | 0.482b | d=0.629 |
| Conformity Motives | 0.017a | 0.001a | −0.082a | −0.154a | d=0.171 |
| Expansion Motives | −0.204a | 0.395b | 0.555b | 0.524b | d=0.728 |
|
| |||||
| Other Factors | |||||
|
| |||||
| Marijuana User Identification | −0.356a | 0.548b | 1.062c | 1.356d | d=1.712 |
| Protective Behavioral Strategies | 0.298a | −0.412b | −0.904c | −1.365d | d=1.663 |
Note. Means sharing a subscript in a row indicate means that are not significantly different from each other.
On impulsivity-like traits, Class 1 had slightly higher levels of Premeditation and Perseverance compared to Class 2, but no differences were found on sensation seeking, negative urgency, or positive urgency. On the SURPS personality traits, Class 2 had higher levels of hopelessness than Class 1, and Classes 3 and 4 had lower levels of anxiety sensitivity than Class 1, but no differences were found on sensation seeking or impulsivity. Based on the SSPTQ that decomposes sensation seeking, Class 1 showed lower levels of risk seeking compared to Class 2, but no differences on experience seeking. There were no significant between-class differences on any of the facets of emotion regulation.
On measures of marijuana descriptive norms (typical and heaviest), we found a gradient pattern such that norms were lowest in Class 1, significantly higher in Class 2, and significantly higher in Classes 3 and 4, which did not significantly differ from each other. We observed this same pattern for marijuana injunctive norms for one’s best friends and one’s parents, but did not find any significant differences for marijuana injunctive norms for typical college students. For the PIMCES, Class 1 reported the lowest internalization of college marijuana culture followed by Class 2, which did not significantly different from Class 3, but was significantly lower than Class 4, which did not significantly differ from Class 3.
On marijuana motives, Class 1 showed significantly lower social motives, coping motives, enhancement motives, and expansion motives compares to Classes 2, 3, and 4, which did not significantly differ from each other. No differences were found on conformity motives. On marijuana identification, all classes were significantly different from all other classes such that the heavier user classes showed higher identification with marijuana users. The exact opposite pattern was observed with marijuana protective behavioral strategies such that heavier user classes were associated with lower use of protective behavioral strategies.
4. Discussion
The marijuana literature is limited by the fact that much research is focused on comparing users to non-users. This standard practice unwittingly assumes that marijuana users are a homogenous population. The present study put this assumption to the test by using latent profile analysis to determine if there are distinct types of marijuana user classes defined by indicators of marijuana frequency and experiences of negative consequences. In support of previous person-centered research finding heterogeneity in marijuana use among adolescents (Eassey et al., 2015; Hix-Small et al., 2004; Windle and Wiesner, 2004), we identified four latent classes with the largest class consisting of infrequent marijuana users, and three other classes demonstrating increasingly frequent use and more negative consequences with the most severe class being the smallest class.
Across several personality traits, we observed small yet statistically significant differences between the two largest classes (Class 1 and Class 2) such that the more frequent marijuana user class demonstrated a riskier profile (e.g., higher on impulsivity-like traits and risk seeking) than the infrequent marijuana user class; however, these traits largely failed to distinguish between the three higher frequency marijuana user classes. However, moving from the least frequent/least negative consequences class (Class 1) to the most frequent/most negative consequences class (Class 4), we found the largest differences (i.e., distinction across classes) to be on identification with being a marijuana user and use of protective behavioral strategies. Specifically, we found roughly half a standard deviation difference between classes on both of these outcomes (see Table 4).
Social Identity Theory (Hogg et al., 2004) posits that identity is defined by the groups with which an individual identifies and that much of human behavior is influenced by the norms of such groups. Thus, one would expect that higher identification with being a marijuana user would be associated with marijuana-related outcomes. Consistent with previous research (Neighbors et al., 2013), we found an increase in frequency of marijuana use and marijuana negative consequences across the classes to be monotonically associated with increased identification with being a marijuana user.
Reviews of the alcohol literature demonstrate that use of alcohol protective behavioral strategies (i.e., strategies used before, during, or after drinking to reduce use, intoxication, and/or harm) are associated with decreased alcohol use and alcohol-related negative consequences (Pearson, 2013; Prince et al., 2013). Stemming from a similar harm reduction perspective, Pedersen et al. (2016) recently developed a measure of marijuana protective behavioral strategies, which we found to strongly distinguish between the user classes such that the more problematic user classes reported lower use of these strategies. Therefore, building off of the only published study to date examining marijuana protective behavioral strategies (Pedersen et al., 2016), the present study provides additional evidence that this construct is an important protective factor.
From a clinical perspective, the present study highlights that it is unlikely that a one-size-fits-all approach to preventions/interventions targeting marijuana use will be successful. Specifically, we identified users with distinct use profiles who also demonstrated differences on a wide range of traits that may be relevant to the theoretical model guiding specific intervention strategies. For example, previous research suggests that marijuana descriptive norms predicts marijuana use only among individuals who identify strongly with marijuana users and weakly with typical college students (Neighbors et al., 2013). Thus, personalized feedback may be effective for individuals with this pattern of pre-existing social identity (e.g., Class 4) but not for individuals who do not strongly identify with marijuana users (e.g., Class 1).
4.1. Limitations
Several important limitations of the present study must be noted. First, the cross-sectional, non-experimental study design prevents us from making causal inferences. Longitudinal and experimental designs are needed to make such inferences. Second, we did not actively ensure that we obtained a nationally representative sample so we cannot be sure whether our results generalize to the population of college students in the United States. By collecting data from Psychology department participant pools, psychology pools are likely overrepresented, and we know that women were overrepresented relative to the college student population as a whole. Collecting a larger, more representative sample, and using sampling weights are ways that future studies could attempt to improve the likelihood that findings generalize to this population. Third, by collecting a college sample, it is unknown whether our results would generalize to non-college attending individuals. Fourth, we did not assess presence, likelihood, symptoms, or severity of a CUD or other alcohol/substance use. Future studies examining CUD symptoms could improve our description of the distinct user classes. For example, we expect that Classes and 3 and 4 have substantially more individuals with a CUD compared to Classes 1 and 2; however, we were unable to test this hypothesis with the current data. Fifth, although we extracted four classes, other class solutions are viable. For example, when we extracted five and six class solutions, we found additional classes that exhibited a moderate frequency of marijuana use and a moderate experience of consequences. Therefore, there are limitations with regards to determining exactly how many classes exist in the population, and these results should be considered preliminary until replicated. Relatedly, although we had multiple indicators of marijuana use frequency, we may be able to better distinguish between types of marijuana users if we had included measures of quantity of marijuana use, level of subjective intoxication from marijuana use, and estimates of the potency of marijuana used. Future studies with a more comprehensive assessment of marijuana use indicators are likely to find different class solutions that may lead to making finer-grained distinctions between user types. For example, although Class 1 experienced the fewest amount of consequences, these additional indicators may identify additional heterogeneity among infrequent marijuana users, including individuals experiencing no, few, or more negative consequences.
4.2. Conclusions
Using latent profile analysis, the present study demonstrates that college student marijuana users are a heterogeneous group. Not only can this heterogeneity be distinguished by a careful examination of marijuana use involvement (including marijuana use frequency and marijuana negative consequences), but we can also examine the risk/protective factors that are associated with being a particular type of marijuana user. Interestingly, our largest class of individuals were infrequent marijuana users who did not appear to experience many negative consequences from their use. Three additional classes reported more problematic use patterns that were associated with experiencing increased negative consequences. Taken together, our results suggests that those who use cannabis a few times per month are different from those who are near-daily or daily users. Further, our examination of factors that distinguished between user classes revealed the relative importance of two constructs that are not well-researched in the marijuana field: identification with being a marijuana user and the use of protective behavioral strategies. Given the growing number of studies supporting alcohol protective behavioral strategies in intervention contexts (Barnett et al., 2007; Larimer et al., 2007; Murphy et al., 2012), we suggest that similar attempts to address these harm-reducing strategies in preventative interventions. Therefore, we hope our findings serve as a call to action for the field to consider examining these constructs in future studies and to move away from only examining users vs. non-users.
Contributor Information
Matthew R. Pearson, Center on Alcoholism, Substance Abuse, and Addictions, University of New Mexico, 2650 Yale Blvd SE, Albuquerque, NM 87106.
Adrian J. Bravo, Center on Alcoholism, Substance Abuse, and Addictions, University of New Mexico, 2650 Yale Blvd SE, Albuquerque, NM 87106
Bradley T. Conner, Department of Psychology, Colorado State University, 1876 Campus Delivery, Colorado State University, Fort Collins, CO 80523-1876
References
- Arria AM, Caldeira KM, Bugbee BA, Vincent KB, O’Grady KE. Marijuana use trajectories during college predict health outcomes nine years post-matriculation. Drug Alcohol Depend. 2016;159:158–165. doi: 10.1016/j.drugalcdep.2015.12.009. [DOI] [PMC free article] [PubMed] [Google Scholar]
- Asparouhov T, Muthén B. Proceedings of the 2007 Joint Statistical Meetings, Section on Statistics in Epidemiology. Alexandria, VA: American Statistical Association; 2007. Computationally efficient estimation of multilevel high-dimensional latent variable models; pp. 2531–2535. [Google Scholar]
- Barnett NP, Murphy JG, Colby SM, Monti PM. Efficacy of counselor vs. computer-delivered intervention with mandated college students. Addict Behav. 2007;32:2529–2548. doi: 10.1016/j.addbeh.2007.06.017. [DOI] [PMC free article] [PubMed] [Google Scholar]
- Brook JS, Zhang C, Brook DW. Antisocial behavior at age 37: Developmental trajectories of marijuana use extending from adolescence to adulthood. Am J Addict. 2011;20:509–515. doi: 10.1111/j.1521-0391.2011.00179.x. [DOI] [PMC free article] [PubMed] [Google Scholar]
- Brown TL, Flory K, Lynam DR, Leukefeld C, Clayton RR. Comparing the developmental trajectories of marijuana use of African American and Caucasian adolescents: Patterns, antecedents, and consequences. Exp Clin Psychopharmacol. 2004;12:47–56. doi: 10.1037/1064-1297.12.1.47. [DOI] [PubMed] [Google Scholar]
- Caldeira KM, O’Grady KE, Vincent KB, Arria AM. Marijuana use trajectories during the post-college transition: Health outcomes in young adulthood. Drug Alcohol Depend. 2012;125:267–275. doi: 10.1016/j.drugalcdep.2012.02.022. [DOI] [PMC free article] [PubMed] [Google Scholar]
- Carlson RG, Wang J, Falck RS, Siegal HA. Drug use practices among MDMA/ecstasy users in Ohio: A latent class analysis. Drug Alcohol Depend. 2005;79:167–179. doi: 10.1016/j.drugalcdep.2005.01.011. [DOI] [PubMed] [Google Scholar]
- Center for Behavioral Health Statistics and Quality. 2014 National survey on drug use and health: Detailed tables. Substance Abuse and Mental Health Services Administration; Rockville, MD: 2015. [Google Scholar]
- Clark SL, Muthén B. Relating latent class analysis results to variables not included in the analysis. 2009 Manuscript unpublished. [Google Scholar]
- Collins LM, Lanza ST. Latent class and latent transition analysis with applications in the social, behavioural, and health sciences. Hoboken, NJ: John Wiley & Sons, Inc; 2010. [Google Scholar]
- Collins RL, Parks GA, Marlatt GA. Social determinants of alcohol consumption: the effects of social interaction and model status on the self-administration of alcohol. J Consult Clin Psychol. 1985;53:189. doi: 10.1037/0022-006X.53.2.189. [DOI] [PubMed] [Google Scholar]
- Conner BT. Sensation Seeking Personality Trait Questionnaire. 2015 Unpublished scale. [Google Scholar]
- Cyders MA, Smith GT. Mood-based rash action and its components: Positive and negative urgency. Pers Individ Dif. 2007;43:839–850. doi: 10.1016/j.paid.2007.02.008. [DOI] [Google Scholar]
- Davis ML, Powers MB, Handelsman P, Medina JL, Zvolensky M, Smits JAJ. Behavioral therapies for treatment-seeking cannabis users: a meta-analysis of randomized controlled trials. Eval Health Prof. 2015;38:94–114. doi: 10.1177/0163278714529970. [DOI] [PMC free article] [PubMed] [Google Scholar]
- Dvorak RD, Day AM. Marijuana and self-regulation: Examining likelihood and intensity of use and problems. Addict Behav. 2014;39:709–712. doi: 10.1016/j.addbeh.2013.11.001. [DOI] [PMC free article] [PubMed] [Google Scholar]
- Eassey JM, Gibson CL, Krohn MD. Using a Group-Based Trajectory Approach to Assess Risk and Protective Factors of Marijuana Use. J Drug Issues. 2015;45:4–21. doi: 10.1177/0022042614542508. [DOI] [Google Scholar]
- Ellickson PL, Martino SC, Collins RL. Marijuana use from adolescence to young adulthood: Multiple developmental trajectories and their associated outcomes. Health Psychol. 2004;23:299–307. doi: 10.1037/0278-6133.23.3.299. [DOI] [PubMed] [Google Scholar]
- Galbraith T, Conner BT. Religiosity as a Moderator of the Relation Between Sensation Seeking and Substance Use for College-Aged Individuals. Psychol Addict Behav. 2015;29:168–175. doi: 10.1037/adb0000037. [DOI] [PubMed] [Google Scholar]
- Gratz KL, Roemer L. Multidimensional assessment of emotion regulation and dysregulation: Development, factor structure, and initial validation of the difficulties in emotion regulation scale. J Psychopathol Behav Assess. 2004;26:41–54. doi: 10.1023/B:JOBA.0000007455.08539.94. [DOI] [Google Scholar]
- Hix-Small H, Duncan TE, Duncan SC, Okut H. Multivariate associative finite growth mixture model approach examining adolescent alcohol and marijuana use. J Psychopathol Behav Assess. 2004;26:255–270. doi: 10.1023/B:JOBA.0000045341.56296.fa. [DOI] [Google Scholar]
- Hogg MA, Abrams D, Otten S, Hinkle S. The social identity perspective intergroup relations, self-conception, and small groups. Small Gr Res. 2004;35:246–276. doi: 10.1177/1046496404263424. [DOI] [Google Scholar]
- Jackson KM, Sher KJ, Schulenberg JE. Conjoint developmental trajectories of young adult substance use. Alcohol Clin Exp Res. 2008;32:723–737. doi: 10.1111/j.1530-0277.2008.00643.x. [DOI] [PMC free article] [PubMed] [Google Scholar]
- Johnston LD, O’Malley PM, Bachman JG, Schulenberg JE, Miech RA. Monitoring the Future national survey results on drug use, 1975–2014: Volume 2, College students and adults ages 19–55. Ann Arbor, MI: Institute for Social Research, The University of Michigan; 2015. [Google Scholar]
- Juon HS, Fothergill KE, Green KM, Doherty EE, Ensminger ME. Antecedents and consequences of marijuana use trajectories over the life course in African American population. Drug Alcohol Depend. 2011;118:216–223. doi: 10.1016/j.drugalcdep.2011.03.027. [DOI] [PMC free article] [PubMed] [Google Scholar]
- Kena G, Musu-Gillette L, Robinson J, Wang X, Rathbun A, Zhang J, Dunlop Velez E. The Condition of Education 2015 NCES 2015-144. Washington, DC: National Center for Education Statistics; 2015. [Google Scholar]
- Larimer ME, Lee CM, Kilmer JR, Fabiano PM, Stark CB, Geisner IM, Mallett KA, Lostutter TW, Cronce JM, Feeney M, Neighbors C. Personalized mailed feedback for college drinking prevention: A randomized clinical trial. J Consult Clin Psychol. 2007;75:285–293. doi: 10.1037/0022-006X.75.2.285. [DOI] [PMC free article] [PubMed] [Google Scholar]
- Lo Y, Mendell N, Rubin D. Testing the number of components in a normal mixture. Biometrika. 2001;88:767–778. doi: 10.1093/biomet/88.3.767. [DOI] [Google Scholar]
- Monga N, Rehm J, Fischer B, Brissette S, Bruneau J, El-Guebaly N, Bahl S. Using latent class analysis LCA to analyze patterns of drug use in a population of illegal opioid users. Drug Alcohol Depend. 2007;88:1–8. doi: 10.1016/j.drugalcdep.2006.08.029. [DOI] [PubMed] [Google Scholar]
- Murphy JG, Dennhardt AA, Skidmore JR, Borsari B, Barnett NP, Colby SM, Martens MP. A randomized controlled trial of a behavioral economic supplement to brief motivational interventions for college drinking. J Consult Clin Psychol. 2012;80:876–886. doi: 10.1037/a0028763. [DOI] [PMC free article] [PubMed] [Google Scholar]
- Napper LE, Hummer JF, Chithambo TP, LaBrie JW. Perceived parent and peer marijuana norms: the moderating effect of parental monitoring during college. Prev Sci. 2015;16:364–73. doi: 10.1007/s11121-014-0493-z. [DOI] [PMC free article] [PubMed] [Google Scholar]
- Neighbors C, Geisner IM, Lee CM. Perceived marijuana norms and social expectancies among entering college student marijuana users. Psychol Addict Behav. 2008;22:433. doi: 10.1037/0893-164X.22.3.433. [DOI] [PubMed] [Google Scholar]
- Neighbors C, Foster DW, Walker DD, Kilmer JR, Lee CM. Social identity as a moderator of the association between perceived norms and marijuana use. J Stud Alcohol Drugs. 2013;74:479. doi: 10.15288/jsad.2013.74.479. [DOI] [PMC free article] [PubMed] [Google Scholar]
- Pacula RL, Sevigny EL. Assessing the effects of medical marijuana laws on marijuana use : The devil is in the details. J Policy Anal Manage. 2015;34:7–31. doi: 10.1002/pam.21804. [DOI] [PMC free article] [PubMed] [Google Scholar]
- Pearson MR. Use of alcohol protective behavioral strategies among college students: A critical review. Clin Psychol Rev. 2013;33:1025–1040. doi: 10.1016/j.cpr.2013.08.006. [DOI] [PMC free article] [PubMed] [Google Scholar]
- Pearson MR, Kholodkov T, Gray MJ, Marijuana Outcomes Study Team Perceived Importance of Marijuana to the College Experience: Initial development and validation. Journal of Studies on Alcohol and Drugs. :2016. doi: 10.15288/jsad.2017.78.319. [DOI] [PMC free article] [PubMed] [Google Scholar]
- Pedersen ER, Hummer JF, Rinker DV, Traylor ZK, Neighbors C. Measuring protective behavioral strategies for marijuana use among young adults. J Stud Alcohol Drugs. 2016;773:441–450. doi: 10.15288/jsad.2016.77.441. [DOI] [PMC free article] [PubMed] [Google Scholar]
- Prince MA, Carey KB, Maisto SA. Protective behavioral strategies for reducing alcohol involvement: A review of the methodological issues. Addict Behav. 2013;38:2343–2351. doi: 10.1016/j.addbeh.2013.03.010. [DOI] [PubMed] [Google Scholar]
- Read JP, Kahler CW, Strong D, Colder CR. Development and preliminary validation of the Young Adult Alcohol Consequences Questionnaire. J Stud Alcohol Drugs. 2006;67:169–177. doi: 10.15288/jsa.2006.67.169. [DOI] [PubMed] [Google Scholar]
- Reboussin BA, Song E, Shrestha A, Lohman KK, Wolfson M. A latent class analysis of underage problem drinking: Evidence from a community sample of 16-20 year olds. Drug Alcohol Depend. 2006;83:199–209. doi: 10.1016/j.drugalcdep.2005.11.013. [DOI] [PMC free article] [PubMed] [Google Scholar]
- Room R. Legalizing a market for cannabis for pleasure: Colorado, Washington, Uruguay and beyond. Addiction. 2014;109:345–51. doi: 10.1111/add.12355. [DOI] [PubMed] [Google Scholar]
- Schulenberg JE, Merline AC, Johnston LD, O’Malley PM, Bachman JG, Laetz VB. Trajectories of marijuana use during the transition to adulthood: The big picture based on national panel data. J Drug Issues. 2005;35:255–280. doi: 10.1177/002204260503500203. [DOI] [PMC free article] [PubMed] [Google Scholar]
- Shadel WG, Mermelstein R. Individual differences in self-concept among smokers attempting to quit: Validation and predictive utility of measures of the smoker self-concept and abstainer self-concept. Ann Behav Med. 1996;18:151–156. doi: 10.1007/BF02883391. [DOI] [PubMed] [Google Scholar]
- Simons J, Correia CJ, Carey KB, Borsari BE. Validating a five-factor marijuana motives measure : Relations with use, problems, and alcohol motives. J Counsel Psychol. 1998;45:265–273. doi: 10.1037/0022-0167.45.3.265. [DOI] [Google Scholar]
- Simons JS, Dvorak RD, Merrill JE, Read JP. Dimensions and severity of marijuana consequences: development and validation of the Marijuana Consequences Questionnaire MACQ. Addict Behav. 2012;37:613–21. doi: 10.1016/j.addbeh.2012.01.008. [DOI] [PMC free article] [PubMed] [Google Scholar]
- Swaim RC. Individual and school level effects of perceived harm, perceived availability, and community size on marijuana use among 12th-grade students : A random effects model. Prev Sci. 2003;4:89–98. doi: 10.1023/A:1022922231605. [DOI] [PubMed] [Google Scholar]
- Substance Abuse and Mental Health Services Administration. Results from the 2012 National Survey on Drug Use and Health: Summary of National Findings. Rockville, MD: 2013. (NSDUH Series H-46. HHS Publication No. SMA 13-4795). [Google Scholar]
- Sutfin EL, Reboussin BA, McCoy TP, Wolfson M. Are college student smokers really a homogenous group? A latent class analysis of college student smokers. Nicotine Tob Res. 2009;11:444–454. doi: 10.1093/ntr/ntp006. [DOI] [PMC free article] [PubMed] [Google Scholar]
- Tait RJ, Mackinnon A, Christensen H. Cannabis use and cognitive function: 8-year trajectory in a young adult cohort. Addiction. 2011;106:2195–2203. doi: 10.1111/j.1360-0443.2011.03574.x. [DOI] [PubMed] [Google Scholar]
- Volkow ND, Baler RD, Compton WM, Weiss SR. Adverse health effects of marijuana use. N Engl J Med. 2014;370:2219–2227. doi: 10.1056/NEJMra1402309. [DOI] [PMC free article] [PubMed] [Google Scholar]
- Vuong Q. Likelihood ratio tests for model selection and non-nested hypotheses. Econometrica. 1989;57:307–333. doi: 10.2307/19125. [DOI] [Google Scholar]
- Whiteside SP, Lynam DR. The five factor model and impulsivity: Using a structural model of personality to understand impulsivity. Pers Individ Dif. 2001;30:669–689. doi: 10.1016/S0191-88690000064-7. [DOI] [Google Scholar]
- Williams CD, Adams SE, Stephens RS, Roffman R. Varied methods of assessing marijuana use and related problems: Validity analyses; 34th Annual Convention of the Association for the Advancement of Behavior Therapy; New Orleans, LA. 2000. [Google Scholar]
- Windle M, Wiesner M. Trajectories of marijuana use from adolescence to young adulthood: Predictors and outcomes. Dev Psychopathol. 2004;16:1007–1027. doi: 10.1017/S0954579404040118. [DOI] [PubMed] [Google Scholar]
- Woicik PA, Stewart SH, Pihl RO, Conrod PJ. The Substance Use Risk Profile Scale: A scale measuring traits linked to reinforcement-specific substance use profiles. Addict Behav. 2009;34:1042–55. doi: 10.1016/j.addbeh.2009.07.001. [DOI] [PubMed] [Google Scholar]