Abstract
The stapes is held in the oval window by the stapedial annular ligament (SAL), which restricts total peak-to-peak displacement of the stapes. Previous studies have suggested that for moderate (< 130 dB SPL) sound levels intracochlear pressure (PIC), measured at the base of the cochlea far from the basilar membrane, increases directly proportionally with stapes displacement (DStap), thus a current model of impulse noise exposure (the Auditory Hazard Assessment Algorithm for Humans, or AHAAH) predicts that peak PIC will vary linearly with DStap up to some saturation point. However, no direct tests of DStap, or of the relationship with PIC during such motion, have been performed during acoustic stimulation of the human ear. In order to examine the relationship between DStap and PIC to very high level sounds, measurements of DStap and PIC were made in cadaveric human temporal bones. Specimens were prepared by mastoidectomy and extended facial recess to expose the ossicular chain. Measurements of PIC were made in scala vestibuli (PSV) and scala tympani (PST), along with the SPL in the external auditory canal (PEAC), concurrently with laser Doppler vibrometry (LDV) measurements of stapes velocity (VStap). Stimuli were moderate (~100 dB SPL) to very high level (up to ~170 dB SPL), low frequency tones (20–2560 Hz). Both DStap and PSV increased proportionally with sound pressure level in the ear canal up to approximately ~150 dB SPL, above which both DStap and PSV showed a distinct deviation from proportionality with PEAC. Both DStap and PSV approached saturation: DStap at a value exceeding 150 μm, which is substantially higher than has been reported for small mammals, while PSV showed substantial frequency dependence in the saturation point. The relationship between PSV and DStap remained constant, and cochlear input impedance did not vary across the levels tested, consistent with prior measurements at lower sound levels. These results suggest that PSV sound pressure holds constant relationship with DStap, described by the cochlear input impedance, at these, but perhaps not higher, stimulation levels. Additionally, these results indicate that the AHAAH model, which was developed using results from small animals, underestimates the sound pressure levels in the cochlea in response to high level sound stimulation, and must be revised.
Keywords: Laser Doppler vibrometry, intracochlear pressure, high level sound, stapedial annular ligament
1. INTRODUCTION
The relationship between extreme acoustical events, such as blast waves produced by explosions, and damage to the auditory system has been under investigation since the development of high explosives in the 19th century (Sexton, 1887), and remains an issue of great importance, particularly in the modern military (Gee et al., 2013). The primary injuries of blast exposure include organs in the thoracic and abdominal cavities, the eyes and brain, and in particular, the ears (Mayorga, 1997). Injuries to the auditory system include tympanic membrane rupture and ossicular dislocation (Chandler et al., 1997; Mayo et al., 2006), as well as damaged and missing inner and outer hair cells in the cochlea (Patterson et al., 1997). Auditory injury has been used to predict injuries related to blast exposure, though previous research suggests that tympanic membrane rupture is a poor marker of pulmonary or intestinal injury (Leibovici et al., 1999). Pain, tinnitus, hyperacusis, vestibular dysfunction, and both temporary and permanent hearing loss, resulting from both conductive and sensorineural damage, are common following blast exposure (Fausti et al., 2009; Rao et al., 1980).
While the long term effects of blast injury in the auditory system have been well described (Fausti et al., 2009; Patterson et al., 1997), the precise dynamics of ossicular motion during high-level events remain unclear. In particular, responses during high level, low frequency stimulation, such as occur as a result of an explosion (Reed, 1977), have not been well characterized. One particularly important component affecting transmission of high level sound stimulation is the stapedial annular ligament (SAL), which suspends the stapes footplate in the oval window, and restricts the maximum displacement of the stapes (DStap) based upon the nonlinear elastic behavior of the ligament fibers (Gan et al., 2011). Early experiments in cadaveric human temporal bones suggested that the maximum displacement of the stapes footplate in response to static pressures was up to 100 μm (summarized by Luciani, 1917), with specific estimates of stapes excursions (in one direction) of 70 μm by Helmholtz and Politzer (Helmholtz, 1868; Politzer, 1864), 40 μm by Bezold (1880), and ~100 μm by von Békésy (Von Békésy, 1960). More recent results from rabbit and cat suggested a peak-to-peak displacement limit of only 30 μm (Guinan et al., 1967; Price, 1974; Yamamoto, 1953), which is the value used in a model of auditory hazard (the Auditory Hazard Assessment Algorithm for Humans (AHAAH), available for download from the Army Research Lab website) recently adopted in the DOD acquisition standard MIL-STD-1474E for estimating impulse noise exposure (AHAAH, 2015; Price, 2011; Price et al., 1991). A key insight from this model was that the SAL displacement limit acts to reduce low frequency energy transfer into the inner ear, thus a revised estimate of this limiting DStap in the human ear could have a substantial impact on the damage predictions of that model.
Recent work in cadaveric human temporal bones suggests that both DStap and intracochlear sound pressure (PIC) increase roughly linearly with sound pressure level in the ear canal (PEAC), as well as with one another, at moderate sound pressure levels (< 140 dB SPL), where DStap is not substantially limited by the characteristics of the ossicular chain (particularly the SAL; Nakajima et al., 2009). Above this level, the motion of the ossicular chain becomes non-linear and shows substantial harmonic distortion (including subharmonics) (Dallos et al., 1966; Guinan et al., 1967; Huang et al., 2012; Rosowski et al., 2007; Voss et al., 2000). It is unclear whether PIC remains linearly related to PEAC or to DStap at high sound pressure levels, particularly those where DStap shows saturation.
In order to begin to assess the responses of the human ear to acoustic blast, here we measure stapes velocity and intracochlear pressures in response to high level, low frequency sounds. In particular, we test the hypothesis that PIC varies linearly with DStap for sound pressure levels at which the SAL (or another component of the middle ear) limits DStap in cadaveric human temporal bones. Results provide the first estimates of the VStap and PIC acoustic transfer functions for low frequency (< 100 Hz) sounds for both (nearly) normal (i.e. levels at which little distortion is observed in ossicular chain motion), and very high (i.e. where substantial distortion is observed) sound pressure levels. Results go on to reveal the range of levels over which both DStap and PIC increase linearly with PEAC, as well as values towards which the responses asymptote. Furthermore, the results address the relationship between DStap and PIC, and reveal that this relationship, and thus cochlear input impedance (Zc), remains constant with increasing PEAC SPL (despite the nonlinear relationship with SPL itself). The implications for these results on auditory models, and injury prediction (i.e. the AHAAH model) are discussed.
2. MATERIALS AND METHODS
The use of cadaveric temporal bone tissue was in compliance with the University of Colorado Anschutz Medical Campus Institutional Biosafety Committee. Fifteen temporal bones with no history of middle ear disease (except presbycusis) were evaluated. Fresh-frozen hemi-cephalic specimens were obtained from cadavers undergoing autopsy with permission to use tissues and organs for research (Lone Tree Medical, Littleton, CO).
2.1. Temporal bone preparation
Prior to temporal bone preparation the specimens were thawed in warm water and the external ear canal and tympanic membrane were inspected for damage. The pinna and surrounding soft tissue were removed in order to improve access for the mastoidectomy. Similar to Tringali et al. (2010), temporal bones were prepared with a canal-wall-up mastoidectomy with extended facial recess, separated by a remaining buttress of bone, in order to visualize the body of the incus, the long-process of the incus, the stapes, and the round window, which were inspected to rule out damage and abnormalities. The facial canal was opened and the facial nerve removed immediately posterior to the oval and round windows to maximize exposure of the stapes and round window structures. The stapedius muscle and tendon were left intact. The round window was inspected and false membrane removed, if present. Finally, the cochlear promontory near the oval and round windows was thinned in preparation for pressure probe insertion.
The hemi-cephalic specimens were fastened to a flat plate affixed via a dual-axis goniometer stage (Thorlabs, Inc., Newton, NJ) to a steel base plate. The specimen was positioned so that the pressure probes would enter the cochlea nearly vertically to prevent air insertion into the cochlea. Cochleostomies were created under a droplet of water using a fine pick. Fiber-optic pressure sensors (FOP-M260-ENCAP, FISO Inc., Quebec, Canada) were inserted through the bony wall of the cochlea until just within the fluid (~100μm) of the scala vestibuli (SV) and scala tympani (ST) using micromanipulators mounted on a horizontal bar affixed to the base plate. Sensors were sealed to the cochlea with alginate dental impression material (Jeltrate). Velocity of the stapes was measured with a single-axis laser Doppler vibrometer (LDV; HLC-1000 & CLV-700; Polytec Inc., Irvine, CA) positioned with a joystick-controlled aiming prism (HLVMM2) mounted to a dissecting microscope (Carl Zeiss AG, Oberkochen, Germany) parallel to the microscope’s line of sight. The LDV was aimed at the stapes capitulum, and oriented at ~45° from the direction of the piston-like stapes motion. Microscopic (45–63 μm diameter) glass beads (P-RETRO-xxx, Polytec Inc., Irvine, CA) were placed on the stapes to ensure a strong LDV signal.
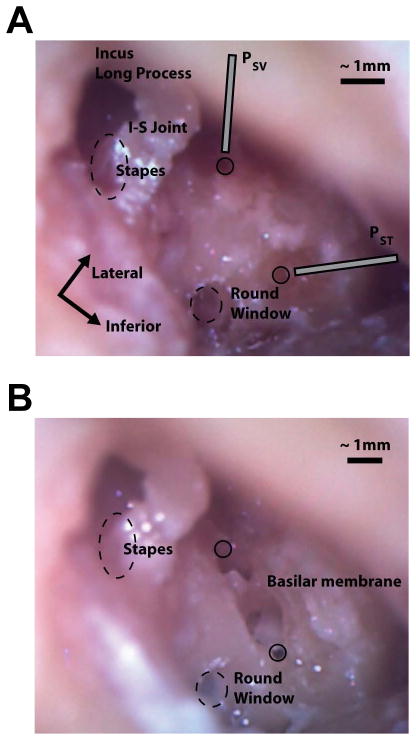
Following the conclusion of each experiment, the placement of both pressure probes was verified by carefully removing the bone between the two cochleostomies. The location and orientation of the basilar membrane was carefully assessed, and the compartment into which the probes projected was identified. Figure 1A shows an example preparation at the end of an experiment. Here, the pressure probes (PSV & PST) have been removed, but their approximate positions during the experiment are indicated, and the small circular openings into the scala vestibuli and scala tympani are visible. The same specimen is shown in Figure 1B following bone removal. The probe insertion locations are indicated by the black circles, and the basilar membrane is clearly evident between the two. Visible in both photos are the stapes and stapes tendon (both are covered in glass microbeads which were used to boost LDV reflectance), as well as the incus long process, incudo-stapedial (I/S) joint, and round window membrane. Dashed ovals show the approximate locations of the round window and oval window (obscured by the stapes/stapes tendon; note that ovals do not reflect the actual size of these structures).
Fig. 1.
Photomicrographs showing the placement of the intracochlear pressure probes in the scala vestibuli and scala tympani before (A), and after (B) removing the bone between the two cochleostomies in specimen 55R (right ear). Dashed circles indicate the approximate locations of the oval and round windows (not to scale); solid circles indicate the entry points of the pressure probes into the cochlea. Note the glass beads located on the stapes capitulum and stapedius muscle/tendon in A, and the location and orientation of the basilar membrane in B. Additional labels are located on the incus long process, incudostapedial (I-S) joint, stapes, round window, and basilar membrane, in addition to the approximate orientation of the pressure probes entering scala vestibuli (PSV) and scala tympani (PST).
2.2. Sound presentation
All experiments were performed in a double-walled sound-attenuating chamber (IAC Inc., Bronx, NY). Sounds were generated digitally and presented to the specimen with a ~30 cm subwoofer (Morel UW 1258) driven by a 300 W amplifier (Keiga KG5230), attached to a custom-built sound concentrating horn constructed of off-the-shelf PVC and copper components, their diameters tapering approximately exponentially from ~30 cm to ~1.25 cm over the course of ~12 m. The sound presentation system was coupled to the ear with a section of silicone tubing (11 mm OD) tapered on one end to fit within the ear canal, stabilized with cyanoacrylate adhesive, and sealed with Jeltrate. The sound pressure level in the external ear canal was measured with both a probe-tube microphone (type 4182, Brüel & Kjær, Nærum, Denmark) and a fiber-optic pressure probe (FOP-M-BA, FISO, Inc.), which were positioned approximately 1 cm from the tympanic membrane through small holes in the silicone tubing adapter, and sealed in place with Jeltrate. Note: the pressure probe was included because the microphone signal clips at levels above ~164 dB SPL. The frequency response of the sound delivery system was approximately flat from ~15 – 100 Hz, above which the level declined roughly linearly, decreasing by approximately 25 dB at 1 kHz. Stimuli were high level, low frequency tones, presented in 17 steps between 20 Hz – 5 kHz, with peak levels exceeding 170 dB SPL below 100 Hz (the highest level tone produced was 173.4 dB SPL at 80 Hz). Sounds were presented and data were collected with an external sound card (Hammerfall Multiface II, RME, Haimhausen Germany), sampled at 44100 Hz, and controlled by a custom-built program in Matlab (Mathworks, Natick, MA).
2.3. Data Collection and Analysis
All acquired signals were band-pass filtered between 10 Hz and 5 kHz with a 2nd order Butterworth filter for data analysis. Signals were recorded and averaged across ten repetitions of each stimulus condition. Responses were quantified through Fourier analysis, where the response is evaluated at the stimulus frequency. Spectra are calculated from the segment of the recording during which the stimulus was presented (adjusted for the acoustic transmission delay along the waveguide). Velocity and pressure transfer functions were calculated in a manner consistent with a method described in an established standard (ASTM, 2014). Briefly, measured values of stapes velocity (VStap), as well as scala vestibuli (PSV) and scala tympani (PST) sound pressures (in the frequency domain), are presented with respect to the sound pressure level in the external auditory canal (PEAC). Corresponding transfer functions (HStap, HSV, & HST) were computed from the responses of these measures to pure tone stimuli, using methods described previously (Devèze et al., 2013; Nakajima et al., 2009), e.g. equations 1–3:
| (1) |
| (2) |
| (3) |
Similarly, the differential intracochlear pressure transfer function was calculated as the complex difference between PSV and PST, normalized to the sound pressure level in the external auditory canal (Nakajima et al. 2009):
| (4) |
The magnitude of the stapes velocity was adjusted using a cosine correction (Chien et al. 2006) based on an estimate of the included angle between the stapes primary axis (i.e. the direction of piston-like motion) and the orientation of the LDV laser (typically ~45°). Displacement was calculated (in the time-domain) in Matlab using a trapezoidal approximation to the integral of the LDV velocity signal. Responses are only shown for frequencies at which the signal-to-noise ratio was greater than 10 dB, calculated by comparing measurements made immediately before and during sound presentation. Fiber optic pressure probes were factory calibrated, and the sensitivity verified by comparing sensor output normalized to the velocity (measured with the LDV) of a small cup of water driven by a Brüel & Kjær shaker (type 4810) across the range of frequencies tested at comparable magnitudes to those presented during experiments. Sensor output was stable both within and across experiments, and no drift in sensor output was noted.
The sound pressure levels recorded in the ear canal near the tympanic membrane for each set of measurements, for the nine specimens meeting inclusion criteria, are shown in Figure 2. Inclusion criteria included: similarity of HStap to the 95% CI range reported previously (Rosowski et al. 2007), where responses consistently above this range suggest increased mobility of the ossicular chain (possibly due to damage), and responses consistently below this range suggest reduced mobility (potentially resulting from ossicular fixation due to otosclerosis); similarity of HSV, HST, and particularly HDiff to the range of responses reported previously (Nakajima et al. 2009), where deviations (particularly low HDiff) suggest that pressure probe placement was incorrect; appropriate probe placement as verified via dissection (see above); lack of visible damage to the tympanic membrane or middle ear structures.
Fig. 2.
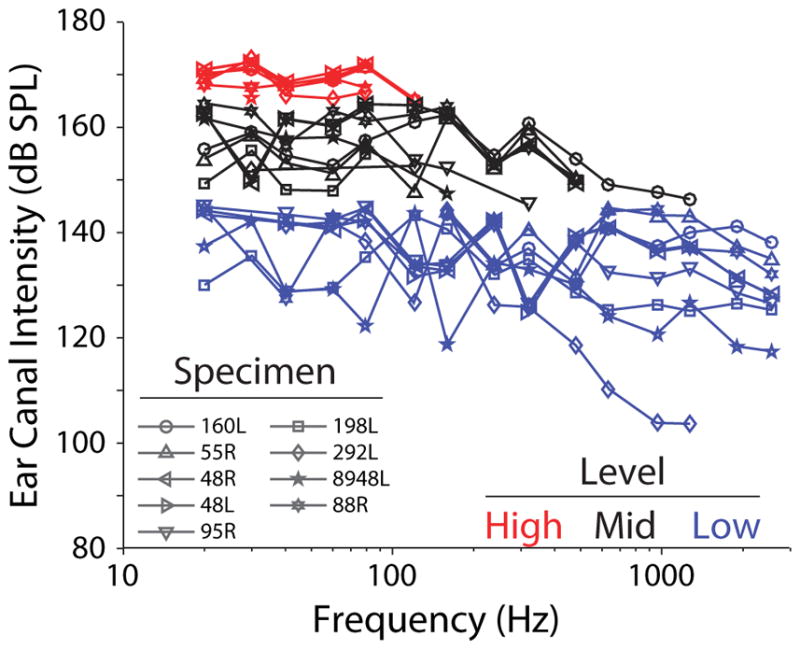
Sound pressure levels in the ear canal (PEAC) during recordings. Specimen number is indicated by marker symbol. Sets of recordings with roughly comparable levels are grouped by color and are analyzed independently in subsequent analyses (grouped as Low < 145 dB SPL, Mid ≥ 145 dB SPL & < 165 dB SPL, and High ≥ 165 dB SPL). Lines link the responses of individual specimens within each level group.
Sounds were digitally generated and attenuated down from the maximum in discrete attenuation steps (i.e. 30, 50 or 70 dB Attenuation, thus absolute SPL varied somewhat). The output of the loudspeaker system is biased towards low frequencies, thus low-frequencies (< 100 Hz) tended to show the highest levels at a given attenuation level. Analysis is performed based on the responses of each specimen to sound pressure levels grouped into three categories based on the sound pressure level of the sound stimulation at low (< 100 Hz) frequencies. In figures to follow, Low level measurements, i.e. the lowest levels presented to each specimen (< 145 dB SPL), are shown as blue lines, Mid level measurements (black) were those with sound presentation levels between 145 – 165 dB SPL, and High level measurements (red) were those above 165 dB SPL. Responses were recorded to ten repetitions of each stimulus, presented in order from low to high frequencies (one presentation of each frequency per repetition), and from low to high levels (completing all repetitions of each level before increasing). Reducing the attenuation further resulted in substantial harmonic distortion of the sound produced, and constant or decreasing sound pressure level in the ear canal at the stimulus frequency, thus the highest level assessed was close to 170 dB SPL in all specimens. In the following section, responses to stimuli at each of these three levels will be assessed in both the time and frequency domains.
3. RESULTS
Velocity of the stapes capitulum, as well as sound pressure in the scala vestibuli and scala tympani near the oval and round windows are presented for nine temporal bones during presentation of Low, Mid and High level, low frequency tones. Six additional specimens showed one or more transfer functions that deviated substantially from prior reports, thus were excluded from analysis. Two early specimens (160L, 55R) were not tested at all levels, thus do not appear in all figures. The following analyses are roughly grouped based on the sound pressure level in the EAC, as shown in Figure 2 (i.e. < 145 dB SPL for Low, ≥ 145 and < 165 dB SPL for Mid, and ≥ 165 dB SPL for High).
3.1. Responses in the time- and frequency-domains
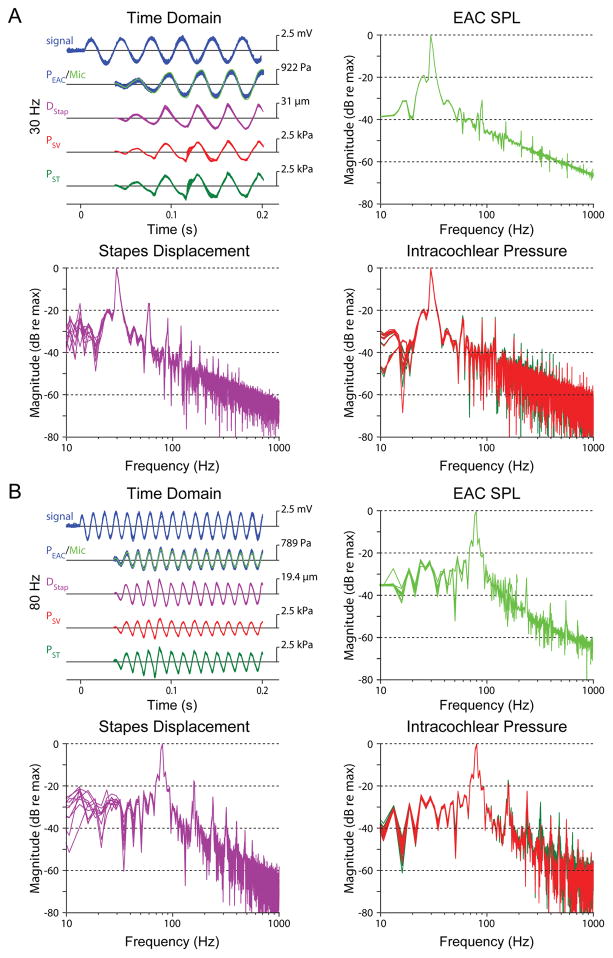
Figure 3 shows representative recordings from one example specimen (48L) in response to ten superposed repetitions of 30 Hz (Figure 3A) and 80 Hz (Figure 3B) tones at the Mid sound pressure level (~150 dB SPL, black markers in Figure 2). The signal sent to the loudspeaker amplifier is shown at the top left, followed by the superposed waveforms recorded from the microphone (green) and fiber-optic pressure probe (blue) in the ear canal near the TM (shown together to demonstrate the consistency across recording devices), the displacement of the stapes (DStap) from the LDV, and the scala vestibuli (PSV) and scala tympani (PST) sound pressures. Consistent with previous reports in human cadaver and small animals, motion of the stapes shows harmonic distortion (larger than is observed in the PEAC) at this level (Dallos et al., 1966; Guinan et al., 1967; Huang et al., 2012; Rosowski et al., 2007; Voss et al., 2000). This distortion is clearly visible at integer multiples of the fundamental frequency in the magnitudes of the frequency spectra (shown normalized to the maximum) at right (PEAC SPL) and below (left: DStap, right: PSV and PST), though all harmonics are >15 dB below the fundamental in all signals. The distortion observed in the intracochlear pressures (PSV & PST) reveals a second harmonic that is smaller than that observed in DStap at 30 Hz, but not 80 Hz, even though it is comparable between 30 Hz & 80 Hz. The DStap spectra reveals somewhat higher magnitude harmonics than either of the intracochlear pressures, which may be evidence of non-piston-like motion of the stapes (a feature that may be more prominent due to our measurement on the stapes head).
Fig. 3.
Examples of the stimulus waveform (signal, blue), sound pressure in the external auditory canal near the tympanic membrane recorded with a probe-tube microphone (Mic, light green), and a fiber optic pressure sensor (PEAC, blue) stapes displacement (DStap, violet), and intracochlear pressures measured in the scala vestibuli (PSV, red) and scala tympani (PST, green), recorded during ten presentation of a 30 Hz (A) and 80 Hz (B) tones presented at Mid (~150 dB SPL) sound pressure levels in specimen 48L. Each line represents the response recorded to a single stimulus presentation. The frequency spectrum of each signal is shown in panels not labeled “Time Domain” (at right and below), normalized to the amplitude at the stimulus frequency. For clarity, the output spectrum of the fiber optic pressure sensor in the EAC is not shown on the microphone panels.
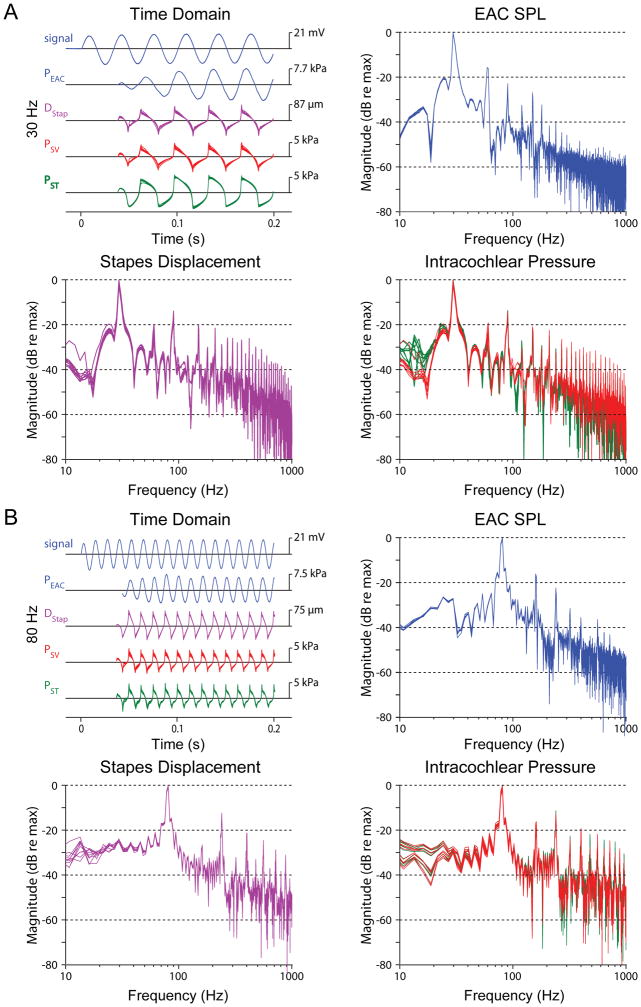
Figure 4 shows representative waveforms of 30 and 80 Hz tones presented at the High level (~168.5 dB SPL, red markers in Figure 2) for the same specimen as in Figure 3 (48L). In contrast to waveforms at the Mid SPLs, which closely resemble PEAC, High SPL response waveforms show substantial harmonic distortion that is of lower magnitude in the ear canal sound pressure waveform. Nevertheless, PSV and PST waveforms appear to remain consistent with one another, as well as with DStap. Interestingly, the even numbered harmonics (2f, 4f, etc.) are less prominent than the odd harmonics (3f, 5f, etc.) in DStap, PSV, and PST, consistent with the shape of the waveform, and are lower in magnitude relative to the fundamental in the stapes displacement than in the intracochlear pressure measurements. Although the second harmonic is visible in the response of the EAC pressure probe, it remains ~20 dB lower in magnitude than the fundamental frequency of the response. Also note that for High SPL conditions the ear canal microphone distorts, thus the EAC pressure probe is used rather than the microphone for these conditions, and the microphone signal is not shown.
Fig. 4.
Examples recordings during presentation of a 30 Hz (A) and 80 Hz (B) tone presented at High (~165 dB SPL) sound pressure levels. Data are presented in the same format, for the same specimen as Fig. 3 (48L). For clarity, responses from the EAC microphone are not shown since the signal clipped at high levels.
3.2. Sound pressure transfer functions
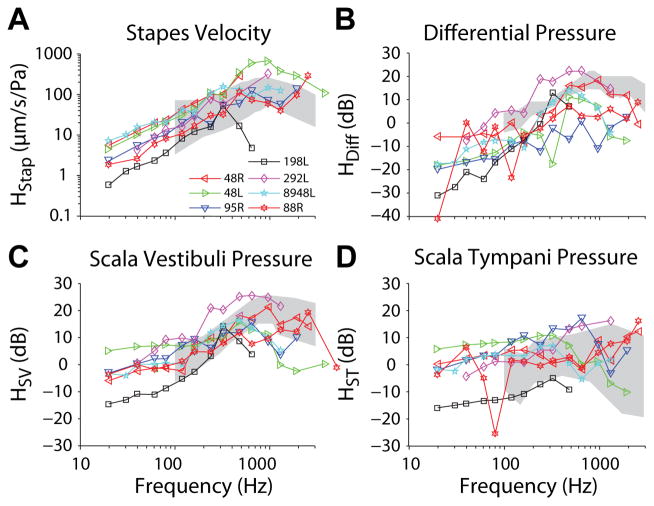
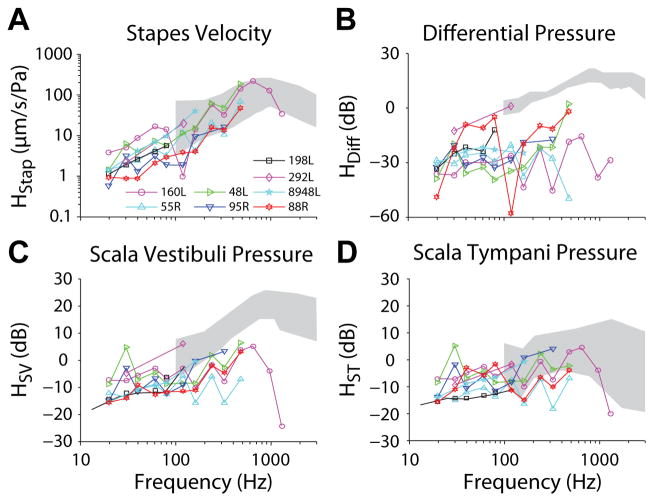
Stapes velocity (HStap), as well as scala vestibuli (HSV), scala tympani (HST), and the differential (HDiff = (PSV−PST)/PEAC) sound pressure transfer functions were computed as the ratio of each measure to the sound pressure level in the external auditory canal, PEAC. Figure 5 shows the mean HStap (A), HSV (C), HST (D), and HDiff (B) magnitude at Low levels for seven of the nine (excluding 160L and 55R) temporal bones that met inclusion criteria. Responses for each specimen were highly consistent across repetitions (± 1 standard deviation is smaller than the size of each marker), thus error bars are excluded from these plots. Recordings were stable over the course of the ten repetitions, and are shown superimposed on the 95% confidence intervals/range of responses from prior reports (gray shading; Rosowski et al., 2007 for panel A; Nakajima et al., 2009 for panels B–D). In general, transfer function magnitudes in all four responses rose with frequency towards a peak near 1 kHz, and showed lower responses to lower frequency tones. Interestingly, the difference between HSV and HST was smaller at lower (i.e. <100 Hz) than at higher frequencies, and in a minority of specimens the absolute magnitudes reversed at the lowest frequencies, showing somewhat higher peak sound pressures in the scala tympani than scala vestibuli (e.g. specimen 48R), similar to previous observations (Nakajima et al. 2009). Nevertheless, HDiff was generally consistent with the previous reports (Greene et al. 2015; Mattingly et al., 2015; Nakajima et al., 2009) in the range of frequencies tested previously.
Fig. 5.
(A) Stapes velocity (HStap), (B) differential (HDiff), (C) scala vestibuli (HSV) and (D) scala tympani (HST) sound pressure transfer function magnitudes recorded at the low level (< 145 dB SPL). Responses shown are the mean across ten repetitions for each specimen (indicated by marker symbol and line color), and correspond to blue lines and markers shown in Figure 2. Gray bands represent the 95% CI for stapes velocity from Rosowski et al. (2007), and the range of responses reported for intracochlear pressures by Nakajima et al. (2009).
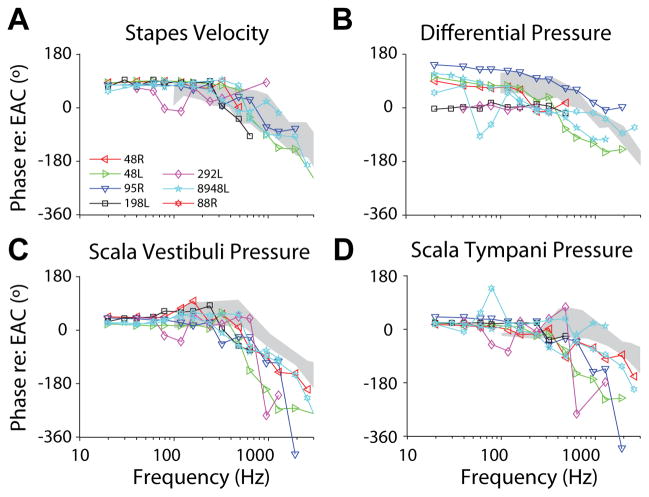
Figure 6 shows transfer function phase of each response at the Low level, i.e. the phase of each signal with respect to the sound pressure level in the ear canal (PEAC). Responses are superimposed on the 95% confidence intervals/range of responses from prior reports (Nakajima et al., 2009 for panels B–D; Rosowski et al., 2007 for panel A). HStap phase was stable at just under 90° with respect to the sound presentation for frequencies below approximately 200Hz, and declined with higher frequency stimulation. Likewise, HSV and HST phase were stable between 0–45° for low frequencies and declined with higher frequency tones. HDiff phase was somewhat more variable across specimens, but was generally ~90–180° at low frequencies that decreased at higher frequencies, consistent with prior reports (Nakajima et al. 2009).
Fig. 6.
(A) Stapes velocity (HStap), (B) differential (HDiff), (C) scala vestibuli (HSV) and (D) scala tympani (HST) sound pressure transfer function phases recorded at the Mid sound presentation level (~150 dB SPL). Responses shown are the mean across ten repetitions for each specimen (indicated by marker symbol and line color), and correspond to blue lines and markers shown in Figure 2. Gray bands represent the 95% CI for stapes velocity from Rosowski et al. (2007), and the range of responses reported for intracochlear pressures by Nakajima et al. (2009).
Transfer function magnitudes calculated for responses to the Mid SPLs are shown in Figure 7. Responses are once again superimposed onto the 95% CI range (gray bands) of responses observed previously (Nakajima et al., 2009 for panels B–D; Rosowski et al., 2007 for panel A). Transfer function magnitudes are not directly affected by the harmonic distortion observed in Figure 3, since the transfer function at each frequency is computed at the fundamental frequency only. All responses show somewhat reduced magnitudes compared to the Low stimulation level (Figure 5), particularly for low frequency tones – that is, stapes velocity and intracochlear pressure increase at a slower rate than EAC sound pressure level above 145 dB SPL. Transfer function phases (not shown) were comparable to those observed at Low levels (Figure 6).
Fig. 7.
(A) Stapes velocity (HStap), (B) differential (HDiff), (C) scala vestibuli (HSV) and (D) scala tympani (HST) sound pressure transfer function magnitudes recorded at Mid (< ~165 dB SPL) sound pressure levels. Responses shown are the mean across ten repetitions for each specimen (indicated by marker symbol and line color), and correspond to black lines and markers shown in Figure 2. Gray bands represent the 95% CI for stapes velocity from Rosowski et al. (2007), and the range of responses reported for intracochlear pressures by Nakajima et al. (2009).
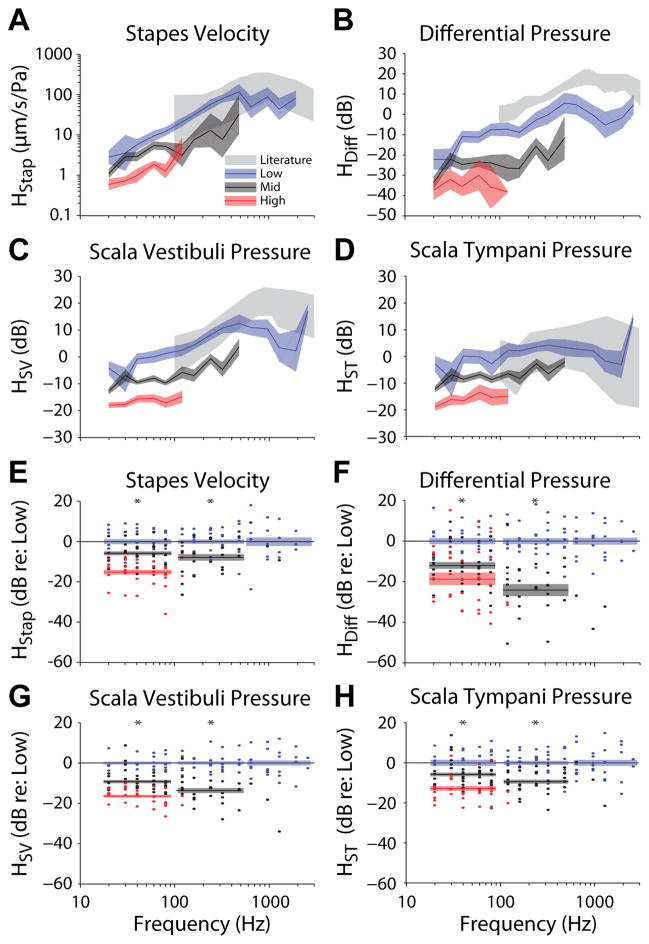
In order to explore this observed magnitude decrease with stimulus level further, the mean (±SEM) transfer function magnitudes (i.e. the mean of the log magnitudes) across the population of specimens are shown in Figure 8 for Low (blue), Mid (black), and High (red) SPL conditions. In general, transfer function magnitudes showed similar trends with frequency across levels, with magnitudes increasing with frequency up to the peak at 1kHz observed for Low level stimulation. However, the overall magnitude decreased with increasing stimulus level for all four measures.
Fig. 8.
Comparison of transfer function magnitudes across the three stimulus levels presented for (A) Stapes velocity (HStap), (B) differential (HDiff), (C) scala vestibuli (HSV) and (D) scala tympani (HST) pressures. Lines and colored areas represent the mean and SEM range, respectively, for TF magnitude across specimens. Gray bands represent the 95% CI for stapes velocity from Rosowski et al. (2007), and the range of responses reported for intracochlear pressures by Nakajima et al. (2009). Transfer function magnitudes are shown normalized to the mean Low response (in dB) at each frequency measured for (E) stapes velocity, (F) differential, (G) scala vestibuli and (H) scala tympani pressures. Dots indicate measurements from individual specimens, colored bars indicate the mean ± SEM of the normalized responses at each level (for frequencies < 100 Hz, > 100 Hz & < 500 Hz, and > 500 Hz), and asterisks indicate significance as assessed via 1-way ANOVA within each frequency band. Note, comparisons including High level responses (red) were only made within the lowest frequency band, and comparisons of Mid and Low levels were not computed at the highest frequency band.
To compare across frequency, the responses of individual specimen (dots) are shown as a function of frequency, relative to the mean response across specimens (in dB) observed at the Low level, in figures 8 E–H. The mean (±SEM) is shown for each measurement, for each stimulus level (indicated by color), in three frequency bands: < 100 Hz, > 100 Hz & < 500 Hz, and ≥ 500 Hz. High responses were only assessed at the lowest frequency band, and Mid responses were only assessed at the low and mid frequency bands, due to the small number of responses in the other band(s). The change in transfer function magnitudes across levels was assessed with a one-way ANOVA with EAC SPL group (i.e. Low, Mid, or High) as the independent, and transfer function magnitude as the dependent variables. For the sake of brevity, we only summarize the results of these statistical comparisons here: the ANOVA indicated significant (Bonferroni corrected) main effects for all four measures (F2,92 > 17, p ≪ 0.001), for both low and mid frequency bands (indicated with an asterisk), and post hoc testing with a Tukey’s HSD test reveals that each level group is significantly different from one another in each case. These reductions in transfer function magnitudes suggest that the amplitude of the signal spectrum at the fundamental frequency does not increase linearly with stimulus level at Mid and High SPLs. This reduction is consistent with a limitation of the response at high EAC sound pressure levels, and was suggested by the harmonic distortion observed in Figure 4. The frequency and level dependence of this effect will be explored further in the next section.
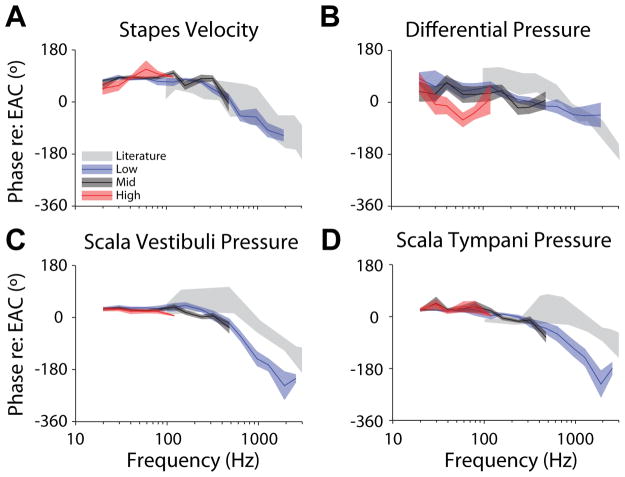
Figure 9 similarly shows the mean (±SEM) transfer function phases calculated for the Low, Mid, and High SPL conditions. Likewise, statistical analysis (1-way ANOVA) was performed on the phases normalized to the Low response. Transfer function phases were largely unaffected by the level for low frequencies (i.e. < 100 Hz; F2,92 < 3, p > 0.05), except in HDiff (F2,92 = 7.1, p = 0.0014), which shows a shift in mean from ~ +45° for Low and Mid, and ~ −45° for High SPL stimulation. At higher frequencies, phase is highly consistent at Mid and Low levels, and may decrease more rapidly with increasing frequency than has been reported in a prior report (Nakajima et al. 2009; gray bands), potentially suggesting longer group delays than previously reported (which could result from either methodological differences, or a level dependent effect). Note, the frequencies sampled here were relatively sparse, thus unwrapping errors are likely, and limiting the interpretation of these results.
Fig. 9.
Comparison of transfer function phases (relative to PEAC SPL) across the three stimulus levels presented for (A) stapes velocity, as well as (B) differential, (C) scala vestibuli and (D) scala tympani sound pressures. Lines and colored areas represent the mean and ±SEM range, respectively, for TF phase across specimens. Gray bands represent the 95% CI for stapes velocity from Rosowski et al. (2007), and the range of responses reported for intracochlear pressures by Nakajima et al. (2009).
3.3. Linearity of Stapes Displacement and Scala Vestibuli Pressure with SPL
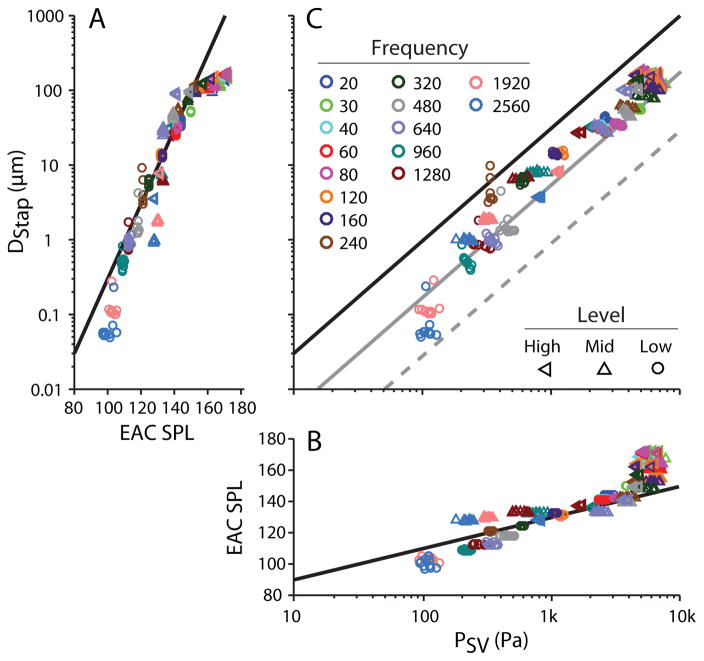
In the following sections, we focus our analysis on the responses of stapes displacement (DStap) and scala vestibule pressure (PSV) directly to assess the linearity of the input to the cochlea at high sound pressure levels. Figure 10A shows the peak-to-peak DStap amplitude, measured in each trial recorded in one specimen (48L), as a function of sound presentation level (recorded level in dB SPL on the abscissa, level groups from Figure 2 are indicated with markers). Responses are shown for all three stimulus levels Low (●), Mid (△), and High (▷). Responses are superimposed over an arbitrarily drawn 20 dB/decade line indicating a linear relationship (Guinan and Peake 1967). Similarly to those previous results in the cat, DStap increased proportionally with sound pressure level up to ~150 dB SPL, above which displacement deviates from the 20 dB/decade line (towards higher EAC SPLs for a given DStap). Note this analysis is complicated by the aggregation of responses recorded at multiple frequencies. In particular, responses below 1 kHz can be reasonably well fit with a single line, since the ratio of DStap to PEAC is reasonably similar; however, the higher frequency responses would be better fit by a line with a somewhat lower y-intercept.
Fig. 10.
Peak-to-peak stapes displacement (DStap) (A) and scala vestibuli pressure (PSV) (B) as compared to PEAC SPL, and to one another (C), for the same specimen as in Figs. 3 & 6 (48L), across the three levels tested (identified by marker shape), separated by frequency (in Hz, identified by marker color). Markers represent the response to a single stimulus presentation, and all repetitions for a given stimulus are shown. Diagonal lines represent: in A: (DStap), an arbitrary 20 dB per decade line; in B: (PSV), an arbitrary 20 dB per decade line; and in C: the diagonals in A & B transferred onto these axes (black), as well as this line shifted towards higher pressures by 10 (gray solid) and 20 dB (gray dashed).
Intracochlear sound pressure level was similarly assessed by plotting the peak-to-peak PSV amplitude as a function of PEAC SPL (with the axes transposed) in Figure 10B. Responses are shown for the same conditions as for the displacement measurements presented at left, and are shown superimposed on an arbitrarily drawn 20 dB/decade line. PSV rises linearly with increasing PEAC SPL up to ~150 dB SPL, above which PSV deviates from the 20 dB/decade line (towards higher PEAC SPLs for a given PSV), similar to DStap. As in Figure 10A, the observed growth with SPL is complicated by the frequency dependence of the middle-ear gain and cochlear input impedance, which may explain the observed deviations from the straight line at lower levels.
The relationship between DStap and PSV is assessed in Figure 10C. Straight lines are drawn at locations corresponding to the straight lines in the left and bottom plots (black), as well as at 10 dB (gray) and 20 dB (dashed gray) higher PSV for reference. PSV consistently increased with DStap, with the responses generally falling along a single straight line across the range of displacements/pressures observed. In particular, while both DStap and PSV show a departure from proportionality at ear canal sound pressure levels above ~150 dB SPL, this nonlinearity appears comparable in magnitude in the two measures, thus the relationship between DStap and PSV remains consistent even at the highest levels tested (High, < symbols). Once again, the deviations from this straight line likely indicate the frequency dependence of the relationship between DStap and PSV.
3.4. On The Relationship between Stapes Displacement, Scala Vestibuli Pressure and SPL
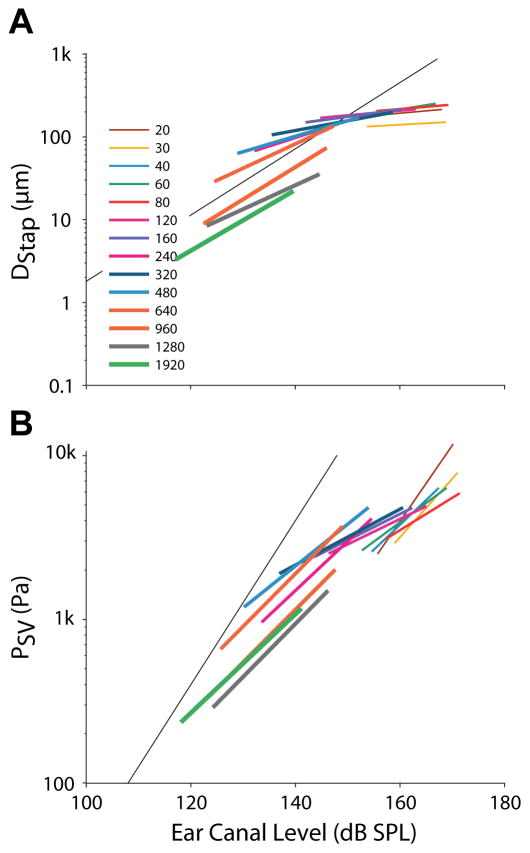
The above plots of DStap and PSV reveal a general trend away from proportionality with PEAC SPL for levels greater than ~150 dB SPL. In order to further explore this dependence on level, the peak-to-peak DStap and PSV from one specimen (160L) are shown as a function of PEAC SPL in Figures 11A & B, respectively. Here, lines connect the mean responses (standard deviation is smaller than the broader line widths) assessed at the two high highest SPLs tested for each frequency, where both color and line width indicate stimulus frequency. The black lines are the same 20 dB per decade lines shown in Fig 10A–B. As observed in Fig. 10, the responses observed in Figure 11 show substantial frequency dependence (particularly PSV). Nevertheless, two main points can be assessed from these plots (and are described in the following paragraphs): the maximum responses (DStap and PSV) observed, and an estimate for the SPL at which these responses saturate.
Fig. 11.
Mean of (A) DStap, and (B) PSV, for each frequency presented, as a function of PEAC SPL for one specimen, 160L. Frequency is represented by both color and line thickness. Responses are shown for the two lowest levels presented at each frequency (independent of the level classification outlined in Fig. 2). Diagonal lines are the same arbitrary 20 dB per decade lines as in Fig. 10.
First, since both DStap and PSV saturate at high PEAC SPLs, the asymptote of each response can be predicted based upon the maximum observed stimulus magnitude (not shown). Mean DStap maximum (± standard deviation), at any frequency or level, across the nine specimens was 133.0 ± 36.3 μm, which is substantially higher than prior estimates from small animals (e.g. ~ 20 μm in the cat: Guinan et al., 1967; ~30 μm in rabbit: Yamamoto, 1953). Mean PSV maximum was more variable across the nine specimens tested at 12.16 ± 9.03 kPa, and generally did not approach a clearly defined asymptote. It is unclear whether no asymptote was observed because EAC SPLs were not sufficiently high to reach saturation, or whether maximum pressures may continue to rise with increasing PEAC SPL. It is likely, however, that the observed PSV responses are more susceptible to variability due to the greater frequency dependence. Note that higher frequency responses tended to show lower amplitudes than low frequency responses at a given SPL, thus the maximum values reported here may not hold for higher frequencies.
Second, the PEAC SPLs at which DStap and PSV saturate cannot be measured at all frequencies here due to the low response of our loudspeaker above a few hundred Hz; however, they can be estimated by assessing the rate of change in response amplitude with level, since we assume these responses should rise linearly with SPL for low levels, but should saturate and show no increase at higher levels. The responses of each specimen were sampled relatively sparsely in level, thus a direct measurement of the asymptote value for each frequency is not possible. An estimate of the level at which these responses asymptote was calculated for each specimen by comparing the slopes of the response at each frequency to the expected slopes (20 dB/dec.) shown in Figure 10A–B. Of note, this analysis assumes frequency independence over the range of frequencies tested (i.e. that each frequency will produce a similar DStap and PSV for a given PEAC SPL). Qualitatively, the slopes of these straight lines for DStap and PSV shown in figure 11 are comparable to the 20 dB per decade lines from Figure 10A–B for PEAC SPLs < ~150 dB SPL, and, consistent with a response asymptote, DStap line slopes approached zero when either level was above ~150 dB SPL. PSV slopes are more variable, with responses that appear to decrease towards zero at higher PEAC SPLs, revealing the frequency dependence of this measure.
4. DISCUSSION
Recent technological advances have allowed direct measurement of intracochlear pressure in response to sound stimulation in intact human temporal bones (Greene et al. 2015; Mattingly et al., 2015; Nakajima et al., 2009; Olson, 1998; Olson, 1999). In this report we set out to characterize ossicular motion and intracochlear pressure in response to low frequency and high level sound stimulation, with particular focus on identifying nonlinearities. These data provide insight into the relationship between stapes motion and intracochlear pressure, as well as the relationship between each of these measures and PEAC, and provide experimental validation of the assumptions and predictions of an acoustic hazard model.
4.1. Low-frequency response characterization
Previous measures of stapes velocity and intracochlear sound pressure responses were recorded at intermediate sound frequencies (i.e. 100 Hz to 10 kHz) due to equipment and measurement limitations, and since those frequencies tend to contain the majority of the information from speech and other behaviorally relevant stimuli (Nakajima et al., 2009; Rosowski et al., 2007). The ability of our sound presentation system to generate high level sounds with substantial energy below 100 Hz allows us to establish, for the first time, a baseline for responses at these very low-frequency sounds. Additionally, many impulsive and blast waveforms recorded in the free-field have energy concentrated at low frequencies (Reed, 1977).
Velocity and pressure transfer functions (HStap, HSV, and HST) were generally in agreement with previous reports for frequencies above 100 Hz (Nakajima et al., 2009; Rosowski et al., 2007). A trend of VStap and PSV toward lower gain (re: PEAC) with decreasing frequency is visible in prior measurements (Nakajima et al., 2009), and appears to continue along the same trajectory for frequencies below 100 Hz. Values of HSV, which typically peak near 1 kHz (e.g. Figure 5) fall off at low frequencies to the point that HST appears similar to, or shows higher gain than HSV (re: PEAC) in some specimens below 100 Hz. A similar reversal of relative intracochlear pressures at frequencies below 400 Hz was observed in one specimen and described in Nakajima et al. (see Figure 2 ear 039; 2009), and the cause remains unclear. Additionally, harmonic distortion was observed in the motion of the stapes in, cats and cadaveric humans, for Mid and High level stimuli (Guinan et al., 1967; Rosowski et al., 2007; Voss et al., 2000), and peaks in HStap and HSV are clearly evident for frequencies around 1 kHz, in addition to a 10–20 dB difference between HSV and HST in this frequency range (Nakajima et al., 2009; Rosowski et al., 2007). The similarity in scala vestibuli and scala tympani sound pressures in many specimens, however, may suggest the presence of a substantial bone-conducted component of the sound transmission to the inner ear, resulting from shaking of the sound booth/table/specimen mount and cadaver specimen by the sound source, particularly at the lowest frequencies. Nevertheless, the data recorded at the lowest levels tested here are generally consistent with prior reports, and extend baseline measurements of stapes velocity, and intracochlear pressures to the low-frequency limit of human hearing (generally considered to be ~20 Hz), albeit for high sound pressure levels (~130 dB SPL).
4.2. The relationship between intracochlear pressure and stapes displacement
The relationship between intracochlear pressure and ossicular motion has not been thoroughly examined at the high levels and low frequencies assessed in this report, but since the stapes footplate provides the input to the scala vestibuli via the oval window, and since the two show similar dependence on sound pressure level in the ear canal at moderate levels, it is natural to assume a direct, positively correlated relationship between the two. No direct comparison of DStap and PSV has been reported, but indirect evidence is found in the reports of Nakajima et al. (2009), who reported a linear relationship between PIC and PEAC for tones presented between 80–130 dB SPL, and Aibara et al. (2001) who reported VStap for sound presentation between 60–120 dB SPL with no mention of level effects. Since both VStap and PSV are apparently linearly related with PEAC in these reports (Nakajima et al., 2009), one can thus assume that the two are linearly related in the range of sound pressure levels tested (60–130 dB SPL).
As a way to compare DStap and PSV, prior reports have presented the cochlear input impedance, defined as: ZC = PSV/(VStap * AFP), where AFP is the area of the stapes footplate, which is typically assumed to be 3.2 mm2 (Nakajima et al., 2009; Von Békésy, 1960). Those prior studies report ZC that is relatively flat across frequency in the range of 10–100 GΩ, and which is consistent across the range of stimulus levels tested (although level dependence does not appear to have been thoroughly assessed in these reports). Figure 12 shows the mean (± SEM) ZC (assuming AFP = 3.2 mm2) across the population of specimens included in the current study, at the low, mid, and high level stimulation presentations. Responses are superimposed onto lines representing the mean responses observed in three prior reports (Merchant et al., 1996; Nakajima et al., 2009; Aibara et al. 2001). Results are assessed in the similar manner as the transfer functions in figures 8 & 9 (i.e. normalizing ZC to the mean ZC at the Low stimulus level, and assessing ZC in the frequency bands < 100 Hz, and ≥ 100 Hz & < 500 Hz). Overall, low frequency (< 1 kHz) responses are consistent with these prior reports, while higher frequencies deviate towards lower ZC (possibly related to the poor response of our loudspeaker system at these levels). One-way ANOVAs reveal that there is no significant change in ZC in either the low or mid frequency bands across level. Note, while ZC appears generally level independent, it shows substantial frequency dependence, which may underlie the lack of a clear saturation point in PSV with increasing EAC SPL as shown in Fig. 10–11. Assessment of individual frequencies with level should thus reveal a clear saturation point in PSV, but is not possible with this data set due to the sparse level sampling. Nevertheless, the similarity between these impedances and those prior reports suggests that the proposed relationship between DStap and PSV is consistent even at levels at which substantial distortion from a saturating nonlinearity appears in both responses.
Fig. 12.
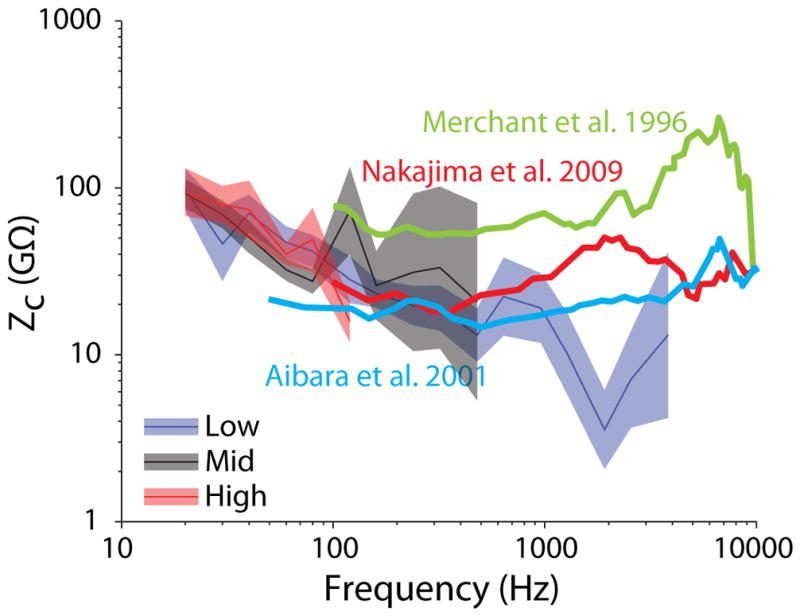
Mean (±SEM) cochlear input impedance (ZC = PSV/(VStap * AStap)) as a function of frequency for the three level bands tested (blue: Low; black: Mid; red: High). Responses are superimposed onto the mean ZC from three prior reports (heavy lines in blue: Aibara et al. 2001, green: Merchant et al. 1996, and red: Nakajima et al. 2009).
Distortion in both VStap and PSV signals arises for high level stimulation in the form of harmonic distortion, as observed in Figures 3 and 4. Substantial amplitude is observed at integer multiples of the fundamental frequency, with more prominent odd- than even-numbered harmonics. Additionally, a fairly robust peak is observed at 15 Hz (1/2 the fundamental) in DStap that is not as prominent in PEAC in Fig. 3A, the magnitudes of subharmonic peaks were generally low (<−20 dB re: max).
Subharmonic distortion is a well characterized feature of middle mammalian middle ear responses. It has been observed in EAC SPL measurements for loud tonal stimulation (> 140 dB SPL in humans, 95 dB SPL in guinea pigs) (von Gierke 1950), is perceived by humans for 140 dB SPL tone presentation (Eldredge 1951), and has been reported in intracochlear pressure measurements in gerbils (Huang et al. 2012). This distortion is hypothesized to originate from asymmetric stiffness in the tympanic membrane (Pong and Marcaccio 1963), and not an active middle ear process, as subharmonics were observed in pig temporal bones (Usanov et al. 2007). No substantial subharmonic distortion is observed in these low frequency responses, thus these results suggest that the generation of subharmonics is a largely high-frequency phenomenon. One possible source of these distortions may be the emergence of stapes rocking motion (or other similar ossicular nonlinearity) at high frequencies, though additional data are necessary to clarify this relationship.
4.3. Comparisons to an acoustic hazard model
The AHAAH (Auditory Hazard Assessment Algorithm for Humans) model explicitly models each component of the acoustic transmission chain into the cochlea with equivalent electrical components. The results presented in this report confirm that intracochlear sound pressure is directly proportional to stapes displacement for high (i.e. up to ~170 dB SPL) sound levels; however, PSV did not form a clear saturation point due to its frequency dependence. Recording responses at higher levels, or with finer level sampling, may clarify the relationship with PEAC, although the relationship with DStap (which did appear to saturate) appears reasonably level independent (i.e. the cochlear input impedance, ZC). These results suggest that the assumption of level independence is appropriate for sound transmission from the middle- into the inner-ear for these sound levels, but needs validation at higher levels.
Our data reveal a substantial difference between the maximum peak-to-peak DStap predicted by the model, and that observed in cadaveric human temporal bones. Maximum peak-to-peak stapes displacement simulated in the AHAAH model was set to a value of 40 μm based upon measurements made in cat and rabbit (Guinan et al., 1967; Price, 1974; Yamamoto, 1953). This value is substantially lower than has been reported by several investigators in cadaveric human specimens when applying a static pressure to the oval window (Bezold, 1880; Helmholtz, 1868; Politzer, 1864; Von Békésy, 1960). Similarly, a more recent investigation of the mechanical properties of the stapedial annular ligament reported force-displacement curves consistent with a maximum (one direction) displacement of approximately 100 μm (Gan et al., 2011). The current results suggest that the stapes can displace more than 150 μm peak-to-peak at very high sound pressure levels, consistent with both the recent Gan (2011) data and the older excursion data recorded in cadaveric human tissue. The AHAAH model, which assumes an order of magnitude smaller displacement limit (~20 μm one direction, derived from cat data: Guinan et al., 1967), therefore, appears to underestimate the sound pressure transferred to the cochlea, thus likely underestimates the injury caused by a loud sound exposure. Future work is required to modify the model to better predict this sound propagation, and better determine the frequency dependence of these effects (since these results are primarily low-frequency).
4.4. Limitations to the current study
Several issues limit the broad applicability of this study. First, due to the high levels of the sound presented, some tissue degradation may be expected to occur during the course of these experiments. In order to minimize the effects of this damage, we presented stimuli in order from low to high levels, and repeated measurements after the first set of measurements in some specimens; however, the repeatability of these measurements were not verified at the conclusion of the experiments, thus the effects of tissue damage may contribute to the responses presented. Second, stimulus level was set by setting a fixed attenuation level, rather than by calibrating the acoustical system and setting a target SPL, thus the level varied considerably with frequency. We have grouped responses across frequency into SPLs as closely as possible, but variability and limitations in the acoustical system at high frequencies limit our analysis. Third, the sound delivery system used in this study is driven by a 12″ subwoofer that is capable of producing high levels at low frequencies, but becomes inefficient and increasingly distorted for higher frequencies. This is likely the cause of the substantial deviation in calculated cochlear input impedance (Figure 12) near 2 kHz. Fourth, stapes motion as reported in this study is taken from a one-dimensional velocity measurement at one point on the stapes. In consequence, stapedial velocity and quantities derived from it, including stapes displacement, cochlear volume velocity, and cochlear impedance, are derived from this single-point measurement. This simplification omits two aspects of ossicular mechanics which may, when introduced, significantly alter our conclusions.
First, a number of studies have shown that three-dimensional stapedial motion is quite complex, combining simple pistonic motion with rocking motion in more than one dimension, and that the relative magnitudes of these components vary greatly over the normal range of auditory frequencies and sound levels, for this reason, single-point measurement may fail to capture some ossicular dynamics important to the relationship between stapes velocity and intracochlear pressure. Of note, studies of the three-dimensional stapedial motion (for example, Hato et al. 2003, Sim et al. 2010) have found that the rocking component becomes substantially more important at higher frequencies; for this reason, we feel that the single-point approximation is reasonable at lower frequencies. Nevertheless, this study was intended to explore stapedial velocities and intracochlear pressures for frequencies below, and sound pressure levels above, those typically measured. For exactly this reason, the possibility cannot be excluded that three-dimensional stapes motion at these frequencies and sound pressure levels differs significantly from motion within the normal range, affecting our conclusions for the reasons discussed above.
Second, our analysis treats the apparent limitation of stapedial motion as a consequence of nonlinear stiffness that increases with displacement in the stapedial annular ligament. It is also possible that compliance in the incudomalleolar joint contributes significantly to a reduction in stapedial motion, and that this compliance may itself be nonlinear, taking up some displacement that might otherwise be transmitted to the cochlear fluid at high sound pressure levels (Hüttenbrink 1988, Lauxmann et al. 2012). One recent report (Gerig et al. 2015) finds that IM joint mobility is not a major contributor to ossicular chain compliance at frequencies below 2 kHz. We do not discount the possible contribution of the IM joint (or other components of the ossicular chain) to the nonlinearity observed in this study, but believe it to be of secondary importance at very low frequencies.
5. CONCLUSIONS
The current results generally agree with the results from prior reports suggesting that the relationship between PSV and DStap is consistent across levels both below and above which harmonic distortion appears in ossicular chain motion due to a saturating nonlinearity. While not thoroughly assessed in this manuscript, PST and PDiff both decrease significantly with PEAC SPL in a similar fashion as PSV (e.g. Fig. 8), thus we expect these measures to show similar relationships with PEAC and DStap as PSV. Overall, these results suggest that the AHAAH model should accurately predict acoustic injury for sounds below this level. However, peak-to-peak DStap (~150 μm; Figs. 10–11) is substantially larger than predicted by this model (~40 μm), suggesting that the model substantially underestimates the sound pressure level in the cochlea during high level sound exposure thus the model must be revised prior to use as a health hazard assessment tool. Finally, these results extend our knowledge of the responses (i.e. HStap/SV/ST/Diff) of healthy temporal bones to high sound pressure levels (up to ~170 dB SPL), well above the level that produces nonlinear stapes displacement, as well as provides normative baseline (< 145 dB SPL) data for low frequencies down to the low frequency limit of human hearing (~20 Hz; Fig. 3).
Highlights.
Low frequency stapes velocity and intracochlear pressure described in human cadaver
Stapes displacement increases linearly with sound level up to ~150 dB SPL.
Peak-to-peak DStap asymptotes at ~150 μm in humans, not ~30μm as in cat/rabbit.
Cochlear input impedance remains constant up to ~170 dB SPL at low frequencies.
Acknowledgments
Funding for these experiments was provided by DOD grants W81XWH1020112 and W81XWH-15-2-0002 and NIH NIDCD T32 DC012280 (NTG). We appreciate the assistance of Dr. Michael Hall in constructing some of the custom experimental equipment (support by NIH grant P30 NS041854). We thank the section editor and two anonymous reviewers whose comments and suggestions helped improve and clarify this manuscript.
References
- Aibara R, Welsh JT, Puria S, Goode RL. Human middle-ear sound transfer function and cochlear input impedance. Hear Res. 2001;152(1–2):100–9. doi: 10.1016/s0378-5955(00)00240-9. [DOI] [PubMed] [Google Scholar]
- Auditory Hazard Assessment Algorithm for Humans (AHAAH) [Online] http://www.arl.army.mil/www/default.cfm?page=343 (posted September 24, 2015; verified January 15, 2016)
- ASTM. Standard Practice for Describing System Output of Implantable Middle Ear Hearing Devices. West Conshohocken, PA: 2014. ASTM Standard F2504-05(2014) [Google Scholar]
- Bezold Exp. Unt. Über den Schallleitungsapparat des menschlichen Ohres. Arch r Ohrenheilk. 1880;16:1–50. [Google Scholar]
- Chandler DW, Edmond CV. Effects of blast overpressure on the ear: case reports. Journal of the American Academy of Audiology. 1997:8. [PubMed] [Google Scholar]
- Chien W, Ravicz ME, Merchant SN, Rosowski JJ. The effect of methodological differences in the measurement of stapes motion in live and cadaver ears. Audiology and Neurotology. 2006;11(3):183–197. doi: 10.1159/000091815. [DOI] [PMC free article] [PubMed] [Google Scholar]
- Dallos PJ, Linnell CO. Even-Order Subharmonics in the Peripheral Auditory System. The Journal of the Acoustical Society of America. 1966;40:561–564. doi: 10.1121/1.1910119. [DOI] [PubMed] [Google Scholar]
- Devèze A, Koka K, Tringali S, Jenkins HA, Tollin DJ. Techniques to Improve the Efficiency of a Middle Ear Implant: Effect of Different Methods of Coupling to the Ossicular Chain. Otology & Neurotology. 2013;34:158–166. doi: 10.1097/MAO.0b013e3182785261. [DOI] [PubMed] [Google Scholar]
- Eldredge DH. Some responses of the ear to high frequency sound. Am Soc Exp Biol Fed Proc A. 1951;9:37. [Google Scholar]
- Fausti SA, Wilmington DJ, Gallun FJ, Myers PJ, Henry JA. Auditory and vestibular dysfunction associated with blast-related traumatic brain injury. The Journal of Rehabilitation Research and Development. 2009;46:797. doi: 10.1682/jrrd.2008.09.0118. [DOI] [PubMed] [Google Scholar]
- Gan RZ, Yang F, Zhang X, Nakmali D. Mechanical properties of stapedial annular ligament. Medical engineering & physics. 2011;33:330–9. doi: 10.1016/j.medengphy.2010.10.022. [DOI] [PMC free article] [PubMed] [Google Scholar]
- Gee KL, Neilsen TB, Downing JM, James MM, McKinley RL, McKinley RC, Wall AT. Near-field shock formation in noise propagation from a high-power jet aircraft. J Acoust Soc Am. 2013;133:EL88–93. doi: 10.1121/1.4773225. [DOI] [PubMed] [Google Scholar]
- Gerig R, Ihrle S, Röösli C, Dalbert A, Dobrev I, Pfiffner F, Eiber A, Huber AM, Sim JH. Contribution of the incudo-malleolar joint to middle-ear sound transmission. Hear Res. 2015;327:218–26. doi: 10.1016/j.heares.2015.07.011. [DOI] [PubMed] [Google Scholar]
- Greene NT, Mattingly JK, Jenkins HA, Tollin DJ, Easter JR, Cass SP. Cochlear Implant Electrode Effect on Sound Energy Transfer Within the Cochlea During Acoustic Stimulation. Otology & Neurotology. 2015;36(9):1554–1561. doi: 10.1097/MAO.0000000000000838. [DOI] [PMC free article] [PubMed] [Google Scholar]
- Guinan JJ, Jr, Peake WT. Middle-ear characteristics of anesthetized cats. J Acoust Soc Am. 1967;41:1237–61. doi: 10.1121/1.1910465. [DOI] [PubMed] [Google Scholar]
- Hato N, Stenfelt S, Goode RL. Three-dimensional stapes footplate motion in human temporal bones. Audiol Neurootol. 2003;8(3):140–52. doi: 10.1159/000069475. [DOI] [PubMed] [Google Scholar]
- Helmholtz H. Die Mechanik der Gehorknb’chelchen und des Trommelfells. Pfiugers Archiv Ges Physiol. 1868;1:1–60. [Google Scholar]
- Huang S, Dong W, Olson ES. Subharmonic Distortion in Ear Canal Pressure and Intracochlear Pressure and Motion. Journal of the Association for Research in Otolaryngology. 2012;13:461–471. doi: 10.1007/s10162-012-0326-3. [DOI] [PMC free article] [PubMed] [Google Scholar]
- Hüttenbrink K-B. The mechanics of the middle-ear at static air pressures: the role of the ossicular joints, the function of the middle-ear muscles and the behaviour of stapedial prostheses. Acta Otolaryngol Suppl. 1988;451:1Y35. doi: 10.3109/00016488809099007. [DOI] [PubMed] [Google Scholar]
- Lauxmann M, Heckeler C, Beutner D, Lüers JC, Hüttenbrink KB, Chatzimichalis M, Huber A, Eiber A. Experimental study on admissible forces at the incudomalleolar joint. Otol Neurotol. 2012 Aug;33(6):1077–84. doi: 10.1097/MAO.0b013e318259b34b. [DOI] [PubMed] [Google Scholar]
- Leibovici D, Gofrit ON, Shapira SC. Eardrum perforation in explosion survivors: is it a marker of pulmonary blast injury? Ann Emerg Med. 1999;34:168–72. doi: 10.1016/s0196-0644(99)70225-8. [DOI] [PubMed] [Google Scholar]
- Luciani L. Human Physiology: The sense organs. Macmillan and Company; 1917. [Google Scholar]
- Mattingly JK, Greene NT, Jenkins HA, Tollin DJ, Easter JR, Cass SP. Effects of Skin Thickness on Cochlear Input Signal Using Transcutaneous Bone Conduction Implants. Otol Neurotol. 2015;36(8):1403–1411. doi: 10.1097/MAO.0000000000000814. [DOI] [PMC free article] [PubMed] [Google Scholar]
- Mayo A, Kluger Y. Blast-induced injury of air-containing organs. ADF Health. 2006;7:40–44. [Google Scholar]
- Mayorga MA. The pathology of primary blast overpressure injury. Toxicology. 1997;121:17–28. doi: 10.1016/s0300-483x(97)03652-4. [DOI] [PubMed] [Google Scholar]
- Merchant SN, Ravicz ME, Rosowski JJ. Acoustic input impedance of the stapes and cochlea in human temporal bones. Hear Res. 1996;97:30–45. [PubMed] [Google Scholar]
- Nakajima HH, Dong W, Olson ES, Merchant SN, Ravicz ME, Rosowski JJ. Differential intracochlear sound pressure measurements in normal human temporal bones. J Assoc Res Otolaryngol. 2009;10:23–36. doi: 10.1007/s10162-008-0150-y. [DOI] [PMC free article] [PubMed] [Google Scholar]
- Olson ES. Observing middle and inner ear mechanics with novel intracochlear pressure sensors. J Acoust Soc Am. 1998;103:3445–63. doi: 10.1121/1.423083. [DOI] [PubMed] [Google Scholar]
- Olson ES. Direct measurement of intra-cochlear pressure waves. Nature. 1999;402:526–529. doi: 10.1038/990092. [DOI] [PubMed] [Google Scholar]
- Patterson JH, Jr, Hamernik RP. Blast overpressure induced structural and functional changes in the auditory system. Toxicology. 1997;121:29–40. doi: 10.1016/s0300-483x(97)03653-6. [DOI] [PubMed] [Google Scholar]
- Politzer A. Untersuchungen über Schallfortpflanzung und Schallleitung im Gehörorgane im gesunden und kranken Zustande. Arch f Ohrenheilk. 1864;1:59–73. [Google Scholar]
- Pong W, Marcaccio W. Nonlinearity of the middle ear as a possible source of subharmonics. J Acoust Soc Am. 1963;35(5):679–681. [Google Scholar]
- Price GR. Upper limit to stapes displacement: implications for hearing loss. J Acoust Soc Am. 1974;56:195–9. doi: 10.1121/1.1903253. [DOI] [PubMed] [Google Scholar]
- Price GR. DTIC Document. 2011. The auditory hazard assessment algorithm for humans (AHAAH): Hazard Evaluation of Intense Sounds. [Google Scholar]
- Price GR, Kalb JT. Insights into hazard from intense impulses from a mathematical model of the ear. J Acoust Soc Am. 1991;90:219–27. doi: 10.1121/1.401291. [DOI] [PubMed] [Google Scholar]
- Rao KN, Misra DN, Kelly RH, Shinozuka H. Alterations in glycoproteins and lipids in azaserine-induced acinar cell carcinoma of rat pancreas. Cancer Lett. 1980;10:19–26. doi: 10.1016/0304-3835(80)90060-9. [DOI] [PubMed] [Google Scholar]
- Reed JW. Atmospheric attenuation of explosion waves. J Acoust Soc Am. 1977;61:39–47. [Google Scholar]
- Rosowski JJ, Chien W, Ravicz ME, Merchant SN. Testing a method for quantifying the output of implantable middle ear hearing devices. Audiol Neurootol. 2007;12:265–76. doi: 10.1159/000101474. [DOI] [PMC free article] [PubMed] [Google Scholar]
- Sexton S. Effects of Explosions on the Ear. Science. 1887;9:343–7. doi: 10.1126/science.ns-9.218S.343. [DOI] [PubMed] [Google Scholar]
- Sim JH, Lauxmann M, Chatzimichalis M, Röösli C, Eiber A, Huber AM. Errors in measurement of three-dimensional motions of the stapes using a laser Doppler vibrometer system. Hear Res. 2010 Dec 1;270(1–2):4–14. doi: 10.1016/j.heares.2010.08.009. Epub 2010 Aug 27. Erratum in: Hear Res. 2011 Jul;277(1–2):227. [DOI] [PubMed] [Google Scholar]
- Tringali S, Koka K, Deveze A, Holland NJ, Jenkins HA, Tollin DJ. Round window membrane implantation with an active middle ear implant: a study of the effects on the performance of round window exposure and transducer tip diameter in human cadaveric temporal bones. Audiol Neurootol. 2010;15:291–302. doi: 10.1159/000283006. [DOI] [PMC free article] [PubMed] [Google Scholar]
- Usanov DA, Mareev OV, Mareev GO, Kamyshanskiĭ AS. Acoustic pressure induced period-doubling bifurcations in tympanic membrane oscillations. Technical Physics Letters. 2007;33(11):939–940. [Google Scholar]
- Von Békésy G. Experiments in hearing. McGraw-Hill; New York: 1960. [Google Scholar]
- von Gierke HE. Subharmonics generated in human and animal ears by intense sound. The Journal of the Acoustical Society of America. 1950;22(5):675. [Google Scholar]
- Voss SE, Rosowski JJ, Merchant SN, Peake WT. Acoustic responses of the human middle ear. Hear Res. 2000;150:43–69. doi: 10.1016/s0378-5955(00)00177-5. [DOI] [PubMed] [Google Scholar]
- Yamamoto S. Supplement to the Physiology of Conduction Apparatus of Rabbits The Maximum Value of the Movement of the Stapedial Basis. Hiroshima J Med Sci. 1953;12:259–273. [Google Scholar]


