Early detection strategies for pancreatic ductal adenocarcinoma are needed. This article describes a high‐sensitivity platform for detection of epithelial cells shed from preneoplastic lesions at a high risk of becoming malignant and a combination of technologies that could be used for early detection of disease in high‐risk patients.
Keywords: Pancreatic cancer, Circulating epithelial cells, Early detection
Abstract
Background.
Recent work has demonstrated early shedding of circulating epithelial cells (CECs) from premalignant intraductal papillary mucinous neoplasms (IPMNs). However, the potential use of CECs as a “liquid biopsy” for patients with IPMNs has been limited by antigen dependence of CEC isolation devices and the lack of robust detection biomarkers across CEC phenotypes.
Materials and Methods.
We utilized a negative depletion microfluidic platform to purify CECs from contaminating leukocytes and coupled this platform with immunofluorescence, RNA in situ hybridization, and RNA sequencing (RNA‐seq) detection and enumeration.
Results.
Using established protein (EpCAM, cytokeratins) and novel noncoding RNA (HSATII, cytokeratins) biomarkers, we detected CECs in 88% of patients bearing IPMN lesions. RNA‐seq analysis for MUC genes confirm the likely origin of these CECs from pancreatic lesions.
Conclusion.
Our findings increase the sensitivity of detection of these cells and therefore could have clinical implications for cancer risk stratification.
Implications for Practice.
This work describes a high‐sensitivity platform for detection of epithelial cells shed from preneoplastic lesions at high risk of malignant transformation. Further research efforts are underway to define the transcriptional programs that might allow discrimination between circulating cells released from tumors that will become malignant and cells released from tumors that will not. After further refinement, this combination of technologies could be deployed for monitoring and early detection of patients at high risk for developing new or recurrent pancreatic malignancies.
Introduction
Pancreatic ductal adenocarcinoma (PDAC) is the deadliest adult malignancy, and it is projected to become the second leading cause of cancer death in the United States by the year 2030 [1]. If caught early enough and successfully resected, there can be a 30% chance of survival at 5 years [2]. Therefore, there remains a clear need for sensitive early detection strategies. Circulating tumor cells (CTCs) are enriched for putative metastatic precursors and can be isolated from the blood and characterized using a variety of methods [3]. Notably, CTCs can be detected even when the disease is clinically localized, i.e., prior to the detection of clinical metastases [4]. This suggests that, although CTCs can emerge early, not all CTCs successfully complete all requisite steps in the metastatic cascade [5]. Similarly, circulating epithelial cells (CECs) can be detected in mice bearing preneoplastic pancreas lesions [6]. Recently, the release of CECs from mucinous premalignant pancreatic lesions has been detected in up to 33% of patients [7]. Thus, CECs emerge early during tumorigenesis, and only after malignant transformation do these CECs become bona fide CTCs. Hence, the detection and analysis of CECs represents an extraordinary opportunity to interrogate malignant potential arising from preneoplastic lesions through a “liquid biopsy.”
We chose to focus on patients with intraductal papillary mucinous neoplasms (IPMNs), the most prevalent cystic lesion of the pancreas with highly variable risk of progression to PDAC [8]. Although early studies have shown promise for CECs to be used for risk stratification, they still lack sufficient detection sensitivity in patients with IPMNs. This is at least partially due to the limitations of positive‐capture CEC devices that employ specific antigen‐bound (e.g., EpCAM‐bound) antibodies on microfluidic surfaces, because this approach assumes accurate prior knowledge of the appropriate surface antigen(s) and robust expression on all CECs/CTCs. It is likely that not all CECs express sufficient EpCAM for capture, and pancreatic mouse models predict that CECs downregulate EpCAM during the process of epithelial‐mesenchymal transition (EMT) for hematogenous dissemination [6].
To overcome these limitations, we developed an antigen‐agnostic circulating cell capture device—the CTC‐iChip—which utilizes a negative selection approach to remove hematopoietic cells and purify CECs [9]. This platform has been used to isolate mouse pancreatic CTCs bearing a spectrum of epithelial and mesenchymal features [10], many of which had little EpCAM expression based on single‐cell RNA sequencing.
Another major limitation in the field is the inability to identify CECs with a positive marker. Classically, antibody‐based immunofluorescent staining (IF) for pan‐cytokeratin has been used to detect CECs, but pan‐cytokeratin can be downregulated during EMT and staining artifacts can preclude accurate CEC enumeration. In the pursuit of identifying novel cancer biomarkers, we identified the aberrant expression of noncoding HSATII satellite RNA in pancreatic cancer and preneoplastic pancreatic intraepithelial neoplasia lesions in mice and humans [11]. Given the high expression of this marker in preneoplastic lesions, we proposed to use this assay to improve the sensitivity of detecting CECs from IPMN patients. In addition, prior work with RNA sequencing (RNA‐seq) in CTCs [10], [12] has revealed the ability to detect additional RNA markers that can improve the specificity of the CEC assay for pancreatic lesions.
In this work, we coupled the unique negative‐selection microfluidic iChip platform with IF, RNA in situ hybridization (ISH), and RNA‐seq analytics to increase the sensitivity and specificity of this assay with the least possible detection bias. We combined standard IF EpCAM and cytokeratin (CK) stains with novel HSATII and cytokeratin RNA transcript detection by ISH to enhance the sensitivity of CEC detection and enumeration from IPMN and PDAC patients. Comprehensive RNA‐seq of CECs was performed to identify RNA markers that enhance the specificity of IPMN and PDAC detection (MUC genes). Altogether, this combined analytical approach provides the foundation for the next‐generation pancreatic CEC platform that can be translated to the clinical realm.
Materials and Methods
Study Enrollment
All clinical studies were approved by the Massachusetts General Hospital (protocol 2013P002434) and Dana‐Farber/Harvard Cancer Center (protocol 14‐218) Institutional Review Boards. Patients were consented and then enrolled prior to blood draws. Upon enrollment, study investigators collected medical data from the patient's electronic medical record with patient permission. Disease‐free control patients were similarly consented and enrolled. A maximum of 20 mL of blood was obtained from patients at any given blood draw in two 10‐mL EDTA tubes, and approximately 8–10 mL of blood were processed per patient.
Purification of CECs from Whole Blood Using the CTC‐iChip
Prior to running blood through the CTC‐iChip, blood was analyzed by a cell blood count machine to determine total white blood cell (WBC) count. Biotinylated primary antibodies against anti‐human CD45 antibody (clone no. 2D1, BAM1430; R&D Systems, Minneapolis, MN, http://www.rndsystems.com) and anti‐human CD66b antibody (80H3; Bio‐Rad Laboratories [formerly AbD Serotec], Hercules, CA, http://www.bio-rad-antibodies.com) were spiked into whole blood at 100 femtograms per WBC (fg/WBC) and 37.5 fg/WBC, respectively, and incubated rocking at room temperature for 20 minutes. Dynabeads MyOne Strepavidin T1 (65602; Thermo Fisher Scientific, Waltham, MA, http://thermofisher.com) magnetic beads were then added and incubated, rocking at room temperature, for an additional 20 minutes.
After whole‐blood CTC‐iChip processing, the product containing enriched cells was fixed with 4% paraformaldehyde and an aliquot was stained with fluorescently labeled antibodies targeting epithelial antigens (CK8/18‐AF488, CK19‐AF488, EpCAM‐AF555; Janssen, Beerse, Belgium, http://www.janssen.com), leukocyte antigens (CD16‐AF647, CD45‐AF647, CD66b‐AF647; BioLegend, San Diego, CA, http://www.biolegend.com), and DAPI (5 μg/mL; Thermo Fisher). Slides were mounted using ProLong Gold Antifade Reagent (Thermo Fisher). Fixed and stained cells were imaged by fluorescence microscopy (TiE or Eclipse 90i; Nikon Instruments, Melville, NY, http://www.nikoninstruments.com) using the appropriate filter cubes for image acquisition and the BioView platform (BioView, Billerica, MA, http://bioview.com) for automated image analysis. All candidate CTCs detected were reviewed and scored based on intact morphology, colocalization of CTC markers with DAPI nuclear counterstain, and absence of leukocyte markers.
A second aliquot was processed for RNA in situ hybridization (RNA‐ISH) using fluorescent probes directed against HSATII and keratin. ISH was performed according to the Affymetrix ViewRNA ISH Cell Assay (Thermo Fisher). Briefly, cells were fixed in 4% formaldehyde for 30 minutes at room temperature, permeabilized by pretreating in buffer solution for 5 minutes at room temperature, and digested with protease for 10 minutes. Target probe sets were applied and hybridized to the cells by incubating for 3 hours at 40°C. Probes were used at a dilution of 1:50 for Type 1 HSATII and 1:50 for Type 6 keratin 7, 8, 18, and 19 (Affymetrix; Thermo Fisher). Signal was amplified through the sequential hybridization of PreAmplifier and Amplifier mixes to the target probe set, and target RNA molecules were detected by applying Label Probe Mix (Thermo Fisher). Cells were then counterstained with DAPI (5 μg/ml; Thermo Fisher) and slides were mounted using ProLong Gold Antifade Reagent (Thermo Fisher). Fluorescence microscopy using a Nikon 90i was used to visualize target mRNA transcripts. Type 1 probes were detected in the Cy3 channel and Type 6 probes in the Cy5 channel. Merged images were generated using NISElements software (Nikon). Colocalization analysis of HSATII and DAPI was performed using Zen software on 10 single cells (×63 magnification) imaged by LSM 710 Confocal Microscope (ZEISS, Oberkochen, Germany, http://www.zeiss.com). A Manders overlap coefficient R ≥ 0.6 indicates signal colocalization. In some patients, due to technical (sample processing) issues, either IF or ISH data were unable to be collected. For the CEC data analysis, only the data from those patients for whom both immunofluorescence and ISH were satisfactorily performed were used in our summary statistics. Counts were normalized as CECs per mL of whole blood.
A third aliquot was pelleted and flash frozen in RNAlater (Thermo Fisher) at −80°C. RNA was extracted (RNEasy Micro; Qiagen, Hilden, Germany, http://www.qiagen.com) and processed as follows for RNA‐seq. Amplified cDNA was generated from RNA from each sample using the SMARTer Ultra Low Input RNA Kit for Sequencing (version 3 or 4; Clontech Laboratories, Mountain View, CA, http://www.clontech.com) according to the manufacturer's protocol. Briefly, 1 μL of a 1:50,000 dilution of ERCC RNA Spike‐In Mix (Thermo Fisher [formerly Life Technologies]) was added to each sample. First‐strand synthesis of RNA molecules was performed using the poly‐dT‐based 3’‐SMART CDS primer II A (Clontech) followed by extension and template switching by the reverse transcriptase. The second strand synthesis and amplification polymerase chain reaction (PCR) was run for 18 cycles, and the amplified cDNA was purified with a 1× Agencourt AMPure XP bead cleanup (Beckman Coulter, Brea, CA, http://www.beckmancoulter.com). The Nextera XT DNA Library Preparation kit (Illumina, San Diego, CA, http://www.illumina.com) was used for sample barcoding and fragmentation according to the manufacturer's protocol. One nanogram of amplified cDNA was used for the enzymatic tagmentation, followed by 12 cycles of amplification and unique dual‐index barcoding of individual libraries. PCR product was purified with a 1.8× Agencourt AMPure XP bead cleanup (Beckman Coulter). The eluted cDNA libraries did not undergo the bead‐based library normalization step in the Nextera XT protocol. Library validation and quantification was performed by quantitative PCR using the KAPA SYBR FAST Universal quantitative polymerase chain reaction (qPCR) Kit (Kapa Biosystems, Wilmington, MA, http://www.kapabiosystems.com). The individual libraries were pooled at equal concentrations, and the pool concentration was determined using the KAPA SYBR FAST Universal qPCR Kit. The pool of libraries was subsequently sequenced in three replicates on a HiSeq 2500 (Illumina) in Rapid Run Mode using a 2 × 100 base pair kit and a dual flow cell. The paired‐end reads from the three sequencing runs were combined and aligned to the hg38 genome from the University of California, Santa Cruz (http://genome.ucsc.edu) using the STAR version 2.4.0h aligner with default settings (Alex Dobin, https://github.com/alexdobin/STAR). Reads that did not map or mapped to multiple locations were discarded. Duplicate reads were marked using the MarkDuplicates tool in picard‐tools‐1.8.4 (Broad Institute, broadinstitute.github.io/picard) and were removed. The uniquely aligned reads were counted using htseq‐count in the intersection‐strict mode against the Homo_sapiens.GRCh38.79.gtf annotation table from Ensembl (Hinxton, Cambridge, United Kingdom, www.ensembl.org). Data were then imported into the R statistical programming language for analysis and heat map generation (median‐normalized log 10‐tranformed reads per million plus 1 to allow for log transformation). All RNA‐seq raw data has been submitted to National Center for Biotechnology Information Gene Expression Omnibus (NCBI GEO).
IPMN Tissue RNA‐ISH Staining
IPMN tissue was stained by ISH under a Massachusetts General Hospital Institutional Review Board‐approved protocol (2013P001854). Tissue ISH on tissue microarrays was performed in a similar fashion as described above for cells, using the Affymetrix ViewRNA ISH tissue assay (Thermo Fisher), which uses alkaline phosphatase to produce a red substrate for brightfield imaging of histologic tissue specimens, which were stained with antibodies against CD8 or CD163 (Leica Biosystems, clones 4B11 and 10D6, respectively) and counterstained with hematoxylin using standard protocols.
Statistical Analysis
Analyses were performed using the GraphPad Prism package (GraphPad Software, La Jolla, CA, http://www.graphpad.com) and the R statistical computing environment. A Kruskal‐Wallis test followed by Mann‐Whitney tests were used for the nonparametric CEC datasets, and t tests corrected for multiple comparisons were used for log‐transformed data. p < .05 with a two‐tailed comparison was considered statistically significant.
Results
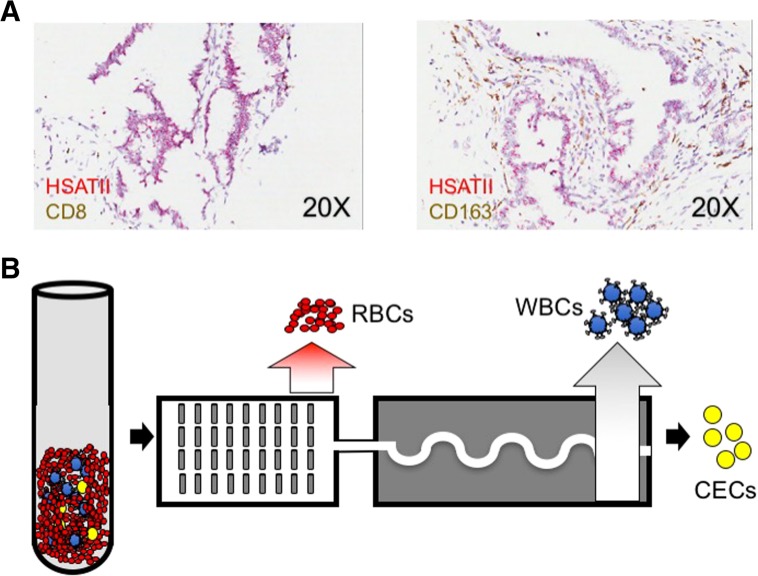
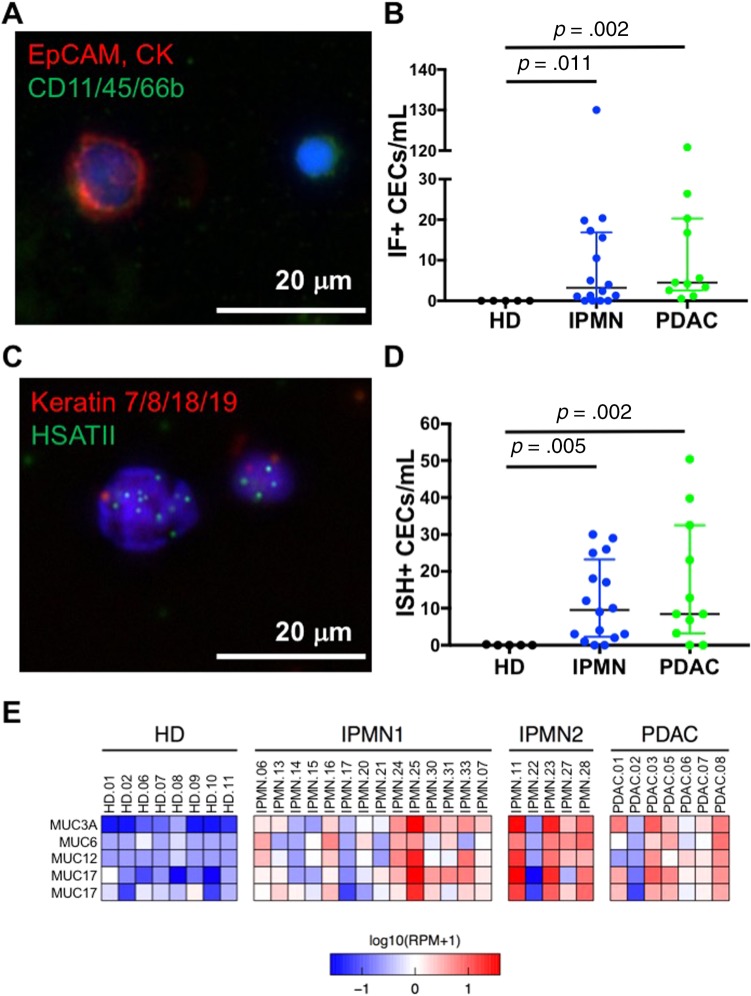
Using RNA‐ISH on resected IPMN tissue microarray samples, we found that all IPMN lesions were strongly positive for HSATII, illustrating its utility as a novel marker of CECs released from IPMNs (Fig. 1A). We therefore hypothesized that the combined antigen‐agnostic cell isolation platform and the use of the HSATII biomarker would significantly improve CEC detection from patients with IPMNs. We performed a pilot study, with prospective participant enrollment in an institutional review board‐approved study, utilizing specimens collected from 3 cohorts: (a) subjects without any known pancreatic lesion or any malignancy (healthy donor [HD], n = 11), (b) patients with endoscopic ultrasound fine needle aspiration‐documented IPMNs (n = 20), and (c) patients with biopsy‐proven PDAC (n = 8) at various stages of management (Tables 1, 2, 3. Patients in the IPMN cohort were further stratified using a consensus combination of clinical variables into low‐ and high‐risk [13]. The IPMN lesions themselves were characterized using cytology, biochemical composition, detection of KRAS or GNAS mutations in the cyst fluid [14], and endoscopic ultrasound imaging characteristics. Approximately 10 mL of whole blood were processed from each patient using the CTC‐iChip platform (Fig. 1B). Captured cells were then either processed for IF staining for epithelial markers (CK8/18/19, EpCAM) and leukocyte markers (CD16/45/66b) as a negative control (Fig. 2A) or processed for RNA‐ISH against keratins (KRT7/8/18/19) and HSATII (Fig. 2C).
Figure 1.
Experimental rationale and schema. (A): Representative RNA in situ hybridization images of resected primary intraductal papillary mucinous neoplasm specimens showing HSATII expression (red) and control immune cell IHC markers (CD8 left, CD163 right; both brown). (B): Schematic of workflow used for CEC isolation and enumeration. Erythrocytes and platelets are first separated by hydrodynamic sorting; then magnetic separation of bead‐bound leukocytes takes place after passage through curved channels to orient the nucleated cells in a single‐file line. Erythrocytes are shown in red, leukocytes coated with magnetic beads in blue, and circulating epithelial cells in yellow.
Abbreviations: CEC, circulating epithelial cell; RBC, red blood cell; WBC, white blood cell.
Table 1. Characteristics and laboratory findings of patients with IPMN.
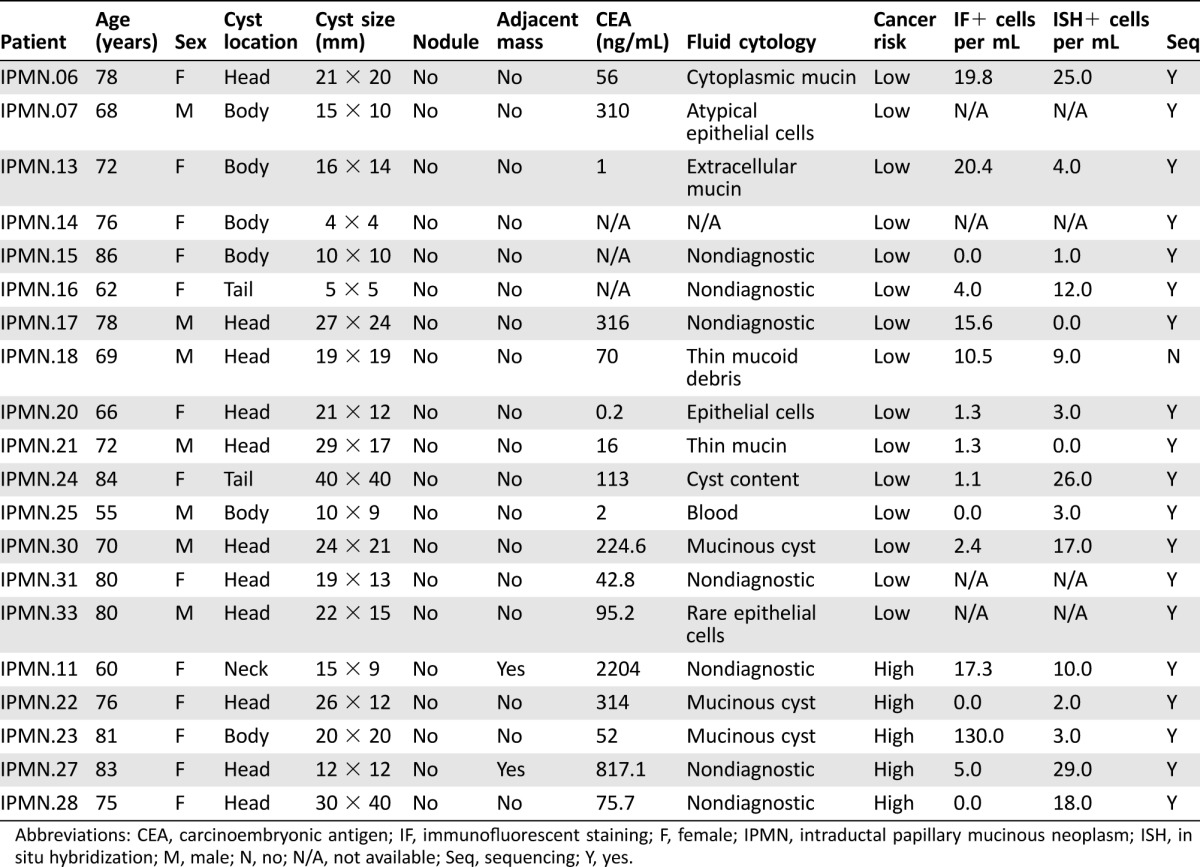
Abbreviations: CEA, carcinoembryonic antigen; IF, immunofluorescent staining; F, female; IPMN, intraductal papillary mucinous neoplasm; ISH, in situ hybridization; M, male; N, no; N/A, not available; Seq, sequencing; Y, yes.
Table 2. Clinical characteristics and laboratory findings of PDAC patients.
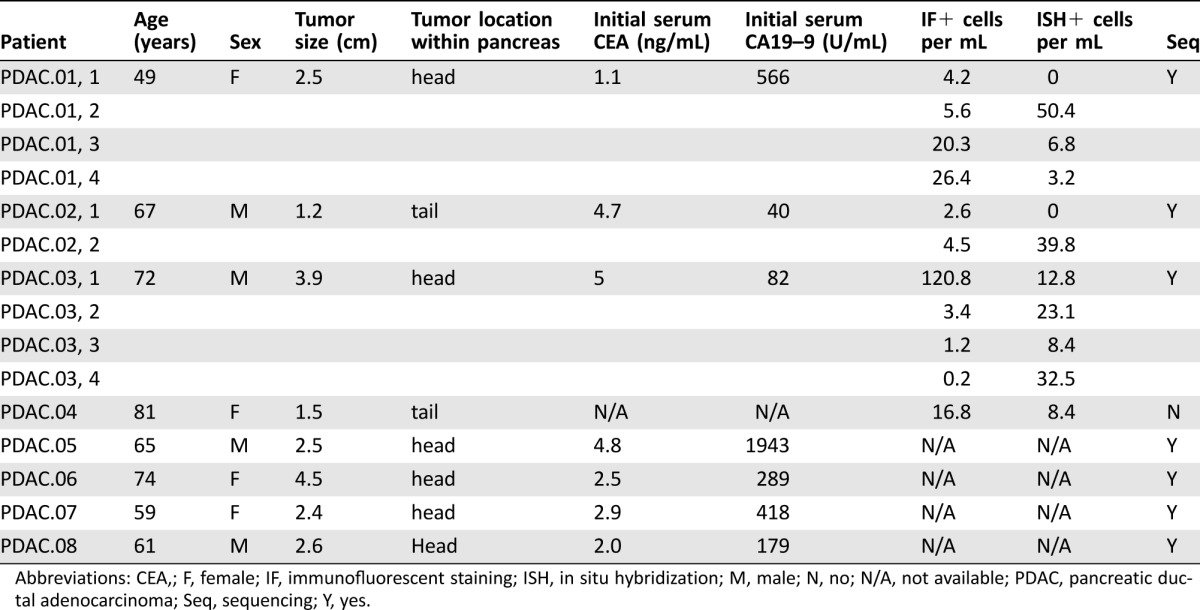
Abbreviations: CEA,; F, female; IF, immunofluorescent staining; ISH, in situ hybridization; M, male; N, no; N/A, not available; PDAC, pancreatic ductal adenocarcinoma; Seq, sequencing; Y, yes.
Table 3. Demographic data and laboratory findings for healthy donors.
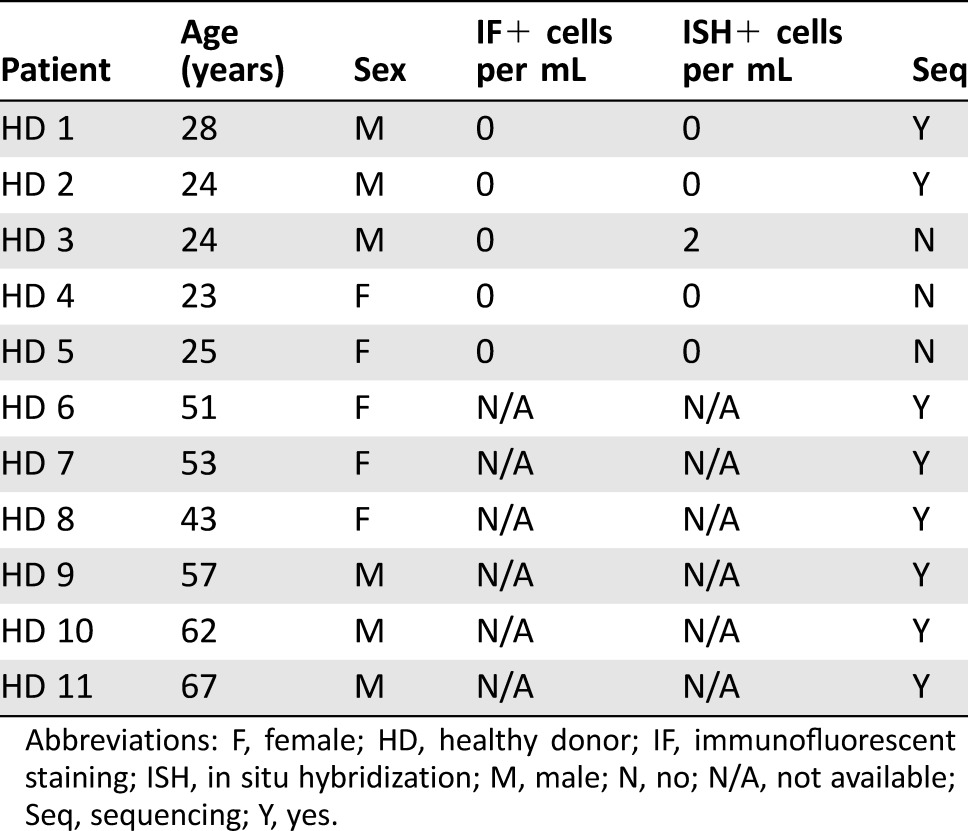
Abbreviations: F, female; HD, healthy donor; IF, immunofluorescent staining; ISH, in situ hybridization; M, male; N, no; N/A, not available; Seq, sequencing; Y, yes.
Figure 2.
Detection of CECs in patient whole blood using the circulating tumor cell iChip followed by a combination of immunofluorescent cell staining, in situ hybridization (ISH), and RNA sequencing. (A): Representative immunofluorescent image of a CK+/EpCAM+/CD45− CEC and a leukocyte. (B): Quantification of CECs per mL detected using IF. (C): Representative RNA‐ISH image of a HSATII+/keratin+ CEC. (D): Quantification of CECs per mL detected using RNA‐ISH. p values are reported for a two‐tailed nonparametric Mann‐Whitney test, and the box plot shows data quartiles (25%, median, 75%). (E): Heat map showing expression of differentially expressed mucin genes (p < .05) expressed at high levels in CECs isolated from patients with IPMNs and PDACs but not in cells isolated from HDs. IPMN1 denotes low risk and IPMN2 denotes high risk for pancreatic cancer development. Expression in log10 scale is shown.
Abbreviations: CEC, circulating epithelial cell; CK, cytokeratin; HD, healthy donor; IF, immunofluorescent staining; IPMN, intraductal papillary mucinous neoplasm; PDAC, pancreatic ductal adenocarcinoma; RPM, reads per million.
IPMN lesions were distributed throughout the organ and had sizes ranging 5–40 mm in greatest extent. All were thin‐walled and most had either thin or no septations. Genetic mutations in KRAS and/or GNAS were identifiable in approximately half of the IPMN aspirates. These clinical and molecular analyses were used to classify IPMNs into low‐ and high‐risk lesions (Table 1). An additional seven IPMN patients did not have paired IF or ISH due to technical issues in which either IF or ISH was unable to be performed, and one patient had both IPMN and PDAC; hence, these patients were omitted from our analysis. Demographic and laboratory data for the HD and PDAC patients are shown in Tables 2 and 3.
In HDs, we detected negligible quantities of CECs by IF or RNA‐ISH (Fig. 2B, 2D; Table 3). By contrast, we detected many CECs via both modalities in patients with clinically localized pancreatic cancer (Fig. 2B, 2D; Table 2). The numbers of detectable CECs for both IF and RNA‐ISH assays were significantly higher in IPMN (median 3.2 cells per mL, p = .011 vs. HD for IF; median 9.5 cells per mL, p = .005 vs. HD for ISH) and PDAC (median 4.5 cells per mL, p = .002; median 8.4 cells per mL, p = .005) patients when compared with healthy controls (HD; median 0 cells per mL for both methods). Although there was a numerical increase in the counts by RNA‐ISH in the high‐risk IPMN group compared with the low‐risk IPMN group (Table 1), this difference was not statistically significant. This lack of statistical distinction may have been due to the small number of high‐risk IPMN samples processed. Utilizing a threshold of at least two cells per mL using either IF or RNA‐ISH—a threshold that identifies all PDAC patient draws as “positive”—14 of 16 (88%) samples from IPMN patients serially drawn at various stages of treatment would be scored as positive by our combined assay.
As a complementary approach, we performed CEC RNA‐seq to identify genes that can increase the specificity of the assay. Unlike DNA‐based genomic approaches, RNA can provide signatures that are consistent with lineage or tissue specificity. In evaluating the literature for markers that would provide higher tissue specificity for IPMN and PDAC, we chose the MUC gene family. The MUC genes are well‐established to be overexpressed in both premalignant and malignant pancreatic tumors [15], [16]. In addition, MUC protein analysis of tissue and serum have been actively studied as biomarkers in IPMN and PDAC [17], [18]. We saw robust differential expression of five mucin genes (Fig. 2E; p < .05 for each), many of which have been previously shown to be expressed to varying degrees in different IPMN subtypes [19]. There was also a trend toward an increase in median expression level in the high‐risk IPMN cohort compared with the low‐risk IPMN cohort, but this difference was not statistically significant.
Discussion
We conclude that CECs can be detected in almost all patients with premalignant IPMN lesions. We isolated these cells using an antigen‐agnostic microfluidic chip and detected them with a unique combination of “standard” immunofluorescent protein staining and a novel fluorescent RNA‐ISH assay. We propose that our enhanced capture rate relative to prior published work is a consequence of the antigen‐agnostic nature of our microfluidic device and the increased sensitivity afforded by the RNA‐ISH assay. Notably, HSATII RNA has recently been detected in the serum of patients with PDAC and IPMNs by digital droplet PCR [20]. Finally, CEC RNA sequencing revealed the ability to identify MUC gene enrichment, providing an improved level of specificity to IPMN and PDAC CEC detection. Some mucin genes can also be expressed in subsets of other epithelial cancers (e.g., breast, colon, ovarian, and prostate [21]), but the likelihood that most patients harbored occult malignancy from these other sites was low. Notably, MUC1 protein expression on CTCs has been shown to be associated with worsened survival in PDAC patients [22]. Collectively, the multiple CEC analyses are highly complementary and point to the highly sensitive and specific isolation of CECs from both PDAC and IPMN patients. These results demonstrate the importance of evaluating orthogonal CEC analytical assays, like our current practice in tissue biopsies, which might unlock the full diagnostic potential of CECs in the clinical realm.
Of note, although the ISH and IF results were almost always qualitatively concordant, there were patients in whom CECs were detected by one method and not the other. This could be caused by combination of Poisson sampling of these rare cells and technical performance of one of the enumeration methods. In addition, there were two outliers—one in the high‐risk IPMN group and one in the localized PDAC group—that each had an order of magnitude higher CEC count by immunofluorescence than any of the others. There were no obvious clinical or other factors (e.g., progressive or metastatic disease, rising serum biomarkers) that explained these outliers. Altogether, these features highlight the importance of orthogonal approaches to detect CTCs/CECs to enhance the sensitivity and accuracy of detection.
Conclusion
Our results expand upon prior work demonstrating that CTCs can be released early during tumorigenesis and that CECs released from premalignant tumors can enter the circulation prior to development of clinically detectable cancer in mouse models [6]. Our results—detecting CECs in 88% of patients with IPMNs—demonstrate a significant improvement in sensitivity when compared with prior work that captured CECs in only one‐third of patients with IPMNs [7]. Given the known risk in patients bearing these premalignant lesions of developing pancreatic cancer [8], there is a clear clinical need to clarify the significance of CECs. Complicating factors include the uncertain temporal dynamics of CEC release, the variable half‐lives of CECs within the circulation, and the phenotypic heterogeneity of these cells. More detailed analyses will be needed to understand the breadth of CEC phenotypes, and indeed these analyses are underway. Nonetheless, the unparalleled sensitivity and specificity of CEC isolation and detection demonstrated here provide the foundation for CECs to be used as a liquid “pancreas biopsy” and a blood‐based early detection platform for pancreatic cancer.
Acknowledgments
We thank all laboratory members for helpful discussions. This work was supported by the Howard Hughes Medical Institute (D.A.H.), the National Foundation for Cancer Research (D.A.H.), National Institutes of Health (NIH) Grants R01CA129933 (D.A.H.) and 2U01EB012493 (M.T., D.A.H.), the Burroughs Wellcome Fund (D.T.T.), NIH Grant K12CA087723‐11A1 (D.T.T.), Department of Defense Grant W81XWH‐13‐1‐0237 (D.T.T.), the Warshaw Institute for Pancreatic Cancer Research (D.T.T.), the Verville Family Pancreatic Cancer Research Fund (D.T.T.), the Susan G. Komen for the Cure Grant KG09042 (S.M.), and the NCI Federal Share Program and Income (S.M.).
Contributed equally
Contributor Information
William R. Brugge, Email: brugge.william@mgh.harvard.edu
David T. Ting, Email: dting1@mgh.harvard.edu
Author Contributions
Conception/design: Joseph W. Franses, Omer Basar, Abdurrahman Kadayifci, William R. Brugge, David T. Ting
Collection and/or assembly of data: Joseph W. Franses, Osman Yuksel, Melissa Choz, Joseph Licausi, Kshitij S. Arora, Anupriya S. Kulkarni
Data analysis and interpretation: Joseph W. Franses, Omer Basar, Abdurrahman Kadayifci, William R. Brugge, David T. Ting
Manuscript writing: Joseph W. Franses, Omer Basar, Mehmet Toner, Shyamala Maheswaran, Daniel A. Haber, David P. Ryan, William R. Brugge, David T. Ting
Final approval of manuscript: Joseph W. Franses, Omer Basar, Mehmet Toner, Shyamala Maheswaran, Daniel A. Haber, David P. Ryan, William R. Brugge, David T. Ting
Disclosures
Massachusetts General Hospital and the authors have applied for patent protection for the CTC‐Chip technology and analytic platforms.
References
- 1. Rahib L, Smith BD, Aizenberg R et al. Projecting cancer incidence and deaths to 2030: The unexpected burden of thyroid, liver, and pancreas cancers in the United States. Cancer Res 2014;74:2913–2921. [DOI] [PubMed] [Google Scholar]
- 2. Allen PJ, Kuk D, Castillo CF et al. Multi‐institutional validation study of the American Joint Commission on Cancer (8th edition) changes for T and N staging in patients with pancreatic adenocarcinoma. Ann Surg 2017;265:185–191. [DOI] [PMC free article] [PubMed] [Google Scholar]
- 3. Haber DA, Velculescu VE. Blood‐based analyses of cancer: Circulating tumor cells and circulating tumor DNA. Cancer Discov 2014;4:650–661. [DOI] [PMC free article] [PubMed] [Google Scholar]
- 4. Stott SL, Lee RJ, Nagrath S et al. Isolation and characterization of circulating tumor cells from patients with localized and metastatic prostate cancer. Sci Transl Med 2010;2:25ra23. [DOI] [PMC free article] [PubMed] [Google Scholar]
- 5. Celià‐Terrassa T, Kang Y. Distinctive properties of metastasis‐initiating cells. Genes Dev 2016;30:892–908. [DOI] [PMC free article] [PubMed] [Google Scholar]
- 6. Rhim AD, Mirek ET, Aiello NM et al. EMT and dissemination precede pancreatic tumor formation. Cell 2012;148:349–361. [DOI] [PMC free article] [PubMed] [Google Scholar]
- 7. Rhim AD, Thege FI, Santana SM et al. Detection of circulating pancreas epithelial cells in patients with pancreatic cystic lesions. Gastroenterology 2014;146:647–651. [DOI] [PMC free article] [PubMed] [Google Scholar]
- 8. Crippa S, Capurso G, Cammà C et al. Risk of pancreatic malignancy and mortality in branch‐duct IPMNs undergoing surveillance: A systematic review and meta‐analysis. Dig Liver Dis 2016;48:473–479. [DOI] [PubMed] [Google Scholar]
- 9. Ozkumur E, Shah AM, Ciciliano JC et al. Inertial focusing for tumor antigen‐dependent and ‐independent sorting of rare circulating tumor cells. Sci Transl Med 2013;5:179ra47. [DOI] [PMC free article] [PubMed] [Google Scholar]
- 10. Ting DT, Wittner BS, Ligorio M et al. Single‐cell RNA sequencing identifies extracellular matrix gene expression by pancreatic circulating tumor cells. Cell Rep 2014;8:1905–1918. [DOI] [PMC free article] [PubMed] [Google Scholar]
- 11. Ting DT, Lipson D, Paul S et al. Aberrant overexpression of satellite repeats in pancreatic and other epithelial cancers. Science 2011;331:593–596. [DOI] [PMC free article] [PubMed] [Google Scholar]
- 12. Yu M, Ting DT, Stott SL et al. RNA sequencing of pancreatic circulating tumour cells implicates WNT signalling in metastasis. Nature 2012;487:510–513. [DOI] [PMC free article] [PubMed] [Google Scholar]
- 13. Tanaka M, Fernández‐del Castillo C, Adsay V et al. International consensus guidelines 2012 for the management of IPMN and MCN of the pancreas. Pancreatology 2012; 12:183–197. [DOI] [PubMed] [Google Scholar]
- 14. Wu J, Matthaei H, Maitra A et al. Recurrent GNAS mutations define an unexpected pathway for pancreatic cyst development. Sci Transl Med 2011;3:92ra66. [DOI] [PMC free article] [PubMed] [Google Scholar]
- 15. Andrianifahanana M, Moniaux N, Schmied BM et al. Mucin (MUC) gene expression in human pancreatic adenocarcinoma and chronic pancreatitis: a potential role of MUC4 as a tumor marker of diagnostic significance. Clin Cancer Res 2001;7:4033–4040. [PubMed] [Google Scholar]
- 16. Moschovis D, Bamias G, Delladetsima I. Mucins in neoplasms of pancreas, ampulla of Vater and biliary system. World J Gastrointest Oncol 2016;8:725–734. [DOI] [PMC free article] [PubMed] [Google Scholar]
- 17. Maker AV, Katabi N, Gonen M et al. Pancreatic cyst fluid and serum mucin levels predict dysplasia in intraductal papillary mucinous neoplasms of the pancreas. Ann Surg Oncol 2011;18:199–206. [DOI] [PMC free article] [PubMed] [Google Scholar]
- 18. Sierzega M, Młynarski D, Tomaszewska R et al. Semiquantitative immunohistochemistry for mucin (MUC1, MUC2, MUC3, MUC4, MUC5AC, and MUC6) profiling of pancreatic ductal cell adenocarcinoma improves diagnostic and prognostic performance. Histopathology 2016;69:582–591. [DOI] [PubMed] [Google Scholar]
- 19. Castellano‐Megías VM, Andrés CI, López‐ Alonso G et al. Pathological features and diagnosis of intraductal papillary mucinous neoplasm of the pancreas. World J Gastrointest Oncol 2014;6:311–324. [DOI] [PMC free article] [PubMed] [Google Scholar]
- 20. Kishikawa T, Otsuka M, Yoshikawa T et al. Quantitation of circulating satellite RNAs in pancreatic cancer patients. JCI Insight 2016;1:e86646. [DOI] [PMC free article] [PubMed] [Google Scholar]
- 21. Xia P, Choi AH, Deng Z et al. Cell membrane‐anchored MUC4 promotes tumorigenicity in epithelial carcinomas. Oncotarget 2017;8:14147–14157. [DOI] [PMC free article] [PubMed] [Google Scholar]
- 22. Dotan E, Alpaugh RK, Ruth K et al. Prognostic significance of MUC‐1 in circulating tumor cells in patients with metastatic pancreatic adenocarcinoma. Pancreas 2016;45:1131–1135. [DOI] [PMC free article] [PubMed] [Google Scholar]


